


Abstract
Transverse spatial modes of light offer a large state-space with interesting physical properties. For exploiting these special modes in future long-distance experiments, the modes will have to be transmitted over turbulent free-space links. Numerous recent lab-scale experiments have found significant degradation in the mode quality after transmission through simulated turbulence and consecutive coherent detection. Here, we experimentally analyze the transmission of one prominent class of spatial modes—orbital-angular momentum (OAM) modes—through 3 km of strong turbulence over the city of Vienna. Instead of performing a coherent phase-dependent measurement, we employ an incoherent detection scheme, which relies on the unambiguous intensity patterns of the different spatial modes. We use a pattern recognition algorithm (an artificial neural network) to identify the characteristic mode patterns displayed on a screen at the receiver. We were able to distinguish between 16 different OAM mode superpositions with only a ∼1.7% error rate and to use them to encode and transmit small grayscale images. Moreover, we found that the relative phase of the superposition modes is not affected by the atmosphere, establishing the feasibility for performing long-distance quantum experiments with the OAM of photons. Our detection method works for other classes of spatial modes with unambiguous intensity patterns as well, and can be further improved by modern techniques of pattern recognition.
Export citation and abstract BibTeX RIS

Content from this work may be used under the terms of the Creative Commons Attribution 3.0 licence. Any further distribution of this work must maintain attribution to the author(s) and the title of the work, journal citation and DOI.
The angular momentum of photons consists of two different components. The first one is the spin angular momentum (SAM), which defines the polarization of photons. The second component is the orbital angular momentum (OAM), which corresponds to the spatial phase distribution of the photon. Both components have been used extensively in optical experiments at the lab-scale. Furthermore, polarization has been successfully used in quantum experiments over free-space links on the order of 100 kilometers [1–3]. The polarization of a photon, while being easily controllable and immune to atmospherical influences, resides in a two-dimensional state-space. This places an inherent limit on how much information one can send per photon. As a consequence, it sets a tight bound on how much error a quantum key distribution (QKD) system that uses such encoding can tolerate [4, 5]. An alternate way to encode information is in the OAM degree-of-freedom of a photon, which offers a theoretically unbounded number of discrete levels [6, 7] and is able to improve classical [8–10] communication as well as quantum communication [11, 12]. Light carrying OAM has a 'twisted' or helical wave front with an azimuthal phase that varies from 0 to 2 πℓ. The integer ℓ stands for the topological charge or helicity, and ℓℏ is the OAM of the photon [13].
The ability to transmit OAM modes over free-space is crucial in order to take such lab-scale experiments into the real world. Several theoretical studies have analyzed the behavior of OAM light beams in a turbulent atmosphere [14–19]. Based on these studies, atmospheric turbulence has been simulated in the laboratory using spatial light modulators, heat pipes and rotating phase plates [20–22]. The results give us reason to assume that the long-distance free-space transmission of OAM modes is very challenging or even unfeasible, since refractive index fluctuations lead to severe crosstalk at the receiver. Recently, this detrimental effect of the atmosphere has been confirmed by two laboratory experiments that simulated a 1 km turbulent path [23, 24]. While experiments with twisted radio waves for classical data transmission have been performed over ∼450 m in a free-space link in a city [25], the same has not yet been possible for optical frequencies because of the sensibility of the visible light to turbulence. The only two experiments that go beyond typical laboratory distances are in [26], which analyses a classical OAM mode transmission over 15 meters, and in [27], which uses a polarization-OAM hybrid system for quantum key distribution over 210 meters. The latter experiment has been performed in a big hall to minimize the difficulties with the turbulent atmosphere.
The studies mentioned above employed coherent mode detection. Different OAM beams are generated from Gaussian beams using holographic transformations at the sender and then transmitted through a simulated atmosphere. At the receiver, the transmitted modes are transformed back to Gaussian beams in order to analyze the quality of the OAM modes after free-space propagation. However, such transformations [28–30] rely on the axis-dependent decomposition of modes and are extremely sensitive to the angle of arriving (AOA) fluctuations and to beam wander. As the effect of atmospherical turbulence on the beam propagation can be decomposed into different orders of Zernike polynomials [31], the difficulty in using such techniques can be explained rather intuitively. Beam wander (lateral tilts) is the first order contribution of the atmosphere, which influences such phase-measurement-based detection schemes significantly. Additionally, higher order contributions, such as defocusing, astigmatism or coma, further reduces the mode transformation quality and efficiency, for instance, due to inefficient identification of a defocused Gaussian mode.
In this work, we transmitted OAM superposition modes of light over a 3 km intra-city link in Vienna under strong-turbulence conditions. We employ an incoherent detection scheme by directly observing the unambiguous mode-intensity patterns on a screen with the help of a standard adaptive pattern recognition algorithm. This method avoids coherent phase-dependent measurements for identifying the transmitted OAM modes and is therefore not affected by the atmospheric contribution described above. We transmitted 16 different mode superpositions (l = ±0, ±1,...±15) and could distinguish them with an average error rate of only ∼1.7%. Additionally, we analyzed the atmospheric effect on the relative phase of these superpositions, which is a crucial property for verifying the quantum entanglement of OAM modes in future experiments. We found that the relative phase is only slightly affected by turbulence, which favors the use of petal patterns in the experiment. An experiment that exploits the stability of relative phases to verify long-distance OAM entanglement could use a polarization-OAM hybrid entangled state; the polarization is measured locally and triggers a distant ICCD, which detects the OAM photon; this is similar to the analogue lab-scale experiment in [32].
We have chosen OAM superposition modes due to their interesting physical properties and well-developed methods to detect quantum entanglement in future experiments. However, this approach not only works for OAM superposition modes but also for every spatial mode structure with unambiguously distinguishable intensity patterns. The highly symmetric petal patterns of OAM superpositions seem to be advantageous in turbulent conditions in order to correctly identify the modes with a pattern recognition algorithm. It might be interesting to analyze whether different spatial mode structures (such as Hermite–Gaussian beams, self-healing Bessel beams [33] or generalizations such as Ince–Gaussian modes [34]) are identifiable in a more robust way. Another interesting open question is the scaling of the pattern recognition quality with the number of photons detected, namely how many photons are required to identify an intensity pattern within a given error and how turbulence affects these numbers. It will be interesting to investigate this question in a future experiment.
The experimental setup for sending and receiving OAM modes over the city of Vienna can be seen in figure 1. The sender was located in a ∼35 m high radar tower of Zentralanstalt für Meteorologie und Geodynamik (ZAMG, Central Institute for Meteorology and Geodynamics). The receiver was on the rooftop of our institute building, 3040 meters away. We had a 20 mW laser at the sender with a wavelength of 532 nm. The light from the laser was modulated by a spatial light modulator (SLM), which impressed the phase information of the OAM modes onto the beam. Then, it was expanded by a telescope to a diameter of approximately 6 cm and sent with a high-quality f = 30 cm lens to the receiver. The received mode intensity profiles were observed on a screen and recorded with a CCD camera.
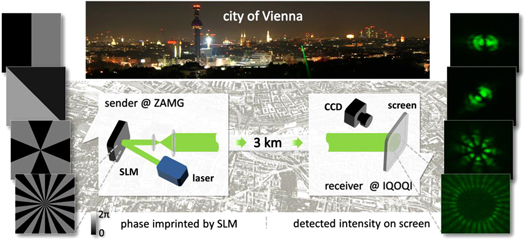
Figure 1. Sketch of the experimental setup. The 3 kilometer free-space experiment was performed in the city of Vienna, from ZAMG (Zentralanstalt für Meteorologie und Geodynamik, Central Institute for Meteorology and Geodynamics) to our institute IQOQI. Top: picture of an alignment laser from IQOQI to ZAMG, captured at ZAMG. Left: the sender modulates a 532 nm laser with an SLM. The different phase holograms that modulate the beam are shown; they correspond to superpositions of OAM modes (from top to bottom) with l = ±1, l = ±1 rotated, l = ±4 and l = ±15. Right: at the receiver, we observe the transmitted modes and record them with a CCD camera. The images correspond to the modulated phases on the left. The size of the innermost intensity ring varies from approximately 12 cm for |LG±1> to 72 cm for |LG±15>. By analyzing the observed images, we characterize the atmospheric stability of the OAM modes and use them for transmitting real information. (Geographic pictures taken from Google Earth, ©2014 Google, Cnes/Spot Image, DigitalGlobe.)
Download figure:
Standard image High-resolution imageWe characterize the turbulence of the atmosphere in the following way: The atmospheric turbulence can be decomposed into cells with similar pressure, thus similar refractive index. Those 'fried cells' flow across the propagating path and randomly deflect the centroid of the beam in different directions. If the light beam is observed on a screen, it 'jumps' around on timescales of approximately 1 kHz. However, when averaged over time, the intensity's centroid position variation remains small. The magnitude of the short-term beam wander depends on the refractive index structure parameter and on path length L. It is characterized by the root-mean-square of the beam displacement from the time-averaged center. We measure the root-mean-square of the Gaussian beam size with images of 1/2000 s and 1/4000 s integration times and with images of 20 s integration times. From these values, we calculated a Fried parameter of r0 = 1.4 cm and an atmospheric structure constant of Cn2 = 7.7*10−15 m−2/3 using the Kolmogorov theory of atmospheric turbulence [35–37]. These parameters correspond to strong turbulence conditions [23, 24].
Mathematically, OAM modes of light can be described by Laguerre–Gauss functions |LGℓ> with a spiral phase distribution exp(iℓφ), where ℓ defines the OAM mode number of photons that can take any integer value [13]. In our experiment, we sent light in superpositions of higher-order OAM modes. The complete state can be denoted by

where α denotes the relative phase between the two modes, which corresponds to a rotation of the phase and intensity structure. The transverse phase structure of an OAM-superposition |LG±ℓ> is radially symmetric and has 2ℓ phase jumps of π in the azimuthal direction. Its intensity distribution shows 2ℓ maxima and minima arranged in a ring (figure 1).
The size of the detected modes were between 12 cm for |LG±1> to 72 cm for |LG±15>; the final beam size variation is mainly due to diffraction. The size of the intensity of our modes scales linearly with ℓ, as is expected for holographic generation without intensity shaping [38]. The size can be reduced significantly by applying intensity shaping on the SLM or by using non-diffractive beams such as Bessel beams. In our experiment, however, beam size was not an issue.
To analyze the intensity structure of the received modes, we use a standard adaptive pattern recognition algorithm in the form of an artificial neural network [39, 40]. In the 'training' or initialization phase, the algorithm receives a number of recorded images in order to autonomously learn how to recognize the different patterns. After this initialization, the algorithm is ready to analyze the real data in the form of images. The working principle is explained with a simplified example in figure 2. As the neural network is trained with images involving atmosphere-induced disturbances, it automatically develops a robust detection despite such effects. A significant advantage of our method is that no further image corrections need to be performed.
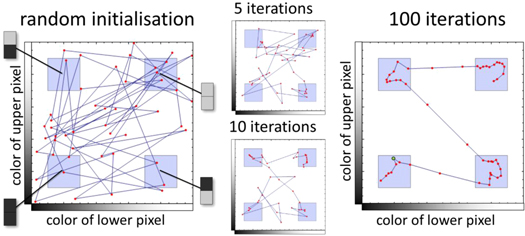
Figure 2. Working principle of the artificial neuronal network (ANN) described by an example of four different grayscale images with only two pixels each. A network with a chain of 50 neurons is initialized (left). The neurons (red dots) are connected to their neighbors, as indicated by the blue lines. Every neuron is assigned a random position in 2-dimensional space that corresponds to their grey value (the color of the upper pixel corresponds to a position at the y-axis; the lower one corresponds to the x-axis). In each subsequent step, the ANN receives one out of four possible two-pixel images (dark-dark, dark-bright, bright-dark, bright-bright), which also corresponds to a coordinate in the two-dimensional space. Due to 'virtual turbulence', the color of the images might be changed slightly, resulting in a two-dimensional region (indicated by blue squares) rather than a single position. For each input image, the position of the winner neuron (the neuron closest to the input image) is pulled strongly toward the input image. The positions of the winner neuron's neighbors are pulled toward the input picture as well—but less significantly. After a few iterations (middle), the initially random network organizes itself and finds the structure of the input in an unsupervised way (right). After the training phase, we can assign each neuron with the information of the corresponding image (for example, the green neuron in the right picture belongs to the dark-dark image). For this, we input perturbed images (for instance, a dark-dark image), and assign the information about the image to the winner neuron (for example, to the green neuron). As soon as most of the neurons have been assigned the information of a specific image, the network can be used for identifying unknown images. To identify unknown images, we again calculate the winner neuron for each image and get the image information assigned to the neuron. In the example above, 5 out of 50 neurons in the final network lie outside the blue area; it is likely that they will never be a winner neuron and thus could be removed from the network (for computational speedup). In our experiment, the inputs are images with 720 × 720 = 518 400 pixels; thus, the size of the virtual neuronal network space is 518 400-dimensional. In that space, the ANN autonomously categorizes the 16 input structures that describe our different OAM mode superpositions.
Download figure:
Standard image High-resolution imageIn the first step, we investigate whether the characteristic mode patterns of different modes can be distinguished after free-space transmission. For that, we analyze the crosstalk between the first 16 OAM mode-superpositions |LG±ℓ> (with α = 0), from ℓ = 0 up to ℓ = 15 at the receiver. For each transmitted ℓ-value, we accumulated approximately 450 received mode-intensity images, which served as the input for our algorithm. As a result, we obtained the detected ℓ-value of the received mode. By comparing the prepared and measured ℓ-values, we can calculate the Cross Talk Matrix between the different OAM modes, which is shown in figure 3(A). For the superpositions of |LG0> up to |LG±15>, we find a good distinguishability with an average error rate of 1.7%. The error is defined as the ratio between the wrong detected modes and all of the detected modes.
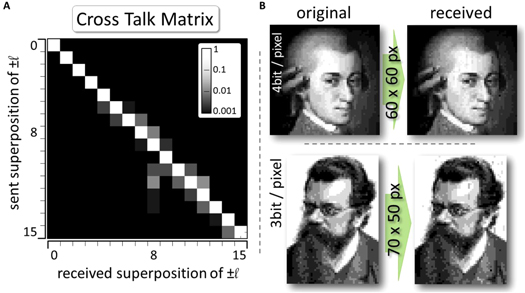
Figure 3. (A) The Cross Talk Matrix for different OAM superposition settings (in logarithmic scale). The Cross Talk Matrix shows the distinguishability of OAM mode superpositions from |LG0> to |LG±15> (the corresponding images in figure 1). We can distinguish the modes with an average error rate of 1.7% and a channel capacity of 3.89 bits. (B) We transmit two grayscale images encoded in these OAM-mode superpositions. The upper image (Wolfgang Amadeus Mozart) has 4 bits per pixel, which corresponds to 16 grayscale settings. As a result, the full available set of modes was used to encode this image. The received image has a bit error ratio of 1.2%. The lower image (Ludwig Boltzmann) has 3 bits per pixel, which required 8 different modes. The average error rate for this image is measured to be 0.8%.
Download figure:
Standard image High-resolution imageTo illustrate the quality of the received modes, we used these 16 different states for encoding two greyscale images with 8 and 16 different grayscale values (which correspond to 3 bits and 4 bits per pixel, respectively). Each transmitted mode carries the information of one pixel of the image. The mode |LG0> corresponds to black values, while higher-order modes correspond to grey values. The highest mode in the alphabet (|LG±7> for 3 bits and |LG±15> for 4 bits) corresponds to the white value. The maximum frame rate of the SLM is 60 Hz; for the camera, we used 50 Hz. As the SLM and the CCD camera were not synchronized, and the liquid crystal display of the SLM was slow due to the low environment temperature of ∼5 –10 °C, we displayed each mode for 10 SLM frames. Between two modes, the beam was deflected for 4 frames to distinguish between the subsequent modes. Thus, the transmission rate was 4 pixel sec−1. The transmitted and decoded image can be seen in figure 3(B). The error rates in the decoded 3 bit and 4 bit images are 0.8% and 1.2%, respectively. The bit error is defined as the ratio between the wrong bits in the decoded image and all of the bits of the images.
As mentioned above, the relative phase α of OAM superpositions is crucial for verifying quantum entanglement of OAM modes in potential future experiments. Hence, we analyzed the stability of α under atmospheric turbulence in the second step. By changing the relative phase, one can access the whole equator of the qubit Bloch sphere and thus have access to two different mutually unbiased bases (MUBs). A high visibility in those two MUBs would be sufficient to verify entanglement [41]. For OAM modes, the relative phase rotates the intensity pattern of the mode, which we can directly observe.
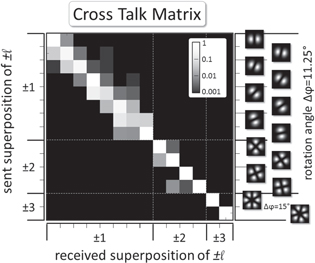
We changed the relative phase in modes |LGα±1> and |LGα±2> with step sizes of 11.25° and analyzed their distinguishability with the pattern recognition algorithm (figure 4). With this angle, the rotated modes could be distinguished with an error rate of 15.9%, averaged for |LGα±1> and |LGα±2>. When we omit every second measured phase angle and analyze the relative phases in 22.5° steps, we find an average error rate of only 0.7%.
Figure 4. Cross Talk Matrix for rotated mode patterns (in logarithmic scale). We send OAM superpositions of |LG±1>, |LG±2>, and |LG±3> with different relative phases, which leads to rotated intensity patterns by Δφ. The pattern recognition algorithm is able to distinguish them with an error ratio of 0.7% for angles of 22.5° and an error ratio of 15.9% for angles as small as 11.25°. The stability of relative phases is crucial for follow-up experiments on quantum entanglement of the OAM over large distances.
Download figure:
Standard image High-resolution image
The smaller error in the case of a 22.5° rotation angle compared to that for an 11.25° rotation angle is expected because the intensity patterns are rotated by twice the angle. Therefore, they are easier to distinguish. The small influence of the atmosphere on the relative phase α indicates the feasibility of quantum entanglement experiments with OAM over long distances. For such an experiment, we would need to extend our method to observe coincidence intensity patterns at the single-photon level [42]. We expect this to be possible by replacing our screen with a triggered ICCD camera without any mode transformation, as shown in [32]. While it is not known whether this detection method might be useful for quantum key distribution, it has the potential to detect interesting fundamental properties such as quantum entanglement.
In summary, we showed that information encoded in the OAM property of light can be extracted after propagation through a 3 kilometer intra-city link with strong turbulence. We characterized the rotational mode stability and found it to be very resistant to degradation by the atmosphere. Furthermore, it was possible to distinguish 16 different OAM modes, which we used to encode small grayscale images. Our findings also indicate that possible future long-distance quantum experiments with the OAM degree-of-freedom will be possible, even without adaptive optical systems [32, 42]. Furthermore, as the atmosphere does not destroy the modal structure, it should be sufficient to use tip-tilt correction at the receiving telescope in order to use conventional holographic OAM-detection methods [28–30]. The horizontal distance of 3 km of our transmission link is on the order of the effective vertical thickness of the atmosphere of 6 km [43], which suggests that earth-to-satellite links using OAM modes are not limited by atmospheric turbulence.
Acknowledgement
We thank the anonymous reviewer for his interesting suggestions for our manuscript; we also thank Roland Potzmann and ZAMG for providing access to the radar tower and Adam Wyrzykowski and William Plick for their help with the experiment. This work was supported by the European Commission (SIQS, No. 600645 EU-FP7-ICT) and by the Austrian Science Fund FWF with SFB F40 (FoQus). MM acknowledges support from the European Commission through a Marie Curie Fellowship.