


Abstract
Breakdown of wave transport due to strong disorder is a universal phenomenon known as Anderson localization (AL). It occurs because of the macroscopic population of reciprocal multiple scattering paths, which in three dimensional systems happens at a critical scattering strength. Intensities on these random loops should thus be highly increased relative to those of a diffusive sample. In order to highlight localized modes of light, we exploit the optical nonlinearities of TiO2. Power dependent and spectrally resolved time of flight distribution measurements in transmission through slabs of TiO2 powders at various turbidities reveal that mostly long loops are affected by nonlinearities and that the deviations from diffusive transport observed at long times are due to these localized modes. Our data are a first step in the experimental investigation of the interplay between nonlinear effects and AL in 3D.
Export citation and abstract BibTeX RIS

Content from this work may be used under the terms of the Creative Commons Attribution 3.0 licence. Any further distribution of this work must maintain attribution to the author(s) and the title of the work, journal citation and DOI.
1. Introduction
Anderson localization (AL) of quantum mechanical waves such as electrons in atomic lattices containing impurities was predicted more than 50 years ago [1] to account for the metal–insulator transition [2] observed at finite impurity densities. The analogous phenomenon of AL of classical waves such as light has been intensively studied since the mid 80s [3–6]. These studies underlined the fundamental nature of AL which originates from constructive interference of waves scattered along multiple scattering paths corresponding to localized modes, a phenomenon that should occur for any wave scattered in any sufficiently disordered medium. Quantum and classical localization essentially always take place for 1D and 2D systems [7] as demonstrated experimentally e.g. for microwaves [8, 9], light [10, 11] and cold atoms [12, 13]. In 3D, AL is physically more intriguing, but also more challenging to observe. This is due to the fact that 3D localization occurs only above a critical scattering strength [7, 14] which may be difficult to reach experimentally depending on the nature of the wave and the scattering material. In addition, the experimental observation of localized classical waves may also be obscured by several artifacts. For instance absorption in the bulk can easily lead to experimental signatures similar to AL [15, 16] and settling questions concerning such artifacts requires long and careful studies [17]. Other factors include leakage through the sample boundaries [18] or resonant scattering [19, 20]. So far, experimental evidence for 3D AL excluding these systematics has been obtained for visible light [21, 22], ultrasound [23] and ultracold atoms [24–26].
A careful quantitative study of bulk localizing samples is required to test simultaneously several long-standing key predictions concerning localized states and the localization transition [7]. On the one hand, this entails the observation of a slow-down of diffusion, using time-resolved measurements, by probing either the total transmission or spatially resolved intensity profiles. This has been achieved recently for sound waves [23] and visible light [21, 22], where the spatially resolved measures are such that the influence of absorption can be fully neglected [27]. In the optical 3D localization experiment, this allowed for a direct determination of the localization length which revealed its scaling with the samples' turbidity and provided a clear signature of the localization transition [22]. In addition, the shape of the spatial intensity distribution shows an exponential rather than a Gaussian profile, as predicted [10, 24], see supplementary material of [22]. On the other hand, one expects a great increase in the fluctuations of transmitted intensities of single speckles, because of a strong overpopulation of localized modes [11, 28], visible e.g. in a skewed (non-Rayleigh) intensity distribution, which have been observed in 3D experiments on ultrasound [23], but are only fully described for quasi 1D systems [29, 30].
In this work we take advantage of the nonlinear optical response of titania particles as scatterers to emphasize intensity dependent effects. The interplay between AL and nonlinear effects (NL) is a field of growing theoretical interest [31–33], but NL-experiments were reported so far only for a few 2D systems [6, 10, 11, 34]. One may anticipate that the positive Kerr nonlinearity of TiO2 [35–37] is significantly excited by the contribution of macroscopically populated localized modes, with a noticeable influence on the detected time of flight signals (TOF) from 3D slabs. This is analogous to the recent second harmonic study on AL in ZnO nanorod mats [11] and to random lasing from closed recurrent scattering loops in 3D [28]. In this work we use the frequency shifts incurred by these nonlinear effects in combination with stimulated Raman scattering [37] to highlight localized modes. Note that due to the macroscopic population of these modes above a critical turbidity, we expect a qualitative difference in the excitation of nonlinear effects as a function of turbidity, analogous to the strong Raman laser emission observed above threshold in multiply scattering BaSO4 powders [38].
Measuring wavelength-resolved TOF distributions in transmission we find increased non-exponential long time tails at wavelengths above and below the incident wavelength. The latter blue shifted signals exclude simple fluorescence contributions. Consistent with our non-frequency resolved earlier data [21, 22] the deviations from classical TOF scale with turbidity  as is expected for AL transition. Here, k denotes the wavevector and l* the transport mean free path. The values of the localization lengths thus obtained quantitatively agree with those from measurements of the time dependent spatial intensity profiles [22] over the entire kl*-range covered. The experimental study reported here thus complements our earlier non-wavelength-resolved results to study intensity distributions in our samples and is consistent with the observation of optical AL modes in 3D samples at elevated turbidities
  [39, 40]. Note that the value of the critical turbidity in this case is consistent with the Ioffe-Regel criterion which estimates a kl* of order unity for the transition to occur. However, there are no numerically accurate predictions for the value of the critical turbidity.
2. Methods
In order to be able to see the slow-down of the light diffusion we use a pulsed laser system consisting of a frequency doubled Nd:YVO4-laser with output power of 18 W pumping a Titanium–Sapphire oscillator, which subsequently pumps a frequency doubled OPO. We get a pulsed output of 1 W at 590 nm with a repetition rate of 76 MHz and a pulse duration of ≈250 fs. Furthermore, the central wavelength of the pulses can be tuned between 550 and 650 nm. We reduce the repetition rate with a pulse picker to be able to take data for time intervals longer than the repetition time of 13.2 ns. We operate the TOF measuring card (by B&H) at a total scan time of typically 20 ns with 1024 channels time resolution. The detector used was a hybrid photo multiplier HPM-100-40 (from B&H) avoiding the typical after-pulsing in standard photomultipliers thus increasing the time resolution. The samples consist of TiO2 nanoparticles with a particle diameter ranging between 170 and 245 nm and polydispersities between 25 and 45%, which are commercially available from DuPont. The TiO2 particles are in the rutile crystal structure for samples R700 (diameter 245 nm, polydispersity 45%) and R104 (diameter 230 nm, polydispersity 25%), which has a refractive index of 2.7. In one of our samples, a one-to-one mixture of anatase (refractive index 2.5, diameter 170 nm, polydispersity 45%) and rutile (R104 sample) nanoparticles was made (R104AA) in order to decrease the turbidity. Since the intensity of the light transmitted through the sample is very low typical spectral resolution techniques like interference spectrometers would either imply very long measurement times, thereby drastically reducing the signal-to-noise ratio, or they would fail because of the insufficient intensity. Therefore, instead, we use a set of interference band pass filters with bandwidths of 10 nm around a central wavelength indicated in figure 2 positioned between the sample and the detector.
3. Power dependent and spectrally resolved time of flight distribution
The nonlinear optical properties of TiO2 are well known (see e.g. [35–37]). They give rise to significant power dependent spectral broadening as revealed from near infrared transmission measurements on monomode titania waveguides [37], which are mostly due to stimulated Raman scattering providing a nonlinear, as well as inelastic response. In our samples, which consist of rather irregularly shaped polydisperse TiO2-particles (for a picture see [21]) there are no strict symmetry rules for the different NL-effects and hence many of them may occur and mix along the multiple scattering paths. We do expect, however, a power dependent spectral broadening qualitatively similar to [37]. The inset of figure 1 shows the dependence of the total time integrated transmission on the incident laser power for a sample with inverse turbidity  (R700, rutile). For all samples discussed here kl* was obtained from the width of the coherent backscattering cone [41–43]. Within error bars the total transmission increases linearly with incident power indicating that overall, nonlinear effects are rather weak, of order 10−5 or less. However, the time resolved data (see footnote 5) shown in figure 1 reveal a clear upturn of the long time tail which increases with increasing power. The upturn at long times is associated with the onset of AL [21] because the deviation from classical diffusion (indicated by the continuous line) strongly increases with increasing turbidity (figure 1 and [21]). Figure 1 shows that the upturn is clearly weaker for the essentially non-localizing sample R104AA than for the localizing sample R700. Both the long time intensity upturn at fixed incident power and its power dependence become weaker with increasing kl*, i.e. when moving away from the AL-transition. When the incident power is varied by five orders of magnitude, the intensity of the long-time tail is enhanced by less than a factor of three for both samples. This shows that while nonlinear effects are significant, they are weak. They manifest themselves primarily in the long time upturn, or slowing down of the decay, in TOF which was associated with AL [21]. While due to the diffusive spreading of the power density through the sample, nonlinear effects are a priori more likely to occur near the front surface, our data imply that they are also more likely within the localized modes in the bulk because of the higher intensity of these modes, consistent with [11]. NL effects can thus be used to enhance signatures of high intensity transmission modes in TOF more clearly. This is particularly important because in our samples the overall fraction of photons in the upturn, i.e. 'delayed' by AL is very small compared to the classically diffusing photons, even for high turbidities. In order to connect these high intensity transmission modes with AL in 3D systems, it is important to study the turbidity dependence, where these modes should only appear above a critical turbidity. This turbidity dependence is discussed in detail below.
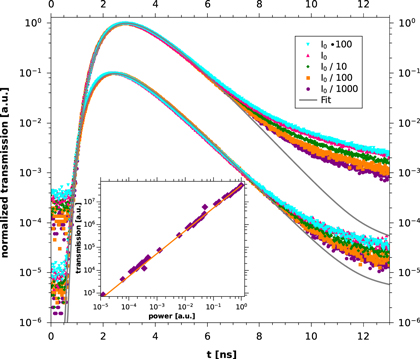
Figure 1. Power dependence of the time resolved and time integrated (inset) optical transmission. Inset: total transmission for sample R700 with  , L = 1.25 mm. Time resolved transmission5
for (top) sample R700 with
, L = 1.25 mm. Time resolved transmission5
for (top) sample R700 with  , L = 0.93 mm, (bottom) sample R104AA with
  , L = 1.00 mm at different incident intensities with
  . The continuous lines indicate the analytical solution of the classical diffusion equation for a slab with the indicated sample parameters convoluted with time dependent detector response function. The R104AA-data are down-shifted by one decade for clarity.
Download figure:
Standard image High-resolution imageWe now turn to the spectrally resolved data. Figure 2 shows results of TOF measurements for a sample with rather modest turbidity ( ) compared to one with high turbidity (
 ) taken at fixed incident wavelength
  , fixed incident power
  and different spectral shifts indicated by the center wavelength
  of the band pass filter inserted between sample and detector. Given that these are data at a fixed incident intensity, we here mainly probe inelastic component, which we associate with the nonlinear stimulated Raman scattering [37]. Contributions from direct coupling to e.g. phonons, while unlikely given the intensity dependent measurements of figure 1, can not be excluded in these data.
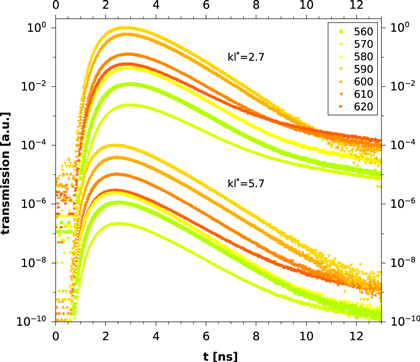
Figure 2. Time of flight distributions for fixed incident wavelength  nm (
nm ( ) at different detected spectral shifts as indicated by the central wavelength of the bandpass filter
  for sample R700, (
 , L = 0.93 mm) and sample R104AA (
 , L = 0.94 mm). The latter data are down-shifted by 4 decades for clarity.
Download figure:
Standard image High-resolution imageThe TOF data shown were corrected for the different optical densities of the band pass filters at the central wavelengths and the detector dark noise subtracted so that they show the relative wavelength dependent transmission3
. In both samples the overall transmission is highest at the incident wavelength and the spectrally shifted intensities rapidly decrease with increasing frequency shift away from λ. This illustrates that the major part of the transmitted light has undergone elastic scattering and classical diffusion, even for  . In the less turbid sample the shape of the TOF signal does not significantly depend on the detected frequency and essentially agrees with classical photon diffusion (see figure 3). However, from figure 2 it is evident that the more turbid (localizing) sample shows much higher upturns at long times relative to the transmission peak than the less turbid (non-localizing) sample. This can also be seen when looking only at the elastically scattered light, which is separately shown for clarity in figure 3. The relative upturn increases with increasing frequency shift rather independent on the sign of the shift which basically excludes simple fluorescence contributions. Note also that the observed spectral broadenings are qualitatively consistent with the power dependent nonlinearities and stimulated Raman scattering reported for titania waveguides [37]. While a quantitative account of the observed frequency shift in terms of nonlinear processes remains a challenging issue for our granular powders, the fact that the frequency shifted nonlinear upturn increases strongly with decreasing kl* indicates that above a critical turbidity, long-lived modes are more highly populated, exciting nonlinear effects more strongly. This is consistent with a picture of AL, where after the transition to localization AL-modes are strongly populated [44], which have a relatively increased intensity, as has been found in [23]. These high intensity modes can then more strongly excite e.g. stimulated Raman scattering leading to a strong increase in frequency shifted TOF contributions.
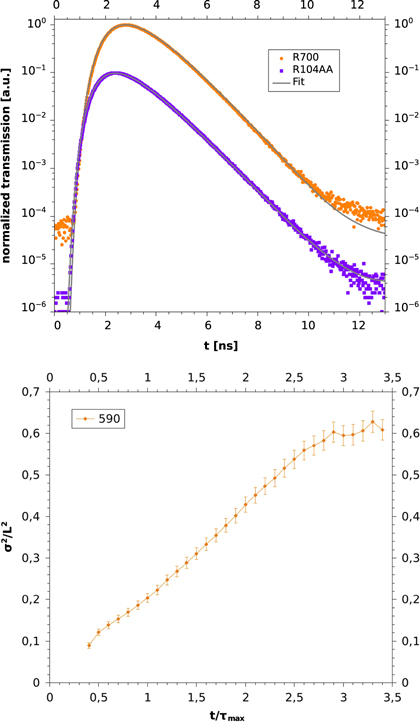
Figure 3. (a) Time of flight distributions for fixed incident wavelength  nm with bandpass filter set to the incident wavelength. For sample R700, (
 , L = 0.93 mm) and sample R104AA (
 , L = 0.94 mm). These data are also part of figure 2. Continuous lines like figure 1. (b) The width of the photon distribution as determined in [22], but with an added bandpass filter set to the incident wavelength for R700 (
 , L = 0.86 mm).
Download figure:
Standard image High-resolution imageIt should be noted that figure 2 also shows that the inelastic contribution does not exceed the elastic contribution, as was claimed recently to argue against a signature of localization in the saturation of the width of the photon distribution at long times [39]. Therefore, this direct sign of AL can still be observed when only studying the non-frequency shifted part, shown in figure 3. In addition, the figure shows the elastic contribution of the temporal increase of the width of the photon distribution as determined in [22], where a clear saturation can be seen [40]. This shows that the late time modes are spatially localized even in the elastic case. Considering the TOF data in figure 2, one can see that the strong classically scattered light, which is diffusing as well as absorbed, overrides and therefore hides the long time tail when the bandpass filter is set close to the incident wavelength. Here it is important to note that absorption still plays a role in TOF measurements and this absorption can dominate the decay modes. However, when selecting the inelastic contribution by frequency shifted detection, this diffusing and absorbing part is largely suppressed4 thus highlighting the long time tail due to AL, which is directly seen in the spatially resolved measurements, where absorption is canceled out of the experiment.
The same conclusion can be drawn from another experiment (figure 4) were we varied the turbidity  by varying the incident wavelength for a single given sample (R700). The increase in refractive index of rutile with decreasing wavelength leads to a significant reduction of kl* from 3.7 to 1.9 (linear interpolation), shown in the inset to figure 4. Note that here we are changing kl* in a completely independent way from the experiment above, such that effects of sample quality, pressure induced fluorescence, etc can be ruled out. When changing kl* this way by a factor close to two, the corresponding long time upturn relative to the classical diffusive signal changes by about two orders of magnitude which is spectacular (see figure 5 for the excess signal Ξ (see footnote 6) in the long time tail). At the same time, the photon diffusion constant D0 merely changes by 50% as directly seen from the small shift of the maximum of the TOF curves and from the data shown in figure 5(a). This comparatively small change of D0 is consistent with the modest change in kl*. These observations clearly indicate critical behavior of the upturn in the vicinity of a transition to AL. The kl*-range of the critical behavior is in quantitative agreement with the observations of spectrally unresolved TOF [45] and the time resolved transmission profiles [22]. Finally, we can look at the spectral shifts of the TOF data for these experiments. This is shown in figure 5(b), where we plot TOF data at three different incident wavelengths, corresponding to three different values of kl* = 3.5, 2.6 and 2.2 with a corresponding spectral filter below the incident wavelength as given in the figure legend. We observe the same trend of a strong increase of the spectral shifts at long times with decreasing kl*. Note that the data for kl* = 2.6 correspond to one of the curves shown in figure 2 (R700).
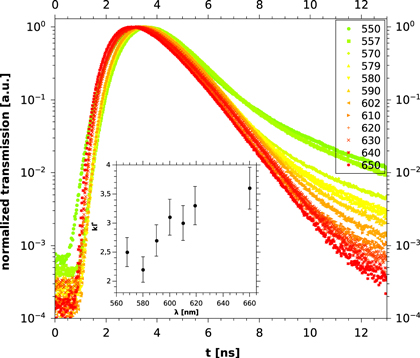
Figure 4. Time of flight distributions for various incident wavelengths  without band pass filter behind the sample. Sample R700, (
 , L = 0.98 mm),
  . Inset: wavelength dependence of the inverse turbidity kl*.
Download figure:
Standard image High-resolution image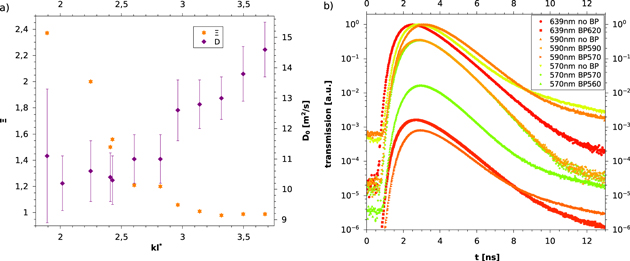
Figure 5. (a) Dependence of the classical photon diffusion constant D0, as obtained from a fit to classical diffusion, and a quantification Ξ
6 of the excess of photons at long times on the sample turbidity  . Data are for the sample described in figure 3(b). Time dependence of the spectrally shifted excess for different turbidities. The plot shows TOF distributions for three different experiments determining the spectral shifts corresponding to values of
  (red), 2.6 (orange) and 2.2 (green). Data are for the sample described in figure 2 (R700).
Download figure:
Standard image High-resolution imageThus, the observations reported here show conclusively that below a critical value of kl*, long photon paths become increasingly populated. This is shown by the increased frequency shifts at long times, which only appear at low kl* and at long times, where we varied kl* in two independent ways with quantitatively comparable results. These results are similar to previous evidence for AL based on the direct determination of the width of the diffusing photon distribution [22]. This, we believe, rules out an alternative interpretation of our data, which would not show a critical turbidity [39, 40].
4. Conclusion
In conclusion we have measured photon time of flight distributions in transmission through optically thick slabs ( ) of powders of TiO2 as function of incident power, incident wavelength and detected wavelength. This allowed to vary the turbidity
  in two independent ways, either by the wavelength dependence of the scattering cross section or by the packing fraction. We find deviations of the time of flight distribution from classical diffusion at long times which show that photons with long transit times spend significantly more time inside the sample than expected from classical diffusion. The number of these 'delayed' photons dramatically increases with increasing turbidity. The scaling of this deviation with the turbidity
  signals a progressive slowing down of photon diffusion with time at long times consistent with the transition to AL. The nonlinear optical response of TiO2 provides a significant spectral broadening which, combined with the nonlinear increase of the number of 'delayed' photons with incident laser power, allows to strongly enhance the contributions of localized modes to the TOF signals, thus allowing the use of nonlinearities as a probe for the skewed intensity distribution in localized modes at long times.
While the nonlinear effects as well as the fraction of detected photons from within the localized modes are still small compared to the overall classically diffusing photons in our samples the coupling between the nonlinear effects and AL will be of great interest in the future. For instance, it has been discussed that the critical point of AL changes in nature in the presence of negative nonlinearities [33]. In the case of positive nonlinearities, as is the case in TiO2, localization may be enhanced [10, 32], which may also explain the fact that in our experiments the critical value of kl* is somewhat higher than the usually expected value of  [14]. This however remains to be studied in future investigations.
Acknowledgements
We acknowledge support by the Deutsche Forschungsgemeinschaft (DFG), the Center for Applied Photonics (CAP), University of Konstanz and the Schweizerischer Nationalfonds (SNF).
Footnotes
- 5
TOF data shown here correspond to raw transmission counts for a time span determined to reach 65536 counts in the highest bin. They are not deconvoluted with respect to the laser pulse dark count levels and temporal response of detector.
- 3
The wavelength dependence of the photo multiplier can be neglected.
- 4
The leakage of the elastically scattered light at
 nm through the different band pass filters is quantified by their optical density BP560 nm (4.1), BP570 nm (4.4), BP580 nm (2.3), BP590 nm (0.4), BP600 nm (1.1), BP610 nm (2.8) , BP620 nm (4.1)
 - 6
The excess of the signal is quantified by the time integral of the ratio of the TOF data and the diffusive fit over a time window of 2
to 3.5 : .


