


Abstract
Using an Atomic Force Microscope (AFM) with a 5.3 μm diameter spherical probe, we determined mechanical properties of individual human mammary epithelial cells. The cells were derived from a pair of cell lines that mimic cell progression through four phases of neoplastic transformation: normal (non-transformed), immortal, tumorigenic, and metastatic. Measurements on cells in all four phases were taken over both the cytoplasmic and nuclear regions. Moreover, the measurements were made for cells in different microenvironments as related to cell–cell contacts: isolated cells; cells residing on the periphery of a contiguous cell monolayer; and cells on the inside of a contiguous cell monolayer. By fitting the AFM force versus indentation curves to a Hertz model, we determined the pseudo-elastic Young's modulus, E. Combining all data for the cellular subregions (over nucleus and cytoplasm) and the different cell microenvironments, we obtained stiffness values for normal, immortal, tumorigenic, and metastatic cells of 870 Pa, 870 Pa, 490 Pa, and 580 Pa, respectively. That is, cells become softer as they advance to the tumorigenic phase and then stiffen somewhat in the final step to metastatic cells. We also found a distinct contrast in the influence of a cell's microenvironment on cell stiffness. Normal mammary epithelial cells inside a monolayer are stiffer than peripheral cells, which are stiffer than isolated cells. However, the microenvironment had a slight, opposite effect on tumorigenic and little effect on immortal and metastatic cell stiffness. Thus, the stiffness of cancer cells is less sensitive to the microenvironment than normal cells. Our results show that the mechanical properties of a cell can depend on cancer progression and microenvironment (cell–cell interactions).
Export citation and abstract BibTeX RIS

Content from this work may be used under the terms of the Creative Commons Attribution 3.0 licence. Any further distribution of this work must maintain attribution to the author(s) and the title of the work, journal citation and DOI.
1. Introduction
Over the last few decades significant progress has been made in understanding the underlying genetic and epigenetic causes of cancer [1]. However, despite much improved prognoses in some cancers and slowly increasing overall survival rates, cancer remains a leading cause of morbidity and mortality [2]. Breast cancer is the most common form of cancer for women and ranks as the second leading cause of cancer death in US women [3].
Cancer is a disease that arises from malfunctioning cells [4]. Typically, cancer cells loose differentiation and reproduce uncontrollably, which leads to a disruption of normal tissue function. In metastatic cancer, cancer cells leave the primary tumor site, spread through the vasculature or lymphatic system, and repopulate distal sites. Metastasized cancers account for over 90% of deaths from solid tumors [3, 5] and, thus, understanding the progression of cancer cells from the less dangerous, non-metastatic phase to the highly dangerous, metastatic phase is a crucial current research concern.
The behavior of cancer cells is exceedingly complex and influenced by many, interrelated factors. Prime among these factors are genetic mutations, which result in erroneous protein expressions and aberrant signaling pathways. An additional emerging factor that influences cancer cell behavior is the cancer microenvironment, which includes fibroblasts and other neighboring cells, chemicals, oxygen levels, and the extracellular matrix [6]. In fact, it was recently shown that changing the microenvironment can cause cancer cells to revert back to cells that look and behave phenotypically like non-cancerous cells, despite a cancer genotype [7]. Work over the last decade or so has shown that a cell's microenvironment can have a strong influence on its morphology [7], inter-cellular signaling [8], and differentiation [9]. Thus, it appears that an intricate interplay between genetic mutations and environmental cues, rather than genetic mutations alone, affect cell behavior and fate.
A substantial research effort termed 'Physical Sciences Oncology' has been underway in the last few years with the general proposition of looking at cancer with a physicist's eyes. One emerging finding of this effort is that cancer cells may have distinct physical properties [10], in addition to the genetic and biochemical traits that distinguish cancer cells from normal, non-cancerous cells. These physical properties are a new layer of cancer cell behavior, and it is hoped that a deeper understanding of these physical traits may point the way to new treatment options for cancer. The physical properties of cancer cells are of particular interest because of their possible role in the development and spread of cancer, i.e., metastasis [10–13]. Since metastatic cancer cells have the ability to travel through the body, they likely have different physical properties, as compared to stationary regular tissue cells and localized tumor cells [14]. Current research efforts in Physical Sciences Oncology have several thrusts. Among these thrusts are (i) building a data base of the physical properties of cancer cells, and (ii) determining how those properties change as a function of the cancer cell environment. These two research areas are also the topic of our research, with a focus on determining the mechanical properties of human mammary epithelial cells (HMECs) and their cancer derivatives, and determining the effect of the cell–cell interactions (microenvironment) on their mechanical properties.
Numerous physical properties of cells, such as stiffness, viscoelastic behavior, 2D and 3D migration, traction force, and others [10] can be determined using a range of techniques [4]. Here, we'll focus on cell stiffness, as determined by atomic force microscopy (AFM) indentation. AFM indentation is a widely accepted technique to determine nanoscopic material properties, and the body of literature on cell mechanical properties determined by this technique continues to grow [15–24]. AFM indentation experiments can be done with a sharp probe—on the order of tens of nanometers, or a spherical probe—on the order of several micrometers. Both probe choices give good results. A sharp probe has the advantage that measurements can be performed with high spatial accuracy over different cellular regions, but the indentation geometry is more difficult to analyze and there is a risk of puncturing the cell membrane [17]. The larger spherical tip has the advantage of a simpler geometry for analysis, and less risk of cell puncture; but the determined cell stiffness is an average value obtained from a contact area of several μm2.
The elastic moduli of a wide variety of cancer cells have been measured using AFM indentation, including bladder cells [18], esophageal cells [17], kidney cells [22], malignant breast cancer tissue [21], breast cancer cells [20], and prostate cancer cells [24]. In addition, several other techniques have been successfully applied to detect mechanical differences between normal and cancer cells including optical deformability [11, 12], micropipette aspiration [25], and a microplate stretcher [26]. AFM methods have also been used to measure increasing rigidity of cells with age [27]. Researchers have also started to demonstrate that the mechanical signatures of cancer cells can be used as a diagnostic tool. Using AFM nanoindentation, Remmerbach et al were able to diagnose oral cancer by mechanical pheonotyping [12], and Plodinec et al were able to distinguish normal cells and metastatic cells by their stiffness signatures in breast needle biopsies from patients [21].
Ultimately, a better understanding of the physical and mechanical properties of cancer cells might provide new approaches for cancer treatment. For example, changing the mechanical properties of cells that are about to metastasize might prevent metastasis. Indeed, the anti-cancer drug SAHA causes a change in cell stiffness and a change in malignancy, which might be due to this change in stiffness [28]. In addition, increased cell stiffness has been correlated with drug resistance [29], pointing to another connection between cancer therapy and stiffness.
In our work, we used a 5.3 μm diameter, spherical, fluorescent probe attached to an AFM cantilever [30]. We selected a spherical probe, instead of a sharp tip, to avoid effects due to very small scale inhomogeneities, and to be able to make large scale elastic measurements. The 5.3 μm probe still allowed us to distinguish larger scale structures such as the cytoplasm and the nucleus. The micrometer-scale, spherical probe also ensured that we did not puncture the cells. Our measurements were calibrated against known agarose gel standards of different concentrations [30].
We chose HMECs from two cell lines: the Weinberg cell line [31] and metastatic cells from the American Type Culture Collection (ATCC). The cells represent four different phases of cancer progression: normal—meaning non-immortal, non-tumorigenic and non-metastatic—(HMEC); immortal (Imm); tumorigenic (Tum); and metastatic (Met). We chose these cells since they are closely related to each other: they are either HMECs, or they are derived from cells that once were HMECs. We determined the elastic moduli of all cells as (i) a function of the subregion of a cell (over nucleus versus over cytoplasm), and (ii) as a function of the cell's microenvironment (inside, on the periphery, or isolated outside of a contiguous cellular monolayer).
The key results of our work are:
- (1)When grouping the results by cell types, normal epithelial cells and immortal cells have about the same stiffness; they are stiffer than metastatic cells, which are slightly stiffer than tumorigenic cells. This result is in agreement with most of the stiffness measurements published by other researchers on similar cells and other cancer cell systems—typically metastatic and tumorigenic cells are softer than normal cells.
- (2)There are only minor or negligible differences in stiffness between cellular subregions (over nucleus versus over cytoplasm). To further explore this point, we used a confocal microscope to determine the thickness of the cytoplasmic region above and below the nucleus. It ranged from 2–4 μm and was, therefore, larger than the indentation depth (1500 nm). Thus, when taking measurements over the nucleus, it is likely that the elastic properties of the cytoplasm surrounding the nucleus are determined (assuming the nucleus is stiffer than the cytoplasm), rather than the elastic properties of the nucleus. This feature of cells (that the cytoplasm surrounding the nucleus is a few micrometers thick) can be beneficial if the AFM is to be used as a diagnostic tool in cell mechanics. It means that the placement of the probe on a cell (over or next to the nucleus) does not affect the cell mechanics measurement. On the other hand, it also means that it is very difficult to determine the elastic modulus of the actual nucleus with AFM indentation experiments, since the nucleus is deeply embedded in the cytoplasm.
- (3)Monolayer microenvironment strongly affects normal cells; stiffness decreases as we go from the center of a monolayer to the periphery with isolated cells being the softest. Monolayer microenvironment has little or no effect on immortal or metastatic cells, and it has the opposite effect on tumorigenic cells. This result is novel, and points to the importance of cell microenvironment when defining physical properties of cells.
- (4)Certain combinations of microenvironment and cell type result in nearly identical stiffness values; for example, isolated normal epithelial cells (healthy cells) have the same stiffness as isolated or peripheral metastatic cells. This result is novel and again points to the importance of the microenvironment of cells—different cell types might be indistinguishable in some microenvironments and distinguishable in others. This is critical when physical properties, such as stiffness, are considered as diagnostic markers.
2. Materials and methods
2.1. Cell growth and maintenance
Normal—meaning non-immortal, non-tumorigenic and non-metastatic—HMECs were purchased from Lonza (Lonza Group, Walkersville, MD). The immortal and non-tumorigenic (Imm) and tumorigenic (Tum) cells were from a modified HMEC line developed by the Weinberg group [31]. The metastatic cells (MDA-MB-231 or Met) were obtained from the ATCC (Manassas, VA, USA). A summary of the cell types and their designations is given in table 1.
Table 1. A summary of the human mammary epithelial cell types used here.
| Cell type | Label in this paper | Source label | Immortal | Tumorigenic | Metastatic |
|---|---|---|---|---|---|
| Non-cancerous | HMEC | HMEC |
No | No | No |
| Immortal | Imm | HMEC + LT, hTERT
|
Yes | No | No |
| Tumorigenic | Tum | HMLER |
Yes | Yes | No |
| Metastatic | Met | MDA-MB-231 |
Yes | Yes | Yes |
1Lonza, Williamsport, PA (USA). 2Weinberg cell line ([31]). 3ATCC.
The immortal cells (Imm) are derivatives of HMECs that were transfected with hTERT, providing replicative immortality. The immortal cells were also transfected with small and large T-antigen, which disables the pRB and p53 proteins, affecting essential signaling pathways, as well as protein phosphatase 2A. These cells are immortal, but exhibit no tumorigenicity [31]. The tumorigenic cells (Tum) express high levels of mutated H-ras, a protein that regulates cell division. The normal cells (HMEC) were used within 15 passages from their original state from Lonza. Normal cells were cultured in mammary epithelial cell growth medium (MEGM; Lonza) with 0.4% bovine pituitary extract (BPE) (Lonza), according to the distributor's recommendations. The immortal cells were cultured in MEGM (Lonza) with 0.4% BPE (Lonza) and 0.1% hygromycin (Sigma-Aldrich, cat # H3274), while the growth medium for tumorigenic cells was MEGM (Lonza) with 0.4% BPE (Lonza) and 0.1% puromycin (Sigma-Aldrich, cat #P8833-10 mg). The growth medium for the metastatic cells was the same as that for the HMECs.
Glass bottom dishes (Willcowells) of size 35 mm × 10 mm were purchased and assembled in the lab. We mixed 150 μl Poly-D-Lysine (Sigma-Aldrich P6407) solution (100 μg ml−1) with 343 μl autoclaved phosphate-buffered saline (PBS; 0.01 M Na2HPO4, 0.154 M NaCl, pH 7.4; the pH was verified weekly), and then 150 μl of the mixed solution was placed into each dish for it to absorb for 90 min. After this step, the dish was rinsed with sterile deionized water three times and dried in a sterile hood for 40 min.
Cells were cultured and maintained in a culture incubator at 37 °C with 5% CO2 and seeded onto the glass dishes with Poly-D-Lysine coating for 24 h before measurements. Images showing the morphologies of the four different types of cells are given in figure 1.

Figure 1. Brightfield micrographs of the four different cell types. (A) A small colony or monolayer of normal cells. (B) Several individual immortal cells. (C) Tumorigenic cells. (D) Metastatic cells. The arrows indicate a cell on the inside (1), and the periphery (2) of a monolayer of cells, as well as an isolated cell (3).
Download figure:
Standard image High-resolution imageThe underlying substrate on which cells are grown can affect the elastic modulus significantly [32]. For example, both metastatic and non-metastatic melanoma cells produced much higher moduli (by a factor of 3) when grown on glass surfaces coated with poly-L-lysine compared to plain glass surfaces [32]. In addition, the loading rate can also significantly affect the elastic moduli measurement results [20]. Indentation depth also affects the elastic modulus values measured using AFM cantilevers [32, 33]. Despite these limitations, relative comparisons can be made between data sets that differ in these experimental parameters (surface treatment, loading rate, and indentation depth). All our data were collected on the same surface, with the same loading rate and same indentation depth.
2.2. Height determination of cells and nucleus, confocal microscopy
The height of the cells and the height of their nuclei were determined by taking z-stacks of cells on a Zeiss LSM 710 confocal microscope (Zeiss, Thornwood, NY, USA) with a 40X lens (NA = 0.5). To distinguish the location of each nucleus within a cell, as well as the boundary of each cell, we added DAPI (Life Technologies, cat # D1306), a fluorescent dye that strongly binds to A–T rich regions of DNA within the nucleus of cells and we also added DiI (Life Technologies, cat #D282), a fluorescent tag that preferentially binds to lipids and highlights the membranes of our cells. 1 μl of 5 mg ml−1 DAPI in deionized water was added into each cell culture dish to reach a final concentration of 5 μg ml−1. The DiI was prepared in dimethylsulfoxide with a concentration of 1 mg ml−1, and 2 μl of DiI solution was put into 10 ml growth medium. The cells were then incubated at 37 °C with 5% CO2 for 15 min after DAPI was added. Then cell growth medium was changed into the growth medium with DiI and the dish was incubated for 20 min. For each type of cell, we collected a vertical stack of images (z-stack) consisting of 40–60 images, with the first image starting below the surface of the dish bottom and with the last image ending well above the top membrane of each cell. A representative image is shown in the supplementary data. The separation between adjacent images in the vertical stack was 0.39 μm. From this information we determined the cell and nucleus heights, and the thickness of the cytoplasmic layer around the nucleus (above and below the nucleus)—see figure 2.

Figure 2. Cell height and cytoplasm thickness around the nucleus versus cell category. (A) Isolated cells; (B) peripheral cells (C); cells in center of monolayer. Because of the large uncertainty in the measurements, the data were independently analyzed by two experienced microscopists and the data are plotted as rectangular boxes with a top, middle and bottom line. The top and bottom lines represent the larger and smaller values determined by each microscopist for each cell category (8–14 cells analyzed in each category). The middle line is the average of the two values. Forward slanted hatch indicates cell height, cross-hatch indicates cytoplasm thickness.
Download figure:
Standard image High-resolution imageAlthough confocal optical microscopy is currently among the best methods to determine cellular features and cell height [34], fundamental instrumentation limitations, such as fluorescence bleed-through between the images in a z-stack and diffraction-limited resolution, result in large uncertainties when determining cell and nucleus heights. To alleviate these problems, two experienced microscopists independently analyzed confocal microscopy images of 8–14 cells in each category to obtain the height information. In figure 2 we plotted the average cell height and nucleus height for each category. The data are presented as rectangular boxes; the top and bottom line of each rectangle represent the higher and the lower values determined by each microscopist; the middle line is the average of the two values. The higher and lower values determined by each microscopist are shown in table 2.
Table 2. Cell height and cytoplasm thickness around the nucleus versus cell category. The higher and lower values determined by each of two microscopists are shown (see text for details). Values are in units of μm.
| Cell monolayer microenvironment | ||||||
|---|---|---|---|---|---|---|
| Isolated | Periphery | Center | ||||
| Cell subregion | Cell subregion | Cell subregion | ||||
| Cell type | Cell | Cytoplasm | Cell | Cytoplasm | Cell | Cytoplasm |
| HMEC | 7.13–11.56 (N = 12) | 2.34–3.87 (N = 12) | 6.81–11.25 (N = 13) | 2.55–3.72 (N = 13) | 6.04–11.56 (N = 14) | 2.49–4.37 (N = 14) |
| Immortal | 8.26–16.95 (N = 11) | 3.06–3.29 (N = 11) | 7.4–14.46 (N = 14) | 3.06–3.29 (N = 14) | 6.62–14.20 (N = 10) | 2.96–3.21 (N = 10) |
| Tumorigenic | 11.30–19.50 (N = 9) | 1.62–5.55 (N = 9) | 11.30–19.5 (N = 8) | 3.72–5.07 (N = 8) | NA | NA |
| Metastatic | 14.02–19.05 (N = 12) | 4.52–5.94 (N = 12) | 14.02–19.05 (N = 13) | 4.16–4.97 (N = 13) | NA | NA |
2.3. Theoretical model
The stiffness (Young's modulus) of a cell region was acquired by indenting the cell with a spherical probe and recording the applied force. The Hertz model was used to analyze the data [30, 35]. It describes the Young's modulus, E, of a homogeneous, infinite, flat, elastic material that is stressed by a spherical indenter of radius, R, with a force, F (figures 3(A) and (B)). Although the cells do not behave exactly like an ideal, elastic material, the Hertz model is useful and widely accepted in characterizing and comparing mechanical properties of different cells. Viscous contributions to the mechanical response can be reduced by slowing down the indenting speed. Under such a condition (of slow indentation rates), the measurements are dominated by elastic behavior [36, 37]. The relationship between the force, F, applied by the sphere on the surface, and the indentation distance of the surface, δ, is then given by:


Figure 3. Experimental set-up (adopted from [30]). (A, B) Schematic of experimental set-up (not to scale). An AFM cantilever with an attached spherical probe is pressed onto a cell. As the cell is moved up by a distance, z, the cantilever bends by a distance, d, and the cell is indented by a distance, δ. (C) Top-view of an AFM probe using a fluorescence microscope showing the fluorescent melamine bead. (D) Top- and side-view SEM micrographs of a used AFM probe (a similar, but not the same actual probe as in (C)). The cantilever is 225 μm long and 43 μm wide; the (fluorescent melamine bead) probe is 5.3 μm in diameter.
Download figure:
Standard image High-resolution imageHere ν is the Poisson ratio of the surface and its value for cells is assumed to be 0.5 [38].
2.4. AFM and epifluorescence microscopy
2.4.1. Instrumentation
All indentation experiments were carried out with a combined atomic force microscope (AFM)/inverted optical microscope [39–41]. The AFM (Topometrix Explorer, Veeco Instruments, Woodbury, NY, USA) was situated above the sample and fit on a custom-designed stage of the inverted optical microscope (Axiovert 200, Zeiss, Thornwood, NY, USA). The optical microscope was equipped with a high sensitivity CCD camera (EM-CCD C9100-02, Hamamatsu Photonics KK, Japan) and IP Lab software (Scanalytics, Fairfax, VA). The stage was designed so that the sample can be moved in the x- and y-directions independently from the AFM when the AFM is sitting on the stage.
2.4.2. AFM probes
We attached a 5.3 μm diameter fluorescent melamine bead (Microspheres-Nanospheres, Cold Spring, NY) to each tip-less AFM silicon probe (Applied Nano Structures, USA), as described previously [30]. The AFM probes had a reflective aluminum coating, length, L = 225 μm, width, w = 43 μm, and a nominal spring constant, k = 0.1–0.6 N m−1. A more accurate spring constant was calculated from the frequency and dimensions of the cantilever using the Sader method [42, 43]. Fluorescence and scanning electron microscopy (SEM) images of the AFM probes clearly show a single melamine sphere attached to the end of the cantilever (figures 3(C) and (D)). The SEM image shows a used probe—a small amount of 'dirt' can be seen, but otherwise the probe is not compromised.
To estimate the accuracy of our AFM methods, some AFM probes were calibrated against agarose gels (SeaKem, cat #50152, Lonza Group, Walkersville, MD) of known modulus (figure 4). The determined agarose stiffness values agreed, to within 20%, with commonly accepted literature values [44–46]. More details of the bead attachment protocol and the calibration procedure can be found in a previous paper [30].
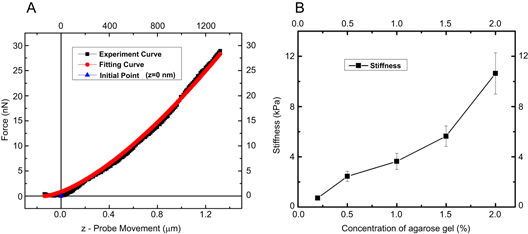
Figure 4. Calibration of force curves with agarose gel. (A) Representative indentation curve on 2% agarose gel and fit to equation (4). (B) Young's modulus of agarose gels at different concentrations as determined by AFM indentation. The values agree with values reported in the literature, as determined by microscopic methods (AFM indentation) and macroscopic methods (indenter).
Download figure:
Standard image High-resolution image2.4.3. AFM measurements
Cell samples were measured within 2 h after being removed from the incubator. The AFM measurements were done at room temperature. For each sample, 30–40 indentation measurements were collected over a period of 2 h. All measurements were carried out in sterile growth medium (see, section 2.1). Different cell culture conditions, such as different culture media, in which the growth factors may change, can affect cell mechanical behavior. For example, Nikkhah et al found that increasing the amount of serum in growth medium would cause softening of non-malignant MCF10A and malignant MDA-MB-231 breast cells [47]. The Young's moduli of stained cells were also reported to be higher than those without stain [17]. We have, therefore, performed all our measurements under the same buffer and staining conditions, i.e., no staining.
An individual measurement took 17–22 s to complete; i.e. a typical cycle occurred at approximately 0.05 Hz. For each measurement, loading curves were obtained at a speed of 0.1 μm s−1. We chose this speed for several reasons. It is fast compared to cell migration, so cells can be considered stationary objects during a measurement. It is slow enough for the viscous drag on the cantilever to be negligible, as estimated from Fdrag = bvtip = 2 pN, with b = 20 pN s μm−1 [48], whereas the typical force exerted on the cantilever by a cell is in the 1–100 nN range over the indentations used here. Moreover, we found this speed to give reproducible, low-noise force curves that fit well to the Hertz model.
The indentation depth for all cells was approximately 1500 nm. We say 'approximately', because for cell indentations, the exact contact point is notoriously difficult to pinpoint, for at least two reasons. First, the initial slope of the curve is shallow, and it is thus difficult to precisely locate the exact contact point. Second, epithelial cells are surrounded by soft brushes consisting of the glycocalyx and membrane protrusions such as microvilli, cilia, filopodia and microridges [49, 50]. These soft brushes can be on the order of several hundred nanometers and they obscure the exact contact point of the AFM probe with the cell membrane in force curves. Nevertheless, we indicated the estimated contact point in the force curve in figure 5. The contact point is easier to identify in the force curve on an agarose gel, which is stiffer and does not have brushes (figure 4). It is important to note that knowing the exact contact point is actually not required to obtain good fits.
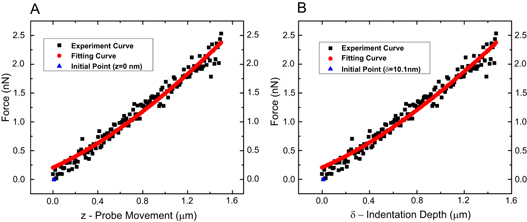
Figure 5. An example of cell indentation data and a fitting curve from immortal cells. The black squares are the AFM data. The red line is a Hertz model fitting curve (A) Force, F, versus piezo movement, z, where z = d + δ, with d being the cantilever deflection and δ being the actual cell indentation. The quantities z and d can be measured directly; F is calculated from Hooke's law via d as explained in the text. (B) Force, F, versus cell indentation, δ. The blue triangle indicates the estimated contact point between the AFM probe and the cell membrane.
Download figure:
Standard image High-resolution imageWe chose an indentation depth of 1500 nm for the following reasons. As described above, for cell indentations, it is difficult to identify the exact contact point of the probe with the cell. Thus, for smaller indentations, on the order of a few hundred nanometers, this uncertainty can result in large uncertainties in the modulus determination. Using somewhat larger indentations, on the order of 1500 nm, this uncertainty has less of an effect and the obtained curves can be fit well with the Hertz model. On the other hand, we avoided significantly deeper indentations, on the order of a few thousand nanometers, because for such deep indentations the probe likely senses the modulus of the substrate, particularly for the case of the cytoplasm. The cell also might get damaged for very deep (several thousand nanometers) indentations.
We only performed one or a few spatially separated measurement per cell, since cells may respond to being poked by stiffening or softening [32]. We used the loading part of the curve for our data analysis (figure 5).
The quantities measured by the AFM are the cantilever deflection, d, and the movement of the piezo, z. The applied force, F, can be directly calculated from the cantilever deflection via Hooke's law, F = k d. The indentation, δ, cannot be directly measured. From figure 3, it can be seen that z = d + δ. Plugging this relationship into equation (1), we get

and using Hooke's law we obtain
All curves were fit with a slightly modified version of equation (3) to accommodate the uncertainty in the exact height (z-value) when the spherical probe first made contact with each cell. As a result we added an additional fitting parameter z0 (in addition to the modulus E) that corresponds to the vertical height where the tip first contacts the cell. So the expression for the fitting function is given by
The AFM data (F and z) were imported into Matlab (Matlab 2012, The MathWorks, MA 01760, USA). A typical data curve fitted with equation (4) is shown in figure 5. The data was exported from Matlab and put into Origin (Origin 8.0, OriginLab, MA 01060, USA) to plot the data.
3. Results and discussion
The Hertz model fit well to the loading curves of all the cell types to give the Young's modulus, E, for each cell indentation. The moduli, E, of the various cell types (HMEC, Imm, Tum, and Met), cell subregions (over nuclear and over cytoplasmic regions), and monolayer microenvironments (isolated, periphery of monolayer, and inside of a monolayer) are given in table 3 and plotted in figure 6. We took between 21 and 39 individual measurements for each cell type and parameter (see table 3 for specific numbers). Our measurements were calibrated using agarose gels of known concentration. Our results show that the tumorigenic cells (Tum) are softer than normal cells (HMEC) in each category. Immortal cells (Imm) exhibit the same stiffness as normal cells. We were not able to collect data for tumorigenic or metastatic cells growing inside a monolayer, since neither of these cell types could form a monolayer like the normal and immortal cells. Instead, the tumorigenic and metastatic cells tended to form clumps as the confluence increased.
Table 3. Young's modulus measurements (± standard error of the mean) for all the different cell types, monolayer microenvironments, and cellular subregions (units of Pa). The number of independent cells, N, contributing to each value is given in the second line of each table cell.
| Cell monolayer microenvironment | ||||||
|---|---|---|---|---|---|---|
| Isolated | Periphery | Center | ||||
| Cell subregion | Cell subregion | Cell subregion | ||||
| Cell type | Cytoplasm | Nucleus | Cytoplasm | Nucleus | Cytoplasm | Nucleus |
| HMEC | 600 ± 50 (N = 21) | 680 ± 40 (N = 24) | 800 ± 80 (N = 21) | 950 ± 90 (N = 25) | 1130 ± 60 (N = 29) | 1020 ± 80 (N = 22) |
| Immortal | 840 ± 60 (N = 33) | 910 ± 70 (N = 31) | 810 ± 70 (N = 27) | 960 ± 90 (N = 33) | 720 ± 30 (N = 26) | 940 ± 100 (N = 27) |
| Tumorigenic | 590 ± 40 (N = 23) | 580 ± 30 (N = 26) | 380 ± 30 (N = 24) | 410 ± 30 (N = 28) | NA | NA |
| Metastatic | 550 ± 30 (N = 34) | 580 ± 40 (N = 32) | 550 ± 30 (N = 39) | 660 ± 30 (N = 38) | NA | NA |
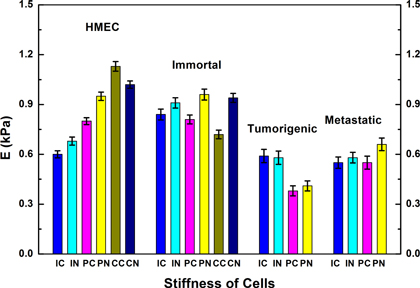
Figure 6. Stiffness comparison of normal (HMEC), immortal, tumorigenic, and metastatic cells. Normal and immortal cells are generally stiffer than both tumorigenic and metastatic cells. The tumorigenic cells are the softest among the four types of cells. The difference between measurements over the nucleus and the cytoplasm are typically small. Normal cells show a strong dependence on the monolayer microenvironment. The distributions of moduli for each category are shown in the supplementary data.Abbreviations on x-axis: first letter: I-isolated; P-periphery of monolayer; C-inside (center) of monolayer; second letter: C-cytoplasm; N-nucleus.
Download figure:
Standard image High-resolution image3.1. Stiffness versus cell type
From figure 6, it is clear that there are differences in stiffness among the cell types. To further evaluate these differences we combined all the data for each different cell type (regardless of monolayer microenvironment or cellular subregion) into a single averaged value for each cell type (figure 7), as might be done in a quick diagnostic test. When we performed a t-test analysis of these data (table 4), the normal and immortal cells did not have stiffness values that differed significantly. However, all other pairs in the table exhibited significant statistical differences (p < 0.05). So, we can safely conclude that the tumorigenic cells are significantly softer than the normal and immortal cells, while the metastatic cells are significantly stiffer than the tumorigenic cells and significantly softer than the normal and immortal cells.

Figure 7. Stiffness comparison of normal (HMEC), immortal, tumorigenic, and metastatic cells. Here, all categories (monolayer microenvironments and cellular subregions) are combined into one average value for each cell type. Normal and immortal cells are generally stiffer than both tumorigenic and metastatic cells. The tumorigenic cells are the softest of the four cell types. Error bars correspond to standard errors of the mean (sem).
Download figure:
Standard image High-resolution image
Figure 8. Stiffness of cells as a function of different monolayer microenvironments. (A) Iso—isolated cells outside of monolayer, Periph—cells on the periphery of monolayer; Cen–cells in the center (on the inside) of a monolayer. (B) HMEC cells become stiffer as the microenvironment changes from isolated to the center of a monolayer of cells. The stiffness of immortal and metastatic cells is not affected by microenvironment; tumorigenic cells become slightly softer.
Download figure:
Standard image High-resolution image
Table 4. T-test results for a comparison of stiffnesses of different cell types.
| Comparison pair | p-value |
| HMEC versus immortal | 0.4545 |
| HMEC versus tumorigenic | <0.0001 |
| HMEC versus metastatic | <0.0001 |
| Immortal versus tumorigenic | <0.0001 |
| Immortal versus metastatic | <0.0001 |
| Tumorigenic versus metastatic | 0.0015 |
These overall results, averaged over microenvironment and cellular regions, are largely in agreement with findings reported in the literature, as it has generally been observed that malignant cells are softer than normal epithelial cells across a range of different cancers. Tumorigenic cells are sometimes softer than normal cells, sometimes not. For example, malignant cancer cells derived from the bladder and ureter (BC372629, T24, Hu456) are softer than non-malignant cancer cells (HCV29) or normal bladder cells (Hu609) [32]. In prostate, malignant cancer cells (LNCaP, PC-3, Du 145) were softer than regular, epithelial, human papillomavirus 18-transformed cells (PZHPV-7) [32]. In breast, metastatic cells (MCF-7) are softer than regular epithelial mammary gland cells (MCF-10, and 184A1) [20, 51]. When examining breast tissue biopsies, Plodinec et al found that the softer subpopulation of cells likely correspond to malignant cells [21].
Similar, though less clear results were obtained for melanoma, where some malignant melanoma cells (1205Lu, WM266-4, A375) were softer than non-malignant melanoma cells (WM793, WM115). However, malignant melanoma cells WM35 were as stiff as the non-malignant melanoma cells [32]; thus, the rule that malignant cells are always softer may not be universally applicable. In esophagus, epithelial cells immortalized with hTERT (metaplastic cells, CP-A), and pre-malignant, epithelial-like cancer cells (dysplastic cells, CP-D, Barrett's esophagus), were softer than a normal squamous cell line [17]. These cells are similar to our immortal cells (also immortalized with hTERT), tumorigenic cells (also pre-malignant) and normal cells. These esophagus results agree with our (breast cancer) results in that the tumorigenic (pre-malignant) cells are softer than normal cells. They disagree in that the CP-A immortalized cells are softer than normal cells (same modulus for us). In kidney, it was found that metastatic (malignant) adenocarcinoma cells (ACHN), were softer than tumorigenic carcinoma cells (A-498), which were softer than normal kidney epithelial cells (RC-124) [22]. These kidney results agree with our (breast) results in that the tumorigenic (pre-malignant) and metastatic cells are softer than normal cells. They disagree in that the metastatic cells are softer than tumorigenic cells (similar or slightly stiffer for us).
One simple reason for some of the differences between our results and those obtained on other systems, of course, could be that we are comparing different cancer and cell systems. Only comparing normal, immortal, tumorigenic and metastatic across different cancer types might be an oversimplification. Additional parameters, such as the different microenvironments, may also need to be considered. We used the Weinberg cell line, which has not been investigated before. It could be that the tumorigenic cells from the Weinberg cell line might be slightly softer than metastatic cells, while tumorigenic cells in other systems are stiffer than metastatic cells.
Some other studies seem to indicate that there is no clear correlation between cell stiffness and metastasis. Using magnetic twisting cytometry (not AFM indentation), Coughlin et al investigated the cytoskeletal stiffness, friction and fluidity of a number of cell lines with different metastatic potential from different cancers (breast, skin, kidney, prostate, and bladder) [54]. These authors found that acquisition of tumorigenicity or enhanced metastatic ability did not induce large or systematic changes in cytoskeletal stiffness. The data do suggest that cells with enhanced cancer cell motility and invasion have a more fluid-like state. However, strongly metastatic skin cells (A375SM) and kidney cancer cells (SN12PM6) that disseminate by lodging in the microcirculation of peripheral organs are more solid-like (rather than fluid-like) [54]. In a related study, the strongly metastatic kidney cancer cells exhibited both increased cytoskeletal dynamics and stiffness, which are thought to facilitate the process of vascular invasion [55].
In summary, when tested by AFM indentation, it appears that most, if not all, metastatic cells across all cancers are typically softer than normal cells. Tumorigenic cells are usually, but not always, softer than normal cells. When tested by other techniques, such as magnetic twisting cytometry, no set of biophysical parameters changed systematically with metastatic ability across all cell lines.
These observations imply that softness may favor, or even be necessary for metastasis in some cancers; however, it is not a feature that is necessarily found in all metastatic cancer cells.
Other than direct spread into surrounding tissue, cancer metastasizes mainly via three mechanisms [52, 53]. (1) Hematogenous spread, in which cancer cells intravasate into blood vessels, mostly though venous capillaries, then spread through the vasculature, extravasate and repopulate distal sites in the body. Hematogenous spread is typical of sarcomas and some carcinomas. (2) Lymphatic spread, in which cancer cells first invade the lymphatic system and subsequently other parts of the body. Since the lymphatic system drains into blood, this route can also lead to venous circulation. Lymphatic spread is the most common route for carcinomas, including most breast cancers. (3) Transcoelomic spread, in which cancer cells spread across a body cavity, such as the peritoneal cavity.
Given the complexity and heterogeneity of cancer and the different paths of metastasis, it is unlikely that there is one typical biophysical or mechanical phenotype for a prototypical metastatic cancer cell. Different cancer types with different metastatic paths likely have different mechanical phenotypes. Nevertheless, by examining and cataloging the mechanical phenotypes of different cancer cells, it might be possible to build up a mechanical phenotype library that could be used for diagnosis across different cancer types, as it was used for breast cancer [21].
3.2. Stiffness versus cellular subregion
The nucleus is the largest cellular organelle, and can be easily discerned in our microscopic images, as the typical diameter of a nucleus is several micrometers. To analyze if there is a difference between the moduli of the cytoplasmic region and nuclear region, we ran a t-test analysis on the two pairs of stiffness values (Ecyto and Enucl) for each cell type and microenvironment. This analysis showed that there is no statistically meaningful difference (p < 0.05) between the cytoplasmic and nuclear stiffness values for any cell type/subregion except for the immortal cells found at the inside of a monolayer, where the nucleus was slightly stiffer than the cytoplasm. Thus, for simplicity we will combine the stiffness values of cytoplasmic and nuclear regions in subsequent analyses, which will introduce no significant error, except for immortal cells in the monolayer center, where we get a small error. Using confocal microscopy, we determined the height of the nucleus and the height of entire cell for all the different cell types in their various microenvironments (figure 2). From these data, we could also approximately determine the thickness of the cytoplasm between the nucleus and the cell membrane. The cytoplasmic region surrounding the nucleus (above and below the nucleus) is larger than the indentation depth for all measurements. Therefore, it is likely that in our measurements over the nuclear region, we determined the modulus of the cytoplasm surrounding the nucleus, and not the nucleus. This is the likely reason why the measurements over the nuclear region and the cytoplasmic region give similar modulus values (another reason could be that the nucleus and cytoplasm have similar moduli).
The finding that the modulus over the nucleus and next to the nucleus is the same is beneficial to researchers who want to use AFM as a diagnostic tool to determine the stiffness of cells. It simplifies such measurements, since it does not matter if the measurement is taken over the nucleus or next to the nucleus.
Other researchers have found a difference in stiffness values for the nuclear and cytoplasmic regions, sometimes with the cytoplasmic regions being softer, other times being stiffer. Guilak et al and Pajerowski et al [56, 57] used a micropipette aspiration method to determine the potential for deformation. Both groups found that the cytoplasm tends to be softer than nuclear regions based on a viscoelastic fluid model. The likely reason why these findings differ from ours is because different techniques were used. In our AFM nanoindentation experiments we likely did not reach the nucleus, whereas micropipette aspiration probes the nucleus. Lee et al [58] used AFM nanoindentation with a sharp tip on three HMEC types: non-transformed cells (MCF10A), similar to our HMEC cells; transformed, non-metastatic human breast carcinoma cells (MCF7), similar to our tumorigenic (Tum) cells; and metastatic cells (MDA-MB-231), identical to our metastatic (Met) cells. Their cells were in mixed confluent monolayers. For the MCF10A cells the nuclear region was slightly stiffer (∼1.3x) than the cytoplasmic region, while for the MCF7 and MDA-MB-231 the nuclear region was slightly softer (0.6x and 0.8x, respectively) than the cytoplasmic region. The absolute values were in a similar range as our measurements (for details, see table 6) with the MCF10A cells being stiffest, the MCF7 being softer by a factor of 2 (nuclear region) and the MDA-MB-231 cells being softest (factor of 4 over MCF10, nuclear region). We believe the discrepancy between their results (difference between nuclear and cytoplasm region) and our results (no/little difference between nuclear and cytoplasmic region) could be attributed to the different probes that were used in the indentation experiments. We used a spherical probe (5.3 μm diameter), which provides average stiffness values from a micrometer sized area, whereas the sharp probe (order of nanometer) used by Lee et al provides values from nanometer sized areas, and also may have penetrated deeper. Both approaches are valuable and useful. If one is interested in an overview value for a given cell type, a larger, spherical probe is a better choice. However, if one is interested in a detailed mapping of narrow cellular subregions a nanometer-sized probe is better. The overall trend that metastatic and tumorigenic cells are softer than normal HME cells is the same in Lee et al and our experiments.
Our height measurements (figure 2) indicate that if one is interested in determining the mechanical properties of the nucleus by AFM, deep indentations, on the order of a few thousand nanometers, should be performed, because the nucleus is embedded in a thick layer of cytoplasm. Such deep indentations, however, may harm the cell.
3.3. Stiffness versus monolayer microenvironment
To analyze the effect of monolayer microenvironment, we combined the nuclear and cytoplasmic stiffness values and compared the effect of cell type and microenvironment status (isolated versus periphery versus monolayer center—see figure 8). We ran a t-test analysis on the different pairwise combinations as summarized in table 5. Since the tumorigenic and metastatic cells did not form confluent colonies, but rather clumps of cells, we could not compare that monolayer microenvironment to others for those two cell types.
Table 5. Summary of t-test results on cell stiffness as a function of microenvironment status.
| Cell monolayer microenvironment | |||
|---|---|---|---|
| Cell type | Isolated/Periphery | Isolated/Center | Periphery/Center |
| HMEC | 0.0009 | <0.0001 | 0.005 |
| Immortal | 0.3766 | 0.2917 | 0.2196 |
| Tumorigenic | <0.0001 | NA | NA |
| Metastatic | 0.3934 | NA | NA |
A remarkable aspect of this analysis is that the stiffness of normal cells is strongly affected by the monolayer microenvironment, whereas monolayer microenvironment has little or no statistically significant effect on metastatic and immortal cells and a slightly opposite effect on tumorigenic cells. In other words, the various cell types respond in distinctly different ways to their cellular microenvironment. This has some important implications. First, when taking cell stiffness measurements, it is important to pay attention to the microenvironment in which the measurements were taken. Leaving out this variable may result in data misinterpretations. For example, isolated normal HME cells have the same stiffness as isolated metastatic cells; while normal HME cells inside a monolayer are stiffer. Second, while it is well-known that cells sense their environment and that they respond to environmental cues, we discovered that cell stiffness is yet another parameter that is affected by the cellular environment. One interpretation could be that in their natural environment, HME cells form a tightly packed cellular monolayer, and due to this tight packing they are stiffer. This may be their normal, default stiffness, which will allow them to perform their natural function, which is the creation of a protective and interacting lining in ducts. Once taken out of that environment they lose the stiffness associated with the tight packing. Tumorigenic and metastatic cells don't pack so tightly and don't interact closely with each other, and thus do not have this tight-packing associated stiffness. In this context, it is interesting to note that genotypic tumor cells can phenotypically behave like normal cells, when they were surrounded and packed in by normal cells [7]. These observations are in line with the notion that a cell's microenvironment can have a strong influence on its morphology [7], inter-cellular signaling [8], and differentiation [9]. Thus, environment and genetics influence a cell's behavior and fate.
3.4. Comparison with literature
It is difficult to make direct quantitative comparisons between measurements done on cells or tissue at different loading rates since the modulus results depend on the rate [32]. Nonetheless, comparisons that are made with loading rates that are within roughly an order of magnitude have merit. In addition, the differences in tip size and shape could give rise to differences that would disappear if the cells were measured with identical tips. The first row in table 6A provides results from our work that lists a normal cell (HMEC, averaged over all microenvironments and subregions) and the two most compromised versions of cancer cells (tumorigenic and metastatic). The second row in table 6A shows a previous measurement by a different group [20] that used an experimental setup close to ours (similar cell line, same loading rate, over the cell center (probably nucleus), and very close to the same AFM tip). Our normal HMEC cells were stiffer by about a factor of 1.7, and the absolute magnitude of the measurements were quite similar, in the range of 0.5–0.8 kPa. The cancer cells measured by Li, et al were in agreement with our tumorigenic cells. The mammary gland tissue measurements by Levental et al using an electromechanical indenter [59]—see the third row in table 6—showed a systematic increase in the stiffness of mammary tissue as it went from normal to pre-malignant to tumor. This would appear to disagree with single cell measurements presented here and by others [20]. However, recent mammary tissue measurements [21]—see the fourth row in table 6—performed with an AFM that has better spatial resolution than the indenter, showed that mammary cancer tissue had a stiffness distribution with three maxima. The distribution showed three maxima—at stiffness values that are (1) about the same as normal tissue; (2) stiffer than normal tissue; and (3) significantly softer than normal tissue. It has been hypothesized that malignant cancers contain cells that could metastasize by moving nimbly around the circulatory or lymphatic system, arguing for the circulating tumor cells to be softer than other cells. The observation of tumor tissue being stiffer than normal tissue, yet allowing for a population of softer CTCs, is consistent with a model in which the ECM surrounding the cancer cells gives rise to the perceived stiffening. Meanwhile a certain subset of cells is much softer, allowing them to more easily leave the tumor and enter the circulatory system. This model is supported by the recent work on breast biopsies by Plodinec et al [21]. In fact, the body has normal cells whose natural job is to move around the body, viz. leukocytes, so we could expect leukocytes to also exhibit a softening relative to red blood cells. Data on the stiffness of leukocytes using micropipette aspiration [60] suggests that these cells have moduli (130 Pa—for slow aspiration rates) that are somewhat lower than those measured here for the worst cancer cells. At fast aspiration rates, the leukocytes demonstrate significantly higher shear modulus (500 Pa), indicating that leukocytic motion through tissue in the body occurs most effectively at low velocities.
Table 6(A). Stiffness (Elastic Modulus) for Human Mammary Epithelial Cells using AFM (or an indenter).
| Enormal (kPa) | Ecancer (kPa) | Method | Comments | References |
|---|---|---|---|---|
| 0.87 ± 0.39 | 0.41 ± 0.19 (tumorigenic) 0.57 ± 0.19 (metastatic) | AFM—spherical probe (5.3 μm dia.) | loading rate = 0.1 Hz—average over three microenvironments and two subregions | This work |
| 0.51 ± 0.22 | 0.38 ± 0.15 | AFM—spherical probe (4.5 μm dia.) | Single cells MCF-7; loading rate = 0.1 Hz | Li et al [20] |
| 2.0 (nucl.) 1.8 (cyto.) | 0.9 (nucl.) 1.3 (cyto.) (tumorigenic) 0.5 (nucl.) 0.7 (cyto.) (metastatic) | AFM—sharp probe | MCF10A (HMEC) MCF7 (tumorigenic) MDA-MA-231 (metastatic) | Lee et al [58] |
| 0.17 ± 0.01 | 0.58 ± 0.13 premalig 1.8 ± 0.4 tumor | Electromechanical indenter | mammary gland tissue; load rate not reported | Levental et al [59] |
| 1.13 ± 0.78 | 0.57 ± 0.16 1.99 ± 0.75 5.75 ± 1.62 | AFM—sharp probe | Peak values for breast cancer tumor tissue | Plodinec et al [21] |
| 1.93 ± 0.50 | 0.50 ± 0.08 | AFM—sharp probe | Pleural fluid cells; breast ductal Adenocarcinoma; load rate = 1 Hz | Cross et al [16] |
| 2.26 ± 0.56 184 A; | 1.20 ± 0.28 -T47D; 1.24 ± 0.46—MCF7; | AFM—sharp probe | Mammary cells; loading rate = 1 Hz | Lekka et al [51] |
It is also noteworthy that the stiffness values of our normal HME cells agree with the normal tissue measurements of Plodinec et al and the stiffness values of our metastatic cells agree with the stiffness of the softest cells/tissue they measure. The fact that their measurements are nearly in vivo (breast biopsies) while ours are in vitro may indicate that the in vitro cell conditions in our experiments do not introduce gross differences in cell stiffness compared to cells/tissue in vivo.
Some important reports about stiffnesses of non-mammary cells are listed in table 6(B).
Table 6(B). Stiffness (Elastic Modulus) for non-mammary human cells using AFM.
| Enormal (kPa) | Ecancer (kPa) | Method | Comments | References |
|---|---|---|---|---|
| 7.7 ± 3.6 | 3.1 ± 2.8 (metaplastic) 2.6 ± 2.7 (dysplastic) | AFM—sharp probe | Esophageal; loading rate = 1 μm s−1 | Fuhrmann et al [17] |
| 9.4 + 21/−7 (RC-124: non-tumorigenic) | 7.4 + 21.5/−4.5 (A498:carcinoma) 2.5 + 4.5/−1.8 (ACHN: adenocarcinoma) | AFM—sharp probe | Kidney; vertical scan rate of f = 1 Hz | Rebelo et al [22] |
| 80–110 | AFM—sharp probe | Single cell—keratinocytes HaCaT cells | Zhou et al [61] | |
| 14-nuclear 37-cytoplasm | AFM—spherical probe (5 μm dia.) | Single cells—epithelial (foreskin) | Berdyyeva et al [27] | |
| 2.10 ± 0.79 lung 2.05 ± 0.87 lung 0.54 ± 0.12 pancreas | 0.56 ± 0.09 lung 0.52 ± 0.12 lung 0.54 ± 0.08 pancreas | AFM—sharp probe | Pleural fluid cells; load rate = 1 Hz | Cross et al [16] |
| 2.8 ± 0.5 benign | 0.287 ± 0.052 malig. 1.40 ± 0.16 malig | AFM—sharp probe | Prostate cancer cells; load rate = 0.28 Hz | Faria et al [24] |
| 3.09 ± 0.84 PZHPV-7 | 0.45 ± 0.21 LNCaP; 1.36 ± 0.42 Du145; 1.95 ± 0.47 PC-3 | AFM—sharp probe | Prostate cancer cells; load rate = 1 Hz | Lekka et al [51] |
| 4.85 ± 2.03 (200 nm indent); 1.66 ± 0.86 (1400 nm indent)—human skin fibroblasts CCL110 | 3.07 ± 0.56 -WM35 (melanoma); 0.76 ± 0.37–A375 (metastatic melanoma); both at 1400 nm indent | AFM—sharp probe | Melanoma cells; load rate not reported | Pagoda et al [62] |
| 9.7 ± 3.6—Hu609; 7.5 ± 3.6—HCV29; | 0.3 ± 0.2—Hu456; 0.8 ± 0.4 T24; 1.0 ± 0.6 BC3726 | AFM—sharp probe | Bladder cells; load rate ∼0.12 Hz | Lekka M. et al [18] |
Cell results in this table were obtained using AFM techniques. Most groups used sharp tips, except for one group who used spherical probes on normal foreskin epithelial cells [27], and another who used spherical probes on breast cancer cells (in table 6(A)). Berdyyeva et al [27] reported a difference in stiffness between the cytoplasmic and nuclear subregions, with the cytoplasmic subregions exhibiting greater stiffness values than the nuclear subregions. For the entries in the non-mammary results table, all groups found that the cancer cells were softer than comparison non-cancerous cells.
4. Conclusion
It has long been known that genetic mutations can alter proteins and filaments that support the morphology of cells. For instance, the change caused by genetic mutations in keratin proteins, which are the main component of intermediate filaments, results in a softer cellular cytoplasm [58, 63, 64]. Swaminathan et al reported that the concentration of actin in normal cells was higher than that in cancer cells, which led to the conclusion that the normal cells are stiffer [65]. Application of more sophisticated models to quantify scale-free cell mechanics will provide further insight into the relationship between neoplastic processes and stiffness changes in cells and cell structures. This is particularly relevant for metastasis, as metastatic cells have to penetrate the basal membranes, travel through the vasculature or lymphatic system, and then penetrate the membrane again to form another tumor elsewhere.
The behavior of cells under strain is a complex combination of cell crowding, protein signaling, filament (polymer) changes under stress, the breaking and reforming of weak polymer bonds, and straining of stretched cellular fibers. Our work shows that cell type (specific mutations) and microenvironment (cell location outside, on periphery, or inside of a monolayer) play important roles in determining cell stiffness. Significantly more work needs to be done to fully understand and describe the importance of the various mechanisms that contribute to cell mechanical response to strain. It is hoped that the reward of this work may be an entirely new approach to cancer treatment.
Acknowledgements
The authors acknowledge funding from the Armed Forces Institute of Regenerative Medicine (AFIRM) and grant support from the Wake Forest Center for Molecular Communication and Signaling (U01057). This material is based upon work supported by the National Science Foundation under Grant Number 1106105 (KB and MG). We thank Justin Sigley and Stephen Baker for help with the AFM measurements. We also thank Glen Marrs, director of the WFU Microscopic Imaging Core Facility, for assistance in obtaining the SEM images of the AFM probes and the confocal images used to measure cell heights. We thank the following individuals for assistance with pilot studies and helpful discussions: Jillian Rouse, Maria Bahawdory, Pete Masso, ChangMo Hwang, Rajesh Pareta, Weijie Xu, David Sullivan, Mark Furth, and Seth Tomblyn.