


Abstract
Here we present experimental results on laser-driven ion acceleration from relativistically transparent, overdense plasmas in the break-out afterburner (BOA) regime. Experiments were preformed at the Trident ultra-high contrast laser facility at Los Alamos National Laboratory, and at the Texas Petawatt laser facility, located in the University of Texas at Austin. It is shown that when the target becomes relativistically transparent to the laser, an epoch of dramatic acceleration of ions occurs that lasts until the electron density in the expanding target reduces to the critical density in the non-relativistic limit. For given laser parameters, the optimal target thickness yielding the highest maximum ion energy is one in which this time window for ion acceleration overlaps with the intensity peak of the laser pulse. A simple analytic model of relativistically induced transparency is presented for plasma expansion at the time-evolving sound speed, from which these times may be estimated. The maximum ion energy attainable is controlled by the finite acceleration volume and time over which the BOA acts.
Export citation and abstract BibTeX RIS

Content from this work may be used under the terms of the Creative Commons Attribution 3.0 licence. Any further distribution of this work must maintain attribution to the author(s) and the title of the work, journal citation and DOI.
1. Introduction
An ultrahigh-intensity laser interacting with matter accelerates electrons to nearly the speed of light. These, in turn, can be used to accelerate protons and heavier ions. Since electromagnetic fields in laser plasmas can be more than a million times stronger than in conventional accelerators, lasers have the potential to shrink accelerators from kilometer- to room size, becoming suitable for universities, industry and hospitals. How-ever, the maximum ion energy observed seems to have saturated and remains too low for many applications. We present a detailed experimental demonstration of a new laser acceleration regime, called break-out afterburner (BOA) acceleration, with much higher performance than other acceleration mechanisms. With the ultrahigh pulse contrast at ultrahigh power at the Los Alamos National Laboratory (LANL) Trident laser and nm-thick diamond targets, the energy of the laser-accelerated carbon ions increases by an order of magnitude, exceeding the required energy for ion fast ignition in inertial fusion energy production and enabling for the first time biological experiments with laser-driven carbon ions relevant to hadron tumor therapy. Laser-ion accelerators have made rapid progress over the last decade. Since the demonstration of directed multi-MeV proton beams accelerated by ultrahigh intensity lasers [1, 2], these beams have been studied intensely, motivated by the potential of shrinking kilometers of conventional accelerator hardware to a room-sized device that can be used for applications in nuclear physics, energy, material science and medicine. Characterization and control of many beam parameters (e.g. divergence [3, 4], emittance [5, 6], species [7]) has been demonstrated, as has a technique for laser-based, mono-energetic ion acceleration [8–10]. While much new knowledge has been gained, peak particle energy has stagnated. The maximum published proton energy of 60 MeV was reached in the first experiments at the Nova PW laser in 1999 utilizing the 'target normal sheath acceleration' (TNSA) process [11]. While this is sufficient for proton fast-ignition, it is not enough for proton therapy (250 MeV protons are required). For heavier ions like carbon and oxygen the maximum published ion energies are in the range of 3–5 MeV amu−1 [12]. The required energies for ion-based (Z > 1) fast ignition (IFI) is ∼40 MeV amu−1 [13–15], and for ion-based tumor therapy [16] energies of 400 MeV amu−1 are required. A more effective acceleration process is needed. Radiation pressure acceleration (RPA) [17–20] is one proposed mechanism, and while we were able to show a first onset of RPA experimentally [21], the most promising 'light sail' regime [22] of RPA requires very high laser intensities (> 1022 W cm−2) and short pulses (< 100 fs) to prevent large scale target deformation during the acceleration phase. The BOA [23–26] is another candidate process with the advantage that lower intensities (∼1020 W cm−2) and longer pulses (∼500 fs) may be used, which for current laser systems contain one–two orders of magnitude more energy. While the underlying physics in these regimes differ, they share features distinguishing them from TNSA: in TNSA, ion acceleration is decoupled from the laser by the thick (> μm) target [10]. In contrast, in the RPA and BOA, the laser interacts directly with electrons co-propagating with the beam ions. The accelerating fields are larger than in TNSA and persist for longer, thus providing a larger field gradient and a longer effective acceleration distance. Also, in RPA and BOA the high-z species see the same or even higher accelerating fields than the accompanying protons, whereas in TNSA the protons shield the fields from the heavier species. Furthermore, as explained below and in [27], the different dynamics of BOA leads to a fundamentally different angular distribution of the ions compared with TNSA. The main technical challenge is to field a target that remains overdense to the laser when the peak of the pulse arrives, yet is thin enough for the dynamics of the mechanism to proceed. This requires ultrahigh contrast laser pulses and stable, free-standing, nanometer targets with high aspect ratio (∼105) and ∼nanometer thickness. We report on the first experimental realization and comprehensive understanding of the BOA, which proceeds as follows [23, 25]: an ultrahigh intensity pulse interacts with an ultrathin (∼ few skindepth) solid density (ne ∼1023 cm−3) target. The laser heats the electrons to high γ and drives a hydrodynamic expansion of the target. At time t1, the target becomes relativistically transparent (ne/ncrγ ≈ 1) and the BOA phase begins [26]. The laser propagates through the target, pushing electrons forward and creating electrostatic fields that efficiently transfer energy from the electrons to the ions; this energy is immediately replenished by the laser. The BOA persists until the density of the expanding target becomes too low for efficient coupling, which occurs at time t2, when the target becomes classically underdense (ne/ncr < 1). In our experiments, the BOA boosts the peak carbon ion energy to ∼44 MeV nucleon−1, i.e. >0.5 GeV, ten times higher than the highest published energy to date for laser-accelerated carbons with TNSA. This is achieved with a laser power of ∼150 TW at an intensity of ∼2 × 10²⁰ W cm−2, well below the peak of current technology at 1.1 PW [28] and 2 × 10²² W cm−2 [29], respectively. The peak particle energy achieved is already suitable for many applications, including IFI [30–32]. This mechanism scales to multi-GeV ion energy with currently available PW-class systems, bringing laser-driven accelerators substantially closer to deployment in advanced accelerators [33], new diagnostics [34] and medical physics applications [35].
2. Experimental setup and results
In our experiments, the laser parameters were held nominally constant, while the target thickness was systematically varied to span the full range of the BOA regime. The technical difficulties in realizing RPA and BOA in particular are twofold: the target needs to be thin enough that the electrons within the laser spot can be heated to relativistic transparency; and it must remain classically overdense to enable efficient coupling and energy transfer from laser-to-electrons (and thus, to ions). To realize these conditions experimentally, two advances were necessary: ultra-thin, nm-scale, free-standing robust targets and sufficiently high laser contrast to prevent premature ionization and expansion of the target before the peak of the pulse. The first was met by utilizing nm-thin diamond like carbon (DLC) foils, produced at LMU Munich [36] using a specialized cathodic arc discharge [37], which yields targets from 3–60 nm thickness. DLC is a form of amorphous carbon with a high content of sp3-bonds (50–75% for the targets used), so the foils possess exceptional mechanical robustness. Furthermore the DLC foils are optically transparent, which increases, relative to metallic targets, resilience against target heating and vaporization making them less susceptible to laser prepulses. A second set of targets was produced by chemical vapor deposition (CVD)6, yielding ∼1 μm thickness targets that were then ion etched as far down as ∼75 nm, giving a total thickness range in the experiments from 3 to 2000 nm with a nominal uncertainty of 3 nm. The thickness variations are largest at the limits of the respective methods, i.e. at 10 and 50 nm for DLC targets, and 100 nm for CVD targets, leading to larger fluctuations. To realize the second condition, extraordinarily high contrast laser pulses are required. The laser contrast Ctime is the ratio of the pedestal/prepulse intensity at the time given by the subscript to the peak intensity of the main pulse. For a typical ultra-high intensity system that ratio is ∼10−6 at ∼1 ns before the 500 fs peak pulse. For a focused peak pulse intensity of I ∼1020 W cm−2, the prepulse intensity will therefore be ∼1014 W cm−2, creating a preplasma and destroying the target before the peak pulse hits. At I > 1020 W cm−2 contrast ratios of C1ns < 10−11 and C5ps < 10−6 are required to observe BOA. At the Trident laser facility [38], we realized these ultra-high contrast conditions by using a new cleaning system based on an optical parametric pre-pulse eliminator [39, 40].
Based on our understanding of BOA we expect to observe the following behavior:
- (i)An increased maximum ion energy compared to the TNSA regime.
- (ii)A broken angular symmetry of the beam, with the fastest ions emitted off-axis in a plane orthogonal to the laser polarization.
- (iii)Higher maximum velocities for ions of larger mass (here: carbon ions and protons) at optimal BOA conditions.
- (iv)The existence of an optimal target thickness for a given set of laser parameters and target density.
Experiments with ultra-thin targets have been performed before but in a completely different regime both in terms of laser and plasma parameters [41]. Here we describe two experimental campaigns: the first was performed at the Trident ultra-high contrast laser facility at LANL, and the second at the Texas Petawatt (TPW) laser facility [42], located in the University of Texas at Austin. On the TPW experiments we used a double plasma mirror (PM) setup [43] to improve the contrast on-target, a method that we also used on our earlier experiments on Trident [44].
2.1. Texas Petawatt experiments
In the TPW experiments, an f /3 off-axis parabolic mirror is used to focus the 1053 nm wavelength laser pulses with pulse durations of 160 fs (full-length at half-maximum (FWHM)) and typical energies of 90 J7 to a spot containing ∼30% of the energy within a 5 μm radius. The laser pulse duration and beam parameters were carefully recorded during the run. The experimental setup is depicted in figure 1(a). The focusing beam is reflected twice from a pair of PMs, positioned at 45° to the beam normal and parallel to each other. The PMs were positioned so that the spot size on the first PM is 12 mm. Both anti-reflective coated and non-coated substrates were used in the experiment. The energy throughput of the PM pair was measured by picking off a part of the expanding beam into an energy meter. The throughput of the PMs was found to have typical values of 69%, in agreement with previously published data [43, 45].

Figure 1. Experimental setup (a) at the TPW experiment: the focusing beam is reflected twice by a pair of PMs, before impinging on the target foil. Ions emitted from the back of the target enter the iWasp through a thin slit, and are deflected upward in the magnetic field. The ion signal is recorded using an image plate positioned behind the spectrometer. (b) at Trident: TP spectrometers on-axis and off-axis at 8.5° and a variety of secondary diagnostics, such as electron spectrometers and laser pulse diagnostics.
Download figure:
Standard image High-resolution imagePlastic (CH2) and DLC foils in a thickness range of 40–2000 nm were used as targets. Nuclear activation of a copper foil stack [46] and a wide angle magnetic spectrometer (iWasp) [47] were used to record both the spatial and energy distribution of the emitted ions. Following a shot, the copper foils were placed on top of an electron-sensitive Fuji image plate (IP) for a period of 40 min (∼τ1/2). Figure 2(b) shows typical IP scans of a six-foil stack. The emitted positrons deposit a signal proportional to the activity level onto the IP. Tabulated energy loss values for protons in copper [48] were used to calculate the most probable proton energy required to activate each foil in the stack (indicated in the figure).
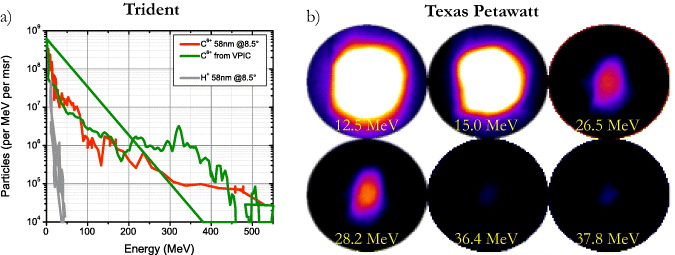
Figure 2. (a) Ion spectra from BOA acceleration using a 58 nm DLC target, optimized for carbon acceleration under Trident conditions (this shot: 90 J, 540 fs, 2 × 10²⁰ W cm−2): the highest ion energies where observed at an 8.5° angle in the plane orthogonal to the laser polarization (red line) and agree well with a two-dimensional (2D) VPIC simulation with the same shot parameters (green line). The accelerated protons (grey) obtain the same energy per nucleon, i.e. the same velocity, as predicted for the BOA regime. (b) IP scans of a stack of six Cu foils which were positioned 10 mm behind a 185 nm CH2 target at the TPW. The most probable energy for the activation of each foil is indicated. The signal corresponds to an angular proton beam divergence range of 15° (for 12.5 MeV protons) to 5° (for 37.8 MeV protons).
Download figure:
Standard image High-resolution imageAn ion-sensitive Fuji IP [49] positioned downstream to the iWasp was used to record the signal of the deflected ions. The signal of x-ray passing through the iWasp slit recorded on the IP provided an absolute reference to determine the amount of deflection. Calibration shots in which a CR-39 [50] plastic detector was placed in front of the IP provided an absolute calibration for the deflected ion energy.
2.2. Trident experiments
The Trident laser delivers pulses of nominally 150 TW at a repetition rate of ∼1 shot per hour, i.e. a very limited number of shots in an experiment. The data discussed here were gathered in three independent beam times in April 2009, March 2010 and April 2011, resulting in a total of ∼200. Pulse energy and pulse duration are measured for every shot and shot-to-shot fluctuations between 60 and 100 J and 500 and 900 fs are observed. The pulse is focused with an f/3 optic to a spot containing ∼45% of the energy within a 3.5 μm radius, and ∼10% of the energy within a 1 μm radius, resulting in an average intensity over the 7 μm spot of lave ∼0.8–2.3 × 10²⁰ W cm−2 and a peak intensity Ipeak ≈ 2.1 − 6.4 × 10²⁰ W cm−2. The focus longitudinal position varied by ±30 μm initially and < ± 10 μm in later campaigns and could not be measured on the shot; this roughly doubled the uncertainty in the actual on-target intensity. In the standard configuration for this experiment, as depicted in figure 1(b), the pulse hits the target at normal incidence (0°) and is linearly polarized in the vertical plane.
The main diagnostic consists of two Thomson parabola (TP) ion spectrometers [51], specifically designed for resolution and maximum trace separation at high particle energies [52]. They are fielded at 0° and 8.5° in the horizontal plane downstream behind the target with a stacked arrangement of CR-39 [50] and Fuji IPs [49] as detectors. The CR-39 was then analyzed by a specialized automated analysis system [53]. Secondary diagnostics include film stacks to record the ion beam profile, electron-, visible light and UV spectrometers and a proton/electron spectrometer [54] at 6°. A full aperture backscatter diagnostic [55] recorded pictures of the target at the time of the interaction, confirming that 3 nm targets were still overdense at peak pulse interaction. In the last campaign we also fielded a single shot frequency-resolved optical gating device (FROG) [56] to measure the shape, duration and phase of the pulse as it is reflected from the target. This technique, described in [26], gives a direct measurement of relativistic transparency by characterizing the effect on the driving laser pulse. In a separate experiment we also fielded a FROG in transmission to get an even more complete characterization [26]. This was not possible here because the required solid angle was taken up by the ion diagnostics.
As we show here, all four signatures have been observed in our recent experiments, being consistent with full BOA acceleration.
- (1)Increased maximum energies. Ion energies in excess of 0.5 GeV were observed for target thicknesses of ∼50–250 nm. Figure 2 shows carbon C6+ and proton spectra from a 58 nm DLC target. The carbon ions exceed an energy of 0.5 GeV, an order of magnitude higher than reported previously for a Trident-class laser working in the TNSA regime. This represents a huge step toward particle energies required for hadron therapy (2–3 GeV). At an energy of 0.5 GeV, ∼108 carbon ion are within a 10 MeV bin. Scaling this number for the requirements of hadron therapy will require a few-Hz repetition rate system. These ion energies also exceed the requirements for IFI [31, 32], although scaling to the required ∼1014 carbon ions per shot forms a substantial challenge for current laser technology.
- (2)Angular distribution. The highest ion energies of 550 MeV are observed at the 8.5° TP (red curve on figure 3(b)), while the cutoff energy on axis (black curve) is significantly lower at 230 MeV. These results are in agreement with 2D and three-dimensional (3D) particle-in-cell (PIC) simulations, using the VPIC code [57]. To resolve the dynamics accurately, the simulations must resolve the initial plasma skin depth δ = c/ωpe (ω2pe = 4πnee2/me) and initial electron Debye length λd = vthe/ωpe, where vthe is electron thermal speed, which, given the large simulation volume over ps simulation time duration, requires the largest supercomputers and most efficient codes. To compare to the experimental results, we simulated a laser pulse with a wavelength λ = 1 μm, a temporal profile I(t) = I0 sin2(tπ/2τ), τ = 540 fs (FWHM) and a transverse profile
 with w = 5.12 μm, incident on a solid density C6+ target with ne/ncr = 821 (2.8 g cc−1) mixed with 20% protons in number density. A typical 2D simulation domain is 50 μm × 50 μm in (x,z). To resolve the Debye length, the electron temperature is set to Te = 18 keV or 165 keV initially, which at ne = 821ncr corresponds to a Debye length of λd ∼1 or ∼3.3 nm, respectively. In 2D, the cell size is 0.3 or 0.44 × 1.76λd along x and z, with 1000 particles cell−1. VPIC simulations are performed over a range of target thickness from 4 to 2000 nm to compare with the experimental scaling. In figure 2, the simulated ion energy spectrum for a 58 nm target at t2 (green line) is overlaid with the corresponding experimental spectrum (red line), showing good quantitative agreement. In the experiments and even in the 2D simulations we find that the highest ion energies are found oblique to the laser propagation. To understand why, we turn to a 3D VPIC simulation of the BOA. This simulation was performed well in advance of the experiment with parameters slightly different from the actual shot parameters8. Figure 3(a) shows iso-surfaces of C6+ kinetic energy between 500 and 700 MeV together with iso-surfaces of E2y. Contours of carbon kinetic energy in the x–z plane are displayed in the inset in a cut plane located along the laser axis. A contour of accelerating electric field is also shown in the orthogonal cut plane in the inset; the peak field co-moves with the carbon ion density peak. The complete ion acceleration dynamics are shown in a supplementary simulation movie accompanying figure 3 (available from stacks.iop.org/NJP/15/085015/mmedia). From the 3D image, the highest-energy ions are off-axis in lobes oriented along the direction perpendicular to the laser polarization. Ion spectra corresponding to the observation angles of the experiment from this simulation are shown in the figure 3(b). The simulated spectra (right) qualitatively reproduce the observed experimental results (left). The ion beam lobes result from the ponderomotive force on the electrons during the BOA, which expels electrons radially from the center of the laser pulse and creates a slowly varying perpendicular momentum profile that is nearly azimuthally symmetric. (Here '⊥' indicates the plane perpendicular to the laser propagation). The time-averaged electron fluid density evolves according to the continuity equation , where brackets indicate an average over a laser cycle, ne is the electron density in the laboratory frame, and is the electron fluid momentum. The quantity contains a dot product of slow and fast components of the perpendicular electron momentum, which in turn produces a smaller time-averaged γ−1 along the laser polarization than perpendicular to it. While single-particle relativistic orbits of electrons in the laser field would yield no breaking of angular symmetry, in dense plasma, where collective effects manifest, the relativistic fluid kinematics change: an impulse applied to a population of moving electrons in the direction of their motion produces a smaller change in fluid radial speed than an impulse of the same magnitude applied perpendicular to their motion. In the time-averaged fluid dynamics, this difference leads to a larger flux of electrons perpendicular to the laser polarization and, thus, to the production of lobes in the electron density. Space-charge electric fields from these electron density lobes generate corresponding lobes in the most energetic portion of the ion beams. More details on the relativistic kinematics may be found in [27].
 - (3)Mass dependence of the acceleration process. A further strong indicator that we are in the BOA regime is that the carbon velocities by far exceed 1/2 the proton velocity, the theoretical limit of TNSA; in some cases carbon ions even outran the protons. Figure 2 shows an example where the fastest carbon ions gained ∼44 MeV amu−1 while the protons (gray curve) gained ∼42 MeV amu−1 corresponding to ratio of carbon-to-proton velocity of vion/vproton = 1 ± 0.1. In TNSA this ratio can never exceed 0.5, whereas vion/vproton > 0.5 is a characteristic feature of BOA, as shown in [25]. Since the target is transparent and all bulk ions take part in the interaction, the maximum fields are set up by the electrons and the ion species that contributes most of the charge, and move with those distributions. Less abundant ion species, especially if they are lighter, show a different dynamics can see lower fields for part of the time. This situation is impossible to obtain in pure TNSA, where only the few atomic ion layers on the rear surface take part in the interaction. In TNSA, all accelerated ions see the same quasi-static field. The higher charge-to-mass ratio of protons ensures that they obtain at least twice the velocity of the next heavier fully stripped ion species. In practice, the difference is even higher, with the largest reported fraction of vion/vproton = 0.16 in [7].
- (4)Scaling and analytic model. We expect a characteristic optimal target thickness for the BOA that depends on the times t1 and t2, when the target becomes relativistically transparent and classically underdense, respectively. This expectation is based on an extensive parameter scan using VPIC simulations and on a simple analytical model for the maximum ion energies. It is confirmed by the aggregate data gathered over three independent beam times. In the simulations, >80% of the ion acceleration in the BOA occurs between times t1, when the target becomes relativistically transparent (ne = γncr) and t2, when the electron density in the expanding target reduces to ne ≈ ncr. Figure 4(a) shows maximum carbon ion energy as a function of time overlaid with a temporal profile of the laser intensity. The carbon energy gain is small before t1 and after t2 (not shown). For time t1 < t < t2, the target density decreases and γ increases, as in figure 4(b). Peak laser intensity falls between t1 and t2, so the average laser intensity, the energy source for the BOA, is maximized.


![$\gamma ^{-1}= \{1+[(\skew4\vec {p}_{{\mathrm { e}}\bot }+e\skew4\vec {A}/c)^2+p_{{\mathrm { e}}\parallel }^2]/(m_{\mathrm { e}}c)^2 \}^{-1/2}$](https://content.cld.iop.org/journals/1367-2630/15/8/085015/revision1/nj465781ieqn5.gif)

Figure 3. (a) 3D VPIC simulation of BOA acceleration in the interaction of a 156 fs (FWHM) laser pulse at 1021 W cm−2 with a 30 nm solid density carbon target. Shown is a 3D view near time t2, at the end of the BOA phase. Iso-surfaces of laser pulse intensity are represented by the color coded structure on axis and is linearly polarized in the horizontal plane. Carbon ion kinetic energy iso-surfaces are color-coded for their energy as depicted by the legend and reach energies of ∼700 MeV. The highest energies are observed at a slight angle in the vertical plane. The horizontal plane shows projections of the laser field, while the vertical plane shows projections of the ion energies. The inset shows a cutaway view of the ion acceleration, with the ion energies shown color coded on the vertical plane and the accelerating electric field color-coded on the horizontal plane. The longitudinal field co-moves with the ion front, with the highest field strength coinciding with the highest ion energies. (b) C6+ spectra on axis and at 8.5°. From experiment (left) and from the 3D VPIC simulation (right) at τ = 165 fs. The simulation was performed well in advance of the experiment with parameters slightly different from the actual shot parameters.
Download figure:
Standard image High-resolution image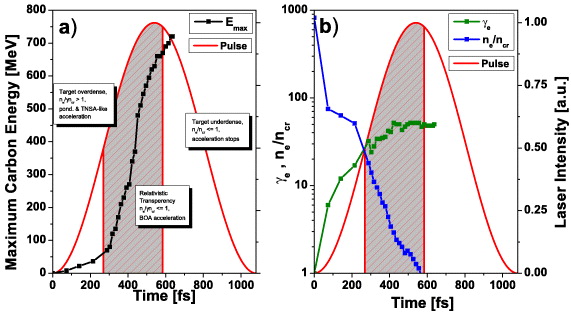
Figure 4. 2D VPIC simulation for Trident pulse: E = 90 J, t = 540 fs, Iave = 2 × 10²⁰ W cm−2, Ipeak = 5 × 10²⁰ W cm−2, target 58 nm DLC at 821ne,0/ncr. Three quantities are plotted over the course of the pulse: maximum ion energy (a), electron density ne/ncr (b) and the electron γ-factor (b). Over the course of the interaction, three phases can be identified: phase I: ne/(ncrγe) ⩾ 1 the target is overdense, the laser pulse heats electrons, the target expands and moderate ion acceleration to ∼0.1c takes place due to ponderomotive pressure and quasi-static field build-up. The ions reach ∼10–20% of their final energy; phase II: ne/(ncrγe) ⩽ 1, the target becomes relativistically transparent and the pulse starts to propagate through the target, efficiently coupling laser energy into the ions. The remaining 80–90% of the final ion energy is gained in this stage. Phase III: ne/ncr < 1, the target becomes classically underdense, the laser coupling efficiency to the electrons is minimal and acceleration ceases.
Download figure:
Standard image High-resolution image3. Analytical model
Based on the understanding gained in the VPIC simulations and a first set of data from targets ranging from 4–60 nm, we developed a reduced analytical model that predicts the maximum ion energies for a given set of laser and target parameters. While not as complete as the PIC simulations that include all details of the highly nonlinear, relativistic physics, it captures the essential behavior and guides design of experiments and laser systems without requiring substantial computing resources. The best coupling between the laser pulse and foil electrons arises when the electron density approaches the relativistic transparency density at t = t1, estimated assuming one-dimensional target expansion driven by a laser pulse a = a0 sin2(Ωt), where a0 is the dimensionless light amplitude of the laser pulse, with pulse length τ and Ω = π/2τ. Provided the target thickness d is much smaller than the focal spot diameter, t1 = [(Mi/me)(3N2d2/ZiΩ2c2a30)]1/4, where Zi is ion core charge, N = ne/ncr is the normalized electron density, d the target thickness, c the speed of light and me and Mi are the electron and ion masses, as described in [58]. Alternate descriptions of relativistic transparency can be found, e.g. [59, 60]. Between t1 and t2, the laser drives a 3D, spherical, isotropic expansion of the target until n2 = ne(t2)/ncr = 1; expansion occurs over a time interval t1 − t2 = Nd(γ1/3 − 1)/γCs sin(Ωτ), where Cs≅(Zimec2a0/Mi)1/2. After t2, no more significant ion acceleration occurs. An important difference between the BOA and TNSA is the former's collective, as opposed to stochastic, electron motion. In TNSA, electrons only interact with the laser field over the time spent within a skin-depth layer of the target, which tends to wash out collective effects. In the BOA, relativistically induced transparency allows the laser field to interact directly with the bulk electron population over the primary acceleration phase. This leads to collective electron motion driven by the laser field and a coupling among the laser, electrons and ions during the acceleration period. We evaluate the ion energy gain in the BOA model by applying the analysis reported in [58], in which the energy gain between t1 and t2 (the predominant contribution to the ion energy) is obtained. This ion energy is approximately Eion = (2α + 1)Zimec2f(t1,t2,α), where Zi is the ion core charge and  is the average normalized laser amplitude between t1 and t2. The function f(t1,t2,α) = [1 + Ω(t2 − t1)]1/(2α+1)−1 arises from a time integral over the interaction and contains the collective stopping parameter α indicating the strength of coupling between electrons and ions; α ∼ 3 for Trident parameters.
For a given set of laser parameters and target density, this model predicts an optimum target thickness, at which the coupling among the laser ponderomotive drive, electrons, and ions is maximized. The evaluation of the model and its comparison with both PIC simulations and Trident data are shown in figure 5(a). The data were collected in three experimental campaigns from April 09 until April 11. All shots considered have E > 70 J,  . We evaluated the model (green lines) for three different peak intensities: the maximum intensity observed on a shot for the presented data set (Imax ≈ 6.4 × 10²⁰ W cm−2), the minimum intensity (Imin ≈ 2.1 × 10²⁰ W cm−2) and a typical intensity, which was also used in the simulations (Isim ≈ 5 × 10²⁰ W cm−2). Also, target expansion will occur due to remaining imperfections even in the cleaned pulse. We evaluated the model for expansions corresponding to 300–600 nc, from the cold target electron density of 900 nc. In addition to the model we plot cutoff energies from a suite of 2D VPIC simulations9 (green triangles) and a corresponding model calculation (green dotted line). Figure 5(b) shows proton cutoff energies as a function of target thickness as measured on the recent TPW experiments. The calculated curve (dashed black) used the recorded beam parameters averaged over all shots, with E = 62 J (energy on-target), τ = 160 fs and a spot size radius of 5 μm. While the PMs significantly improve the TPW laser contrast, there are still levels of prepulse present exceeding those in the Trident system. Consequently we observe an increase in target pre-expansion to about 1/3 of the initial cold target density of ne = 280ncr (dotted black). Using our relativistic model, we find a best fit to the density at peak interaction at a value of ne = 90ncr.
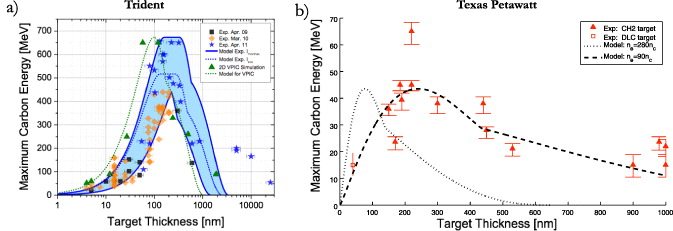
Figure 5. Cutoff energy versus target thickness: (a) comparison of Trident experimental data, simulations and an analytical model. The symbols are the measured maximum cutoff energies for different target thickness, the error bars are a function of target fluctuation and number of shots at a given thickness. The green triangles are the equivalent cutoff energies obtained by 2D VPIC simulations. The blue lines are the predictions of our analytical model for different laser intensities (Min, Max, typical) and ne = 300–600 nc. The model predictions are in good agreement over the validity range of the model up to ∼600 nm (beyond that, the model predicts much lower energies since it does not contain the physics of thick target interaction and therefore underestimates the TNSA in this regime). Also shown in green is the analytical model prediction for the 2D VPIC simulation conditions. (b) Results from TPW experiments employing PMs to improve the on-target contrast. Data were collected by either the iWasp or Cu stacks. BOA calculated curves are shown assuming an initial density of a cold target, ne = 280ncr (for CH2), and for a best fit initial density value of ne = 90ncr.
Download figure:
Standard image High-resolution imageWe observe the same qualitative behavior in the data, the simulations and the analytic model: a clear maximum around an optimal thickness of 150 nm with a sharp decrease toward thinner targets and a gradual decrease toward thicker targets. For thinner targets (4–30 nm), the maximum energy decreases because the target becomes transparent early and expands rapidly, leading to a shorter acceleration period and lower average laser intensity during the BOA. On the other hand, much thicker targets (300–600 nm) only become transparent at the end of the pulse, when the laser intensity is low. Above 600 nm, the target remains opaque and the model and experimental data deviate, since TNSA physics is not included in the model. Figure 6(a) shows the FROG trace of the reflected pulse which we used to directly probe the induced target transparency, from a shot on a 165 nm thick DLC target. Figure 6(b) shows the analyzed temporal intensity profile (red) and temporal phase (blue). Overlaid is a representation of the input pulse (black). As explained in detail in [26], the steep drop in the phase is indicative of the onset of relativistic transparency at t1. The vertical green line indicates the value for t1 as predicted by our analytic model. As the density drops further, reflection decreases and finally ceases completely. The orange line shows the model prediction for t2, where ne ≈ ncr. Despite the large uncertainty in target intensity, we observe good quantitative agreement between the model and the observed maximum ion energies. For those shots we can assume the target was at best focus and the experimental parameters correspond closely to the model and simulation parameters. The model thus presents an upper bound on ion energy for a given set of laser and target conditions and is predictive: indeed, the model was developed based on experimental data for target thicknesses smaller 60 nm, yet it provided an accurate prediction for data, obtained later, above that thickness. This lends credibility to this model as a design tool for future experiments. Also, the VPIC simulations agree well with both the data and the model. Given the experimental uncertainties regarding both laser and target parameters (O ∼ ± 20%), the observed deviations between experimental data and PIC simulations are surprisingly small. The modest systematic trend toward higher energies and thinner optimal target thickness in the simulations can be understood in terms of dimensionality effects in 1D and 2D simulations, which would tend to expand the target more slowly than in 3D, thus delaying t2. Overall, the experimental data, simulations and reduced model are in good quantitative agreement and the data can be explained qualitatively and quantitatively by the BOA acceleration model. We therefore interpret our data as the first experimental demonstration of BOA acceleration.

Figure 6. FROG measurement of a Trident pulse (85 J, 760 fs) reflected from a 165 nm CVD diamond target. (a) FROG trace. (b) Analyzed temporal intensity profile (red) and temporal phase of reflected pulse (blue). Overlaid is the input pulse (black dots). Red and orange lines indicate t1 and t2 calculated by the analytic model. They match the start of a steep drop in phase, indicating the onset of relativistic transparency and the end of significant reflection as the plasma becomes classically underdense, and are consistent with both the measurements.
Download figure:
Standard image High-resolution image4. Conclusions
We present here the first experimental demonstration of BOA acceleration reaching carbon energies in excess of 0.5 GeV and demonstrating the required particle energies for carbon-driven IFI. The data are in good agreement with kinetic simulations, both previously published and dedicated to this set of data. Furthermore, we developed a reduced analytical model that predicts ion cutoff energies for different target and laser parameters. This model is in good quantitative agreement with the observed data and has already made astonishingly accurate predictions. The good quantitative agreement between experimental data, simulations and analytic model gives confidence in our understanding of the BOA process and its further predictions, including scalability, high efficiency and spectral tailoring. Based on these results, we predict with confidence that GeV carbon energies for hadron therapy are achievable with today's technology. This is only the very first demonstration of this new acceleration mechanism.
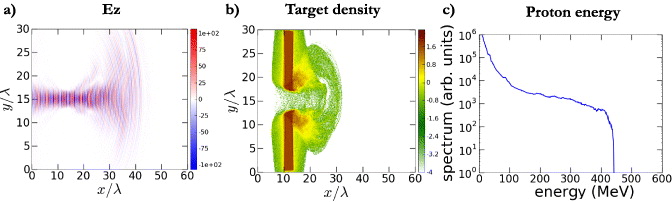
Both experiment and simulation indicate that a main feature of BOA is the equal velocity distribution between different ion species. With the goal of efficient generation of proton beams, a target with a small fraction of heavier nuclei is desired. On the experimental campaigns describe here, DLC and CH2 targets were used. Optimally one would expect that an optimal laser–target energy coupling will be achieved using a pure (cryogenic) hydrogen target. Figure 7 shows 2D VPIC simulations results for proton generation by a TPW pulse focused to 2 μm FWHM interacting with a 4 μm cryogenic hydrogen target (other parameters of this simulation are shown in figure 7). The resulting proton spectra reach an endpoint of almost 450 MeV.
Figure 7. 2D VPIC simulation for TPW pulse: E = 160 J, t = 150 fs, I = 2 × 10²² W cm−2, interacting with a 4 μm solid density pure hydrogen target at t = 130λ/c. (a) Laser field magnitude in the z direction and (b) target density color coded (c) proton spectrum extracted down the centerline.
Download figure:
Standard image High-resolution image
As has been the case with other laser-driven particle acceleration mechanisms, progress in target design, both geometry and composition, as well as in laser performance will significantly improve the performance of BOA, moving laser-based acceleration one step closer to application.
Acknowledgments
We gratefully acknowledge the expert support of the Trident and TPW laser teams in conducting the experiments and the support of V Liechtenstein of the Kurchatov Institute, Moscow, in the development of DLC targets. The VPIC simulations were run on the LANL Roadrunner supercomputer. This work was supported by LANL Laboratory Directed Research & Development (LDRD), the DOE Office of Fusion Energy Sciences (OFES) and by the Deutsche Forschungsgemeinschaft (DFG) through Transregio SFB TR18, the DFG Cluster of Excellence Munich-Centre for Advanced Photonics (MAP) and DFG LMU-Excellence (M Hegelich).
Footnotes
- 6
Targets developed and supplied by Applied Diamond, Inc., Wilmington, DE 19805.
- 7
On this beam time, a reduced laser energy of 90 J was used instead of the usual 150 J due to optical damaged mirrors in the laser chain.
- 8
Pulse duration 156 fs instead of 540 fs FWHM, intensity 1021 W cm−2.
- 9
Simulation parameters as specified above for the 2D case.