


Abstract
Site-selective x-ray detected magnetic resonance (XDMR) spectra were recorded in transverse detection geometry on two iron garnet thin films grown by liquid phase epitaxy (LPE) on oriented gadolinium gallium garnet (GGG) substrates: whereas the stoichiometry of the first film corresponded to pure yttrium iron garnet (1 = YIG) used as reference, yttrium was partly substituted with lanthanum and lutetium in the second film (2 = La–Lu–YIG). Surprisingly, the XDMR spectra of film 2 recorded at either the Fe K-edge or the La L3-edge revealed well-resolved structures that had fairly different relative intensity depending on whether we probed the tetrahedral ( ) sites of iron or the dodecahedral (
 ) sites of lanthanum. The narrow XDMR lines measured at the Fe K-edge also contrast with the broad, foldover distorted lineshapes of the ferrimagnetic resonance spectra measured in the same scan. Further XDMR experiments were carried out with a thin, disc-shaped, single crystal of gadolinium iron garnet (3 = GdIG). At temperatures slightly above the gadolinium ordering temperature (T > TB = 69 K), the Gd L2-edge XDMR spectra were dominated by two well-resolved lines of nearly equal intensities. Similarly, the Fe K-edge XDMR spectra recorded under identical conditions did also split into several narrow lines but of strongly unequal intensity. These results suggest that, in the exchange-enhanced paramagnetic regime, spins precessing at the dodecahedral (
 ) sites of gadolinium do not couple in the same way with spins precessing at either the tetrahedral (
 ) or octahedral (
 ) sites of iron. On the other hand, destructive interferences between modes of opposite helicities were also observed in Fe K-edge XDMR spectra recorded far above the compensation temperature (T ≫ Tcp = 290 K). This looks like a typical signature of nonlinear four-magnon scattering processes at a very high pumping power.
Export citation and abstract BibTeX RIS
1. X-ray-detected magnetic resonance (XDMR) in ferrimagnetic iron garnets
1.1. Magnetic resonance with element and edge selectivity
In recent years, XDMR emerged as a novel spectroscopy in which x-ray magnetic circular dichroism (XMCD) is used to probe the resonant precession of either spin or orbital magnetization components in a strong pump field typically oscillating at microwave frequencies [1–17]. XDMR can be seen as a double-resonance experiment since two independent conditions need to be simultaneously satisfied: (i) either the frequency of the microwave pump field or the effective magnetic field acting locally on spin and orbital magnetization components has to be tuned to magnetic resonance; (ii) the energy of the monochromatic, circularly polarized (CP) x-ray photons has to be adjusted in order to maximize the amplitude of the XMCD probe signal. This can happen only in the close vicinity of one of the multiple absorption edges of a given absorbing element. In this respect, XDMR spectroscopy is inherently element-selective.
Edge-selectivity stems from the conservation of angular momentum in the photoionization process of deep atomic core levels [18]: the angular momentum carried by a CP x-ray photon (+ℏ for a right-handed circular polarization and −ℏ for a left-handed circular polarization) is transferred to the excited photoelectron in a way that primarily depends on spin–orbit coupling in the excited core level. For L2,3 absorption edges that are split by the spin–orbit, the Fano effect implies that a part of the photon angular momentum is converted into spin moment of the photoelectron via spin–orbit coupling (ℓ + s at the L3 edge; ℓ − s at the L2 edge). Obviously, no such conversion is possible at a K-edge (or L1-edge) due to the absence of spin–orbit coupling in the core state and the photon angular momentum is entirely converted into ±ℏ orbital moments of the photoelectron. Next, the excited photoelectron will probe the spin and orbital polarization of the final states, which is expected as a consequence of magnetic exchange splitting under the additional constraints of crystal field and spin–orbit interactions. In this respect, XMCD spectra simply reflect the difference in the density of final states that are allowed by the electric dipole (E1) selection rules owing to the symmetry of the initial core state. It immediately appears that an XMCD signal measured at a K-edge can only be assigned to the orbital polarization of the final states. The interpretation of the XMCD spectra recorded at spin–orbit split edges is not as straightforward since one has to disentangle the intricate contributions of spin and orbital polarizations. By summing up the integrated dichroisms resulting from the excitation of electrons originating from conjugated sub-levels, the residual signal should be assigned to the orbital polarization of the final states; in contrast a properly weighted difference between the integrated dichroic intensities measured at the L3 and L2 edges should reflect the spin imbalance in the excited states given that the orbital momentum transferred to the photoelectron has strictly the same sign at both edges. This is the physical content of the XMCD sum rules [19–21].
However, in field-scan XDMR experiments, the spectra are recorded at a fixed x-ray photon energy (ERX) maximizing the sensitivity of the XMCD probe: under such conditions, there is no point in referring anymore to integrated dichroism intensities. Moreover, orbital (Lz) and spin (Sz) magnetic moments are energy-integrated quantities which may well vanish even though a large dichroic signal can be measured at selected photon energies: this is typically the case of XMCD spectra recorded at the L-edges of the diamagnetic Y3+ cations in yttrium iron garnet (YIG) thin films [22]. In this context, a differential formulation of the XMCD sum rules as proposed by Strange [23] and others [24–26] clearly looks more appropriate for XDMR, even though one should admit that it was never established on a firm theoretical ground.
Let us first consider the case of an XDMR experiment carried out at a K-edge. Ignoring first electric quadrupole (E2) transitions, one may write [2, 5]

in which [Δσ]K is the difference in absorption cross-sections for left- and right-CP x-rays measured in the vicinity of the K-edge, Cp being a constant factor. Note that such a differential formulation of the sum rule refers to a fixed energy of the photoelectron: ΔE = ERX + E0 − EF, where ERX, E0 and EF, respectively, denote the energy of the x-ray photons, the binding energy and the reference Fermi level. Whereas 〈Lz〉p is the expectation value of the orbital angular momentum operator integrated over all states featuring p-type symmetry, 〈ℓz〉p defines the orbital polarization of p-projected densities of states (DOS) at energy ΔE. Taking into account the weaker electric quadrupole (E2) transitions essentially results in mixing of final states associated with atomic orbitals of different symmetries:

This result relies on the simplifying assumption that the contribution of higher-order (octupolar) orbital operators truly vanishes in cubic crystal fields or is negligible [21]. Then, the relevant picture for XDMR experiments at K-edges is that of the forced precession of some orbital magnetization components proportional to 〈ℓz〉.
The case of XDMR experiments carried out at spin–orbit split L2,3-edges is considerably more involved due to intricate contributions of a variety of ground state spin and orbital operators [27, 28]. For the sake of simplicity, we shall retain a formulation successfully used to analyze magnetic EXAFS experiments [26, 29]:

in which Nb ≃ 2 is the statistical branching ratio. At least three operators (ℓz, sz, tz) may then be required to describe the dichroic signal at a fixed energy: those clearly exhibit some analogy with another set of operators (w101, w011, w211) used by Van der Laan to describe the line shape of XMCD spectra at L-edges [27]. Note that the validity of equations (3) and (4) was only established for cubic systems in which 〈tz〉 and 〈w211〉 both vanish [25]. A similar situation should still prevail for iron garnet thin films or single crystals as considered in this paper. Moreover, it will be shown in the next section that the XDMR spectra recorded at the L-edges of yttrium, lanthanum or gadolinium essentially reflect the precession dynamics of the spin polarized magnetization components 〈sz〉, the relevant contribution of 〈ℓz〉 being systematically found to be negligible.
1.2. Site-selective ferrimagnetic resonance in iron garnets
It is the aim of this paper to check how far the information extracted from XDMR spectra recorded at different absorbing edges could provide us with a refined picture of the precession dynamics of local spin and orbital magnetization components. In this respect, ferrimagnetic iron garnets look like an excellent testing ground for such challenging investigations. Recall that yttrium iron garnet (YIG) is the prototype member of a rich family of ferrimagnetic compounds that all have the same cubic crystal structure (space group: Ia  d; group N°230) [30] and in which the yttrium ions (Y3+) can be substituted in variable proportions with nearly all the trivalent rare earth (RE) cations. The generic formulation {Y1−x,REx}3[Fe]2(Fe)3O12 emphasizes the coexistence of two non-equivalent iron sites: in the first one (16a sites), the trivalent iron ions are octahedrally coordinated with oxygen anions (point group:
  ), whereas in the second one (24d sites), they are tetrahedrally coordinated (point group:
  ). Below the magnetic ordering temperature (TC ≃ 550 K), the two iron sublattices get magnetized antiparallel to each other according to the ferrimagnetic model of Néel, with an unbalanced magnetization (about 5 μB) in favor of the tetrahedral sites. It has long been recognized that the two iron sites were indeed coupled by a strong superexchange interaction mediated by the oxygen anions [22, 30].
As a useful preamble, we would like to draw attention to ab initio simulations of the contributions of each individual site to the whole dichroic signal of YIG in its ferrimagnetic state. These simulations were carried out with the fully relativistic PY–LMTO–LSDA code [31]. Typically, we have reproduced in figure 1(A) the specific contributions of the tetrahedral ( ) and octahedral (
 ) coordination sites of iron to the Fe K-edge XMCD spectrum in the spectral range of the XANES pre-peak. As commonly expected, it is clearly seen that the contributions of the electric quadrupole (E2) transitions are very weak. However, the point of considerable importance for this work is that the contribution of the electric dipole (E1) transitions to the XMCD signal is much stronger for the tetrahedral (
 ) than for the octahedral (
 ) coordination sites of iron: this is because E1 transitions are allowed from the 1s core level to final states that belong to the same representations (b, e) of group
  as the 4p atomic orbitals, whereas E1 transitions are forbidden to final states belonging to the ag or eg representations of group
  . In other words, XDMR spectra recorded at the maximum intensity of the Fe K-edge XMCD spectrum should benefit from a strong site-selectivity favoring the
  Fe sites: this is indeed a considerable advantage over ferrimagnetic resonance (FMR).

Figure 1. (A) The respective contributions of the tetrahedral ( ) and octahedral (
 ) coordination sites of iron to the Fe K-edge XMCD spectrum of YIG: all the displayed spectra were simulated in the energy range of the Fe K-edge pre-peak using the PY-LMTO-LSDA code. Site selectivity arises because the XMCD signal due to electric dipole transitions (E1) is much stronger at the
  sites than at
  sites. The contributions of electric quadrupole transitions (E2) are anyhow one order of magnitude weaker. (B) Simulated spectra of the spin and orbitally polarized d-projected DOS 〈sz〉4d and 〈ℓz〉4d at the yttrium (
 ) sites. Note that 〈ℓz〉4d is very weak when 〈sz〉4d reaches its extrema; there is no significant contribution of 〈tz〉4d.
Download figure:
Standard imageThe latter simulations also provided us with an opportunity to check the limits of validity of the differential sum rules for XMCD experiments carried out at the L-edges of yttrium. The results have already been detailed elsewhere [22]. As suspected, the integrated ground state spin moment 〈Sz〉s,d,f ≃ 0.03 μB is very small, whereas both 〈Lz〉s,d,f and 〈Tz〉s,d,f simply vanish. In contrast, the spectra reproduced in figure 1(B) confirm that quite a substantial and well-structured XMCD signal can be perfectly measured at the L-edges of yttrium. Actually, the corresponding dichroic signals have already been used to measure a weak XDMR signal at the Y L-edges [5]. It is clearly seen from figure 1(B) that such an XDMR signal should essentially probe the precession dynamics of the spin magnetization component 〈sz〉d which largely exceeds 〈ℓz〉d, especially when the dichroic signal is maximized.
1.3. Paper content and organization
Following the present introduction, section 2 is dedicated to a brief review of a variety of experimental and instrumental constraints that apply to the XDMR experiments reported in this paper. In particular, we feel that it important to introduce the reader to the superheterodyne detection scheme that was developed at the ESRF to record high-quality XDMR spectra in the so-called transverse detection geometry (TRD). We would like to also highlight some efforts made to upgrade the performances of our XDMR spectrometer.
In section 3, we shall compare the Fe K-edge XDMR spectra collected on two iron garnet thin films that were grown by liquid phase epitaxy (LPE) on oriented gadolinium gallium garnet (GGG) substrates: film 1 = Y3Fe5O12 (YIG no. 520) was grown on a [111] substrate; film 2 = [Y1.3La0.47Lu1.3]Fe4.84O12 (Y–La–LuIG) was grown on a [001] substrate. In film 2, we deliberately selected 'diamagnetic' (1S0) RE cations (La3+, Lu3+) to substitute for Y3+ in the dodecahedral (24c) sites (point group:  ). Note that a careful characterization of films 1 and 2 and of their magnetic properties has already been reported elsewhere [22]. In the latter reference, we also reported detailed analyses of the XMCD spectra recorded not only at the Fe K-edge, but also at the yttrium, lanthanum and lutetium L-edges for film 2: these analyses included the evaluation of equations (3) and (4) as well as a useful comparison of the spectra associated with the magnetically polarized 〈sz〉 and 〈ℓz〉 4d-DOS of yttrium and 5d-DOS of lanthanum. In particular, it was found that the magnetically polarized 5d-DOS at the lanthanum sites were structured in quite the same way as the polarized 4d-DOS of yttrium in YIG. It was also confirmed that, at the lanthanum sites, 〈2sz〉5d largely exceeded 〈ℓz〉5d [22].
Keeping in mind that XDMR spectra recorded at the Fe K-edge are largely dominated by the precession dynamics of orbital magnetization components at the  sites, we found it very attractive to look for subtle differences in XDMR spectra recorded at the La L-edges which we expect to reflect mostly the precession dynamics of very weak, induced spin magnetization components located at the
  sites. Unfortunately, even for film 1, the XDMR signal measured at the Y L-edges was too weak to make such a comparison meaningful.
In section 4, we shall report further XDMR spectra collected on a thin, polished disc of a gadolinium iron garnet single crystal (3 = Gd3Fe5O12 = GdIG). Even though YIG and GdIG have identical crystal structures and nearly the same Curie temperatures (TC = 551–556 K), their magnetic properties are fairly different due to the weak coupling of the Gd sublattice with the iron  sublattice: recall that the Gd spins get fully ordered only below a further ordering temperature (TB ≃ 69 K) [32]. Above TB, the Gd magnetization can be described as a temperature-dependent Brillouin function for spin 7/2 in a field proportional to the net magnetization of the strongly coupled ferric ions. The most spectacular consequence is the existence of a compensation point, i.e. a temperature (Tcp = 290 K) at which the spontaneous magnetization of GdIG passes through zero [30]. It has long been known that major changes can be observed in FMR spectra at the compensation point. One of these is the inversion of the Larmor precession helicity [33]. This point stimulated our curiosity and encouraged us to check whether the Fe K-edge XDMR spectra would similarly be sensitive to such a change of precession helicity. However, we would like to show that XDMR experiments revealed even more spectacular spectral changes that one could not see in FMR, e.g. near the gadolinium ordering temperature.
2. Experimental and instrumental constraints
The experiments reported in this paper were all carried out at the ESRF beamline ID12, where an XDMR spectrometer has now been permanently installed for several years [3, 5]. Recall that beamline ID12 was optimized for x-ray circular dichroism studies over the entire energy range 2–20 keV. Owing to the limited beamtime available for projects running on beamline ID12, XDMR experiments clearly suffer from the serious handicap that long data acquisition times are most often needed due to the weakness of the XMCD probe signal.
2.1. Sample-related constraints
It should be immediately noted that the oriented GGG substrates used to grow films 1 and 2 by LPE are far too thick (d = 457 ± 50 μm) and too absorbing to let the XMCD probe signal be measured in a transmission mode. The same situation prevails for the small disc cut from a GdIG single crystal. The XMCD probe signal can nevertheless be detected by measuring the x-ray fluorescence total yield. Several factors, unfortunately, concur to lower the detection sensitivity: (i) the limited solid angle over which the x-ray fluorescence photons can be collected; (ii) the rather poor fluorescence yield, especially at the L edges of yttrium or even lanthanum; (iii) a substantial re-absorption of the fluorescence photons by the sample itself (e.g. the lutetium Lα or Lβ lines are strongly reabsorbed at iron sites). One should also worry about a dramatic loss of sensitivity whenever one has to extract a weak XDMR signal from a strong background contributing only to the statistical noise: this typically happens at the Gd L2 absorption edge where there is a fairly intense fluorescence background due to the large residual absorptions associated with the Gd L3 and Fe K edges. There is indeed a price to be paid in terms of data acquisition length.
There is an additional constraint that becomes crucial when working with x-ray photons of high energy: the skin depth of the microwave radiation should (greatly) exceed the penetration depth of the x-ray photons. This condition is fully satisfied by iron garnets, which are known to be excellent insulators with no skin depth restriction.
2.2. XDMR geometries
Recall that XDMR spectra can be recorded in two distinct detection geometries:
- 1.In the transverse geometry (TRD), the wavevector k⊥RX of the incident, CP x-rays is set perpendicular (⊥) to both the external bias field B0 and the microwave pump field bp: the XMCD probe signal is then proportional to a weak transverse magnetization m⊥ which oscillates at the microwave pump frequency.
- 2.In the longitudinal geometry (LOD), k∥RX is set parallel (∥) to B0. In this geometry, what is measured is mainly a time-invariant XMCD signal proportional to the steady-state change mz of the projection of the magnetization along the precession axis (z).
For a ferromagnetic thin film with uniaxial anisotropy and perpendicular magnetization, the opening angle of precession θ0 is quite small. However, θ0 is a constant of motion which characterizes the precession dynamics and can be determined by normalizing the XDMR cross-sections ΔσXDMR(k∥RX) with respect to the equilibrium XMCD cross-sections measured in the absence of any microwave pumping [2, 5]. For XDMR measurements in longitudinal detection (LOD) geometry:

whereas in the TRD geometry:

It is immediately seen that mz is only a second-order effect with respect to the opening angle of precession (θ0) and m⊥. Moreover, any information on the phase and helicity of the precession gets lost in LOD geometry. One should also keep in mind that the relaxation processes directly affect θ0: the shorter the relaxation times, the broader will be the resonance lineshapes and the weaker the intensity of the XDMR signal at resonance [2].
2.3. Superheterodyne detection scheme
The TRD geometry unfortunately suffers from the considerable handicap that there is, as yet, no x-ray detector that can measure a small dichroic signal oscillating at microwave frequencies, especially in the x-ray fluorescence excitation mode. At the ESRF, high-quality XDMR spectra could nevertheless be recorded in TRD geometry using a novel heterodyne detection scheme [3, 5]. The underlying concept becomes fully transparent if one converts into the frequency domain the time-structures of the incident x-ray beam and of the related fluorescence intensities. Typically, the time-structure of the excited x-ray fluorescence intensity (If(t)) consists of a series of discrete bunches, with a periodicity ΔT = 1/RF = 2.839 ns defined by the RF frequency (352.202 MHz) of the ESRF storage ring. Let us admit that all bunches have a Gaussian shape with an average full-width at half-maximum length of about 50 ps:

On Fourier-transforming If(t), one obtains in the frequency domain a Gaussian envelope of harmonics of the RF frequency:

One can easily check that the half-width at half-maximum of the Gaussian envelope, ΔF1/2 ≃ 25 × RF = 8.79 GHz, falls in the microwave X-band. Since the ESRF storage ring inherently provides us with a microwave local oscillator (LO) at a frequency close to the XDMR pumping frequency, it seems most attractive to measure the resulting low-frequency beating signal. A further gain in sensitivity was obtained by exploiting a super-heterodyne detection scheme relying on a 180° bi-phase modulation technique (BPSK; bi-phase-shift keying) [5]. Defining the XDMR pumping frequency as Fp = N × RF + IF, the superheterodyne detection consists in catching the modulation satellites at frequencies IF ± Fbpsk. A block diagram summarizing the entire detection scheme used for XDMR experiments in TRD geometry is reproduced in figure 2.

Figure 2. Block diagram of the superheterodyne detection scheme used in TRD geometry. Key components include an ultra-low phase noise microwave generator (Anritsu) and a high-sensitivity multichannel vector spectrum analyzer (Agilent Technologies) operated in the time-average mode. Both the Anritsu generator and the VSA are locked to the same 10 MHz RF master oscillator. What makes the superheterodyne detection possible is the 180°-biphase microwave modulator (BPSK) operated at low modulation frequency (Fbpsk). A combination of two quadrature (IQ) microwave mixers and of two RF mixers allows us to carry out vector analyses of FMR and XDMR spectra.
Download figure:
Standard imageWhereas the heterodyne or superheterodyne detection schemes clearly belong to the group of time-average measurement methods, a time-resolved approach was developed quite independently by Arena, Bailey et al [7–12]. In their XDMR experiments, the pumping frequency was systematically selected as being a low-order harmonic of the RF signal at the Advanced Photon Source at Argonne National Laboratory (USA) so that the XMCD signal could be directly sampled stroboscopically by the x-ray pulses. High-quality XDMR spectra were apparently recorded in this way, but mostly in the soft X-range where XMCD signals turn out to be rather large.
2.4. Vector detection of XDMR spectra
Whereas any information on the phase of the precessing magnetization component is definitely lost in XDMR experiments carried out in LOD geometry, XDMR experiments performed in TRD geometry let us benefit from the great advantage that one can compare the phases of two resonant lines recorded under strictly identical conditions. This, however, requires a careful vector analysis of the corresponding XDMR signals. At this stage, it is essential to realize that the phase information is preserved in the heterodyne detection, which is basically a translation in the frequency domain. Thus, all that we need to do is to carry out a vector decomposition of the XDMR signal at the beating frequency (IF) on an orthogonal basis that consists of two reference signals oscillating in phase and quadrature at frequency IF. It is precisely the role of a microwave IQ mixer (labeled 1 in figure 2) to provide us with such ultrastable references. Two RF mixers (labeled 1 and 2 in figure 2) make such a vector decomposition possible. Actually, our superheterodyne detection adds one more translation in the frequency domain and the final phase determination is ultimately carried out at the modulation frequency (Fbpsk) using two separate channels of the multichannel vector signal analyzer (VSA) operated in a standard time-average mode.
Under the conditions of magnetic resonance, the signal intensities of the IQ channels, formally ascribed to the real (Re) and imaginary (Im) parts of a complex signal, can be properly recombined in order to recover the true profiles of the absorptive and dispersive components of a resonant complex susceptibility. Throughout this paper, we shall make use of the usual criterion that, at resonance (Φ = 0), the dispersive lineshape should cross the zero axis while the absorptive lineshape should reach its maximum. In particular, we would like to compare the phase shifts (ΔΦ) associated with XDMR spectra recorded at various sites. On the other hand, let us recall that two magnetic modes featuring opposite precession helicities should exhibit identical absorptive lineshapes but inverted dispersive lineshapes: this is a direct consequence of the even (odd) parity of the absorptive (dispersive) part of the complex resonant susceptibility with respect to the angular precession frequency (ω).
2.5. Upgrade of the XDMR spectrometer
We would like to highlight here further efforts made to upgrade the performance of the XDMR spectrometer that was described in previous works [4, 5]. As shown in figure 2, we inserted a second quadrature (IQ) microwave mixer on the exit port of the microwave circulator. This rather simple modification now allows us to perform vector analyses of both XDMR and FMR spectra recorded under strictly identical conditions. This is essential if one wishes to access phase-shifts between XDMR and FMR spectra. The key to such an advanced option lies indeed in the capability of operating the high-performance vector spectrum analyzer (VSA 89600-S, Agilent Technology Inc.) in a fully synchronous multichannel mode.
There is another critical point which concerns the design of tunable microwave cavities optimized for XDMR experiments in TRD geometry. As illustrated in figure 3, the rectangular cavity operated in the TE102 mode was split into three parts: in addition to the fixed central part (in which the sample is inserted), two sliding parts that move in opposite directions render a small adjustment of the cavity length possible. It is well documented in old textbooks [34] that only a minor perturbation of the cavity Q factor is to be expected when the length of the moving parts is close to λg/4, λg being the standard notation for the wavelength inside the rectangular waveguide sections. A high-precision translation stage (Schneeberger) was used to make the displacements very accurate and highly reproducible. This new cavity also benefits from the design of a semi-automated Gordon coupler which allows us to freely vary the coupling of the cavity over a wider range [35]: in practice, this turned out to be very helpful in recording XDMR spectra of YIG thin films which exhibit extremely narrow resonance lines and for which large overcoupling proved to be preferable. At critical coupling, a loaded Q-factor (QL) in excess of 3000 was measured with such a tunable cavity. As suggested by figure 3, the cavity is inserted inside a non-magnetic vacuum chamber that fits perfectly into the magnetic gap of the Bruker BE 15V electromagnet.

Figure 3. Conceptual design of the new X-band microwave (MW) resonant cavity used for XDMR experiments in TRD geometry. The central part (labeled 1) of the rectangular cavity is kept fixed; the length of the cavity can be adjusted by translating the sliding parts (labeled 2 and 3) in opposite directions until resonance of the TE102 mode is achieved. The semiautomated Gordon coupler makes it possible to operate the cavity in either the overcoupling or the critical coupling mode. A thin beryllium (Be) window that is totally transparent to the x-ray fluorescence photons ensures the electrical continuity inside the cavity and prevents the microwave from perturbing the photodiode located outside the cavity. The direction of the external magnetic field B0 is normal to the Be window and to the photodiode.
Download figure:
Standard imageThe sample is glued at the extremity of a lossless sample holder made of a sapphire rod (Ø = 4.5 mm) carefully pre-machined in order to avoid any unwanted tilt of the magnetic film or disc-shaped GdIG platelet. A translation of the sapphire rod along the vertical (Y ) axis makes it easy to insert (remove) the sample into (from) the cavity. Since the sapphire rod is itself attached to the cold finger of a constant flow helium cryostat, there is a possibility to cool the sample down to very low temperatures (T ≃ 20 K), at least when the microwave pumping power is kept below 1 mW.
X-ray fluorescence photons are collected over a wide solid angle through a well-polished, (metallic) beryllium window (Ø = 31 mm; thickness: 25 μm) that preserves the electrical continuity inside the cavity but also prevents any leak of microwave radiation from perturbing the x-ray photodiode located outside the cavity. Recall that XDMR experiments in TRD geometry require fast photodiodes featuring a large active area (300 mm2): special photodiodes were carefully optimized for such a highly demanding application [36]. The benefit of using a tunable microwave cavity becomes immediately obvious if one keeps in mind that the bandpass of the photodiode and preamplifier assembly is restricted to about 2 MHz. Even though the magnetic bias field (H0) is always directed along the normal to the beryllium window and to the photodiode, its orientation with respect to the sample can be accurately adjusted by a rotation (βY ) of the sample around the vertical axis as sketched in figure 3. Whereas the sample can be freely rotated in a conventional FMR experiment, XDMR experiments in TRD geometry are most conveniently performed with θH = −βY ≃ 45°, θH denoting the polar angle of the magnetic bias field in the rotating frame (x1; y; z1) of figure 3. Note that the sensitivity of the XDMR experiments in TRD geometry is getting rather poor for either βY = 90° (in plane magnetization but grazing incidence of the incident x-ray photons) or βY = 0° (perpendicular magnetization but restricted solid angle for the detection of x-ray fluorescence photons).
3. XDMR spectra of the yttrium iron garnet (YIG) and Y–La–LuIG thin films
3.1. YIG film 1
XDMR spectra of high quality have been recorded in TRD geometry on YIG film 1 [6]. The spectra reproduced in figure 4 were obtained for a microwave pumping power as low as 1 mW. For this experiment, the microwave pumping frequency was Fp = 8452 MHz, the beating frequency with the LO at frequency 24 × RF being thus: IF = 856.4 kHz. The phase modulation frequency Fbpsk = 2.6948 kHz was selected as being a very-low-order sub-harmonic of the RF frequency: Fbpsk = RF/(31 × 31 × 17 × 8). The VSA triggering frequency was even lower: FTrigger = Fbpsk/16. Recall that the energy of the CP x-ray photons was tuned to the maximum of the Fe K-edge XMCD spectrum (E1 = 7113.91 eV) and that the film was rotated by βY ≃ 42° in order to minimize the demagnetizing field anisotropy. Under such conditions, the XDMR peak intensity was found to increase linearly with the square root of the pumping power up to about 10 mW [5, 6].

Figure 4. (A) FMR and XDMR PSD spectra of film 1 recorded under a pumping power of only 1 mW: recall that the two spectra were measured simultaneously. Note that the two spectra clearly exhibit fairly different and distorted lineshapes for the main resonance assigned to the uniform mode. Strong magnetostatic modes (BMSW) only show up in the FMR spectrum. (B) Complex vector analysis of the XDMR spectrum of film 1 recorded in TRD geometry under a pumping power of 1 mW. Arrows point to very weak satellite resonances tentatively assigned to magnetostatic modes.
Download figure:
Standard imageIn figure 4(A), we compare first the FMR and XDMR power spectral density (PSD) spectra that were recorded simultaneously. It is quite obvious that the intensity of the sharp BMSW modes is much stronger in the FMR PSD spectrum than in XDMR. It also appears that the two PSD spectra do not peak at the same resonance field and have different lineshapes. No definitive explanation can yet be given for such differences. One might argue, for instance, that it cannot yet be taken for granted that there is no small tilt angle between the true precession axes of the spin and orbital magnetization components at the tetrahedral (24d) iron sites. More generally, as pointed out by several authors [37, 38], one may also question how far is it legitimate to systematically reduce the 20 sublattices of YIG to only two rigidly coupled iron sublattices and to neglect the thermal excitation of magnetoelastic modes that may not affect sites of different symmetries in the same way.
Since the experiment was performed in TRD geometry, a complex vector analysis allowed us to recover some phase information. This is illustrated with figure 4(B) in which the absorptive (χ'') and dispersive (χ') XDMR components of film 1 can be identified with the real and imaginary parts of the vector detection scheme. A small (instrumentation-dependent) phase-shift (ΔΦ ≃ 6°) was added in order to let χ' pass through zero when χ'' is maximum as well as |XDMR|.
Arrows in figures 4 point to very weak satellite resonances that could possibly be assigned to magnetostatic spin waves. As reported elsewhere [5], those signatures grow rapidly with the microwave pumping power. This supports our view that, locally, the orbital magnetization components M(ℓ) couple to nonuniform magnetostatic spin waves through dipole–dipole interactions. However, we have also pointed out the reasons that made us expect the relative amplitude of the forward/backward MSW satellites to be much weaker in XDMR than in conventional FMR spectra. Recall that there is no chance to excite and detect standing waves resonances associated with magnetostatic modes unless there is a net transverse magnetization component interacting with both the microwave pump field and the CP x-rays: in the YIG thin film 1, this can be envisaged only for standing waves of rather low order and featuring an odd number of semiperiods [39].
3.2. Y–La–LuIG film 2
A priori, one would guess that the XDMR spectra recorded at the Fe K-edge should look fairly similar for films 1 (YIG) and 2 (Y–La–LuiIG). In reality, we had some reasons to be suspicious because previous XDMR spectra recorded on film 2 in LOD geometry already led to puzzling results [5, 6] when we tried to evaluate the precession cone angle (θ0) using equation (5):
- (i)From XDMR measurements carried out at the Fe K-edge with the bias field normal to the film, we found that the apparent precession cone angles of the orbital magnetization components were much larger for film 2 (θ0[Fe] ≃ 13–19°) than for film 1 (θ0[Fe] ≃ 7.2°).
- (ii)For film 2, the opening cone angle of the orbital components precessing at the iron
 sites would also largely exceed the opening cone angle of the spin components precessing at the lanthanum sites (θ0[La] ≃ 4.7°).


It should be kept in mind, however, that XDMR experiments carried out in LOD geometry require a high pumping power (630 mW). It was therefore our interpretation that many of these unexpected results could be caused by nonlinear processes. For example, Suhl's second-order instability process is typically associated with a four-magnon scattering process in which two uniform magnons were annihilated whereas two non-uniform magnons were created [40, 41]. In this respect, XDMR experiments carried out in TRD geometry benefit from a higher sensitivity so that, in principle, one may hope to lower the pumping power. Moreover, we already emphasized elsewhere that rotating the film by 45° could help considerably in minimizing the foldover lineshape distortions [5]. Unfortunately, due to a much stronger reabsorption of the x-ray fluorescence photons in film 2, we could not preserve the same signal-to-noise ratio as for film 1 without increasing the pumping power by nearly one order of magnitude. As a preamble to any discussion of the XDMR spectra collected in TRD geometry on the Y–La–LuIG film 2, we would like to insist that the operating conditions were pretty much the same as for the previous experiments on film 1: Fp = 8 453.7 MHz; IF = 843.6 kHz; Fbpsk = RF/(31 × 27 × 16 × 7) = 3.757 07 kHz; FTrigger = Fbpsk/12.
3.2.1. Fe K-edge XDMR spectra
We have regrouped in figure 5(A) a whole series of XDMR spectra of film 2 recorded under pumping powers ranging from 99 mW up to 378 mW. More precisely, we compare in figure 5(A) the XDMR PSDs with the PSD of the microwave absorption measured simultaneously during the same scan. It is immediately seen that the peak intensity of the XDMR spectra never coincides with the maximum absorption of the foldover distorted FMR line. We would like to draw attention, however, to the quite remarkable splitting of the XDMR lines at low pumping power. This is particularly obvious in figure 5(A)(a) in which the XDMR spectrum (pumping power: 99 mW) exhibits a very sharp signal (labeled 1) peaking at 2891.6 Oe together with a series of well-resolved low-field satellites (marked with arrows) that we tentatively assigned to magnetostatic modes. Note that the linewidth of the latter sharp XDMR signal does not exceed 6 Oe whereas the foldover distorted FMR line is considerably broader. Quite remarkable is also the existence of another sharp signal (labeled 2) peaking at 2915.3 Oe, i.e. very close to the foldover jump of the FMR line. Note that peaks 1 and 2 get slightly shifted toward higher fields in figure 5(A)(b) but remain well resolved, whereas peaks 1 and 2 finally merge together into a broad signal in figure 5(A)(c).
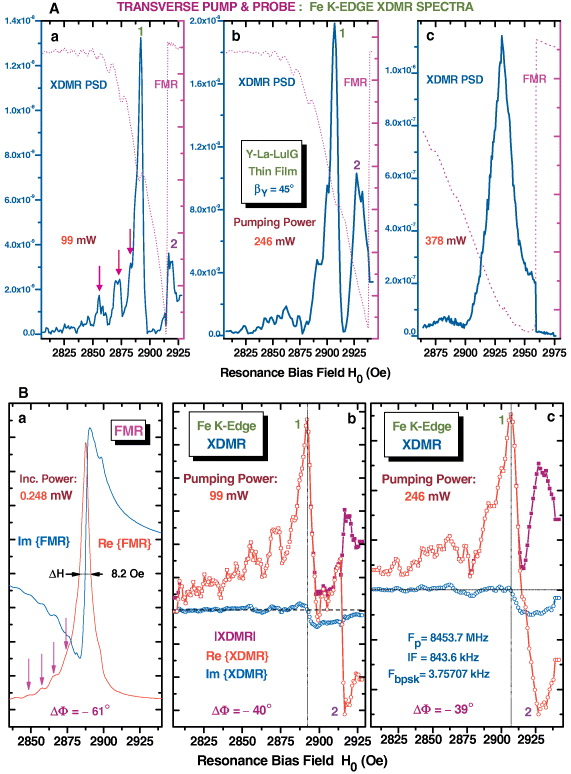
Figure 5. (A) Comparison of FMR and XDMR PSD spectra simultaneously recorded under increasing pumping power of 99 mW (a), 246 mW (b) and 378 mW (c). Note that the peak intensity of the XDMR spectra never coincides with the maximum absorption of the foldover distorted FMR lines. Arrows in figure 5(A)(a) point to weak satellite resonances again assigned to magnetostatic modes. (B) Vector analyses of FMR and Fe K-edge XDMR spectra of film 2. The reference FMR spectra (a) were measured under very low incident powers of 0.248 mW, whereas the XDMR spectra were recorded under a pumping power of 99 mW (b) and 246 mW (c), respectively. The XDMR phase shifts (ΔΦ ≃ − 40°) are pretty much the same. Two well-resolved lines (labeled 1 and 2) contribute to Re{XDMR} but with opposite signs.
Download figure:
Standard imageWe have reproduced in figures 5(B)(b) and (B)(c) the vector analyses of the Fe K-edge XDMR spectra recorded under pumping powers of 99 and 246 mW, respectively. For the sake of comparison, we included in figure 5(B)(a) the vector analysis of the FMR line of film 2 measured in the same geometry but at a much lower pumping power (0.248 mW). As anticipated, the vector component Re [XDMR] reproduced in figure 5(B)(b) is peaking at 2891.6 Oe (peak 1), i.e. very near the resonance field (2887.8 Oe) of the FMR line shown in figure 5(B)(a). Note that the dispersion spectra associated with Im [XDMR] are rather weak. The relative phase shifts ΔΦ obtained for peak 1 do not seem to vary significantly with the pumping power as long as the two lines are well resolved. Given that peaks 1 and 2 are no longer resolved in figure 5(A)(c), it is not really surprising that vector analyses of the experiment performed under a pumping power of 378 mW yield a meaningless phase shift (ΔΦ = + 53°). On the other hand, it is worth underlining here that there should be a phase difference approaching 180° between peaks 1 and 2.
3.2.2. La L3-edge XDMR spectra
XDMR experiments were also performed on film 2 at the La L3-edge, but only for pumping powers of 246 and 378 mW: unfortunately, not enough beamtime was left available to carry out a similar experiment at low pumping power (99 mW), i.e. under conditions where the resonance lines could have been better resolved. We have regrouped in figures 6(A) the PSD spectra recorded under pumping powers of 246 mW (a) and 378 mW (b), respectively. If one compares figures 5(A) and 6(B), it immediately appears that the XDMR spectra recorded at the La L3-edge look different from the spectra recorded under identical conditions at the Fe K-edge. In order to make such differences more directly perceptible, arrows were added in figures 6(A) which refer to the resonance fields of peaks 1 and 2 in the Fe K-edge XDMR PSD spectra. Whereas peak 1 had been found to largely dominate the Fe K-edge XDMR spectra at low pumping power, it would contribute at best to a weak structure in figure 6(A)(a). The signal labeled 2 looks now much more intense, whereas additional signatures tentatively labeled 3 or 4 grow at higher fields, i.e. very close to the foldover jump of the microwave absorption PSD spectrum. Vector analyses of the latter XDMR experiments performed at the La L3-edge are also reproduced in figure 6(B). The individual adjustment of the phase shifts ultimately converged to values that are fairly close to each other (figure 6(B)(a): ΔΦ = + 132°; figure 6(B)(b): ΔΦ = + 135°) but differ by about 171–174° from the typical phase shifts previously obtained for the Fe K-edge spectra. Note that in figure 6(B)(a), the signal tentatively assigned to peak 1 still exhibits a negative contribution to the vector component Re [XDMR] just as expected. This is obviously no longer the case at high pumping power (378 mW), where the absorptive part of the spectrum (Re [XDMR]) starts looking like a foldover distorted line. Whereas the dispersive part of the spectrum (Im [XDMR]) has only a weak contribution in figure 6(B)(a), its contribution becomes much stronger and highly structured at high pumping power. As discussed in much more detail in the next section, this could be a valuable indication that nonlinear four-magnon scattering processes start perturbing the resonant precession.

Figure 6. (A) Comparison of the FMR and La L3 XDMR PSD spectra measured simultaneously for pumping powers of 246 mW (a) and 378 mW (b), respectively. Arrows labeled 1 and 2 refer to the resonance fields previously measured at the Fe K-edge; arrows labeled 3 or 4 point to new features. (B) Vector analyses of the XDMR experiments at the La L3-edge. The corresponding phase shifts (a: ΔΦ = 132°; b: ΔΦ = + 135°) differ by 171–174° from the typical value of ΔΦ = −39° found at the Fe K-edge. In figure 6(B)(b), Re [XDMR] starts looking like a foldover lineshape, whereas the large contribution of Im [XDMR] could be typical of a nonlinear instability or saturation process.
Download figure:
Standard imageAt this stage, we would like to summarize below a few points that definitely call for more discussion in section 5: (i) the differences between the FMR and XDMR PSD spectra are considerably more marked for film 2 (Y–La–LuIG) than for film 1 (YIG); (ii) in addition to the uniform mode which contributes to a surprisingly narrow resonance line (peak 1) in the Fe XDMR spectra, there is another well-resolved signal peaking at higher field (peak 2) and which we did not observe in YIG; (iii) this additional mode, which dominates over the uniform mode at the La L3-edge, is clearly in antiphase with the latter. Recall that XDMR experiments performed at the La L-edges essentially probe the precession of (induced) spin components which may well couple by exchange to the spins located at the tetrahedral ( ) or octahedral (
 ) sites of iron. Indeed, one should expect the latter coupling to be much stronger in the case of GdIG, which is considered in the next section.
4. XDMR spectra of gadolinium iron garnet
4.1. XDMR spectra near the Gd ordering temperature TB
Indeed, one may anticipate that the replacement of all diamagnetic Y3+ cations with paramagnetic Gd3+ (8S7/2) cations in the dodecahedral (24c) sites should cause a much more severe perturbation than that which resulted from a partial substitution with La3+ or Lu3+ in film 2. In particular, we found it attractive to check whether a similar line splitting could be observed (or be even enhanced) in site-selective XDMR spectra of GdIG. We would like to show in this section that this seems to be the case but only in a restricted temperature range. On the other hand, it should be kept in mind that our previous attempts to record XDMR spectra at the Gd L2-edge either failed or resulted in very noisy spectra [4]. What makes XDMR experiments at the Gd L2-edge rather challenging is the poor signal-to-noise ratio, which results from the contamination of the XMCD signal by a large and noisy background at photon energies slightly exceeding the Fe K-edge and Gd L3 edge. We tried to compensate for such a loss of sensitivity by increasing the microwave pumping power up to 650 mW. Unfortunately, under such a high pumping power, we failed to cool the sample below 100 K and there is some doubt left regarding the true temperature of the sample when the temperature monitoring of the cold finger was set to 100 K. This resulted in a severe limitation owing to the fact that the gadolinium ordering temperature in GdIG was reported to be in the following range [32]: 69 K ⩽ TB ⩽ 100 K.
In figures 7(A), we compare the microwave absorption (a) and Gd L2-edge XDMR (b) PSD spectra recorded simultaneously at T ≃ 100 K on sample 3, i.e. a disc-shaped, thin single crystal of GdIG. The microwave absorption (a) and Fe K-edge XDMR (b) PSD spectra recorded under strictly identical conditions are also reproduced in figure 7(B). For completeness, vector analyses of the latter experiments are displayed in figures 7(C)(a,b) and (D)(a,b), respectively. All XDMR spectra reproduced in figure 7 were recorded under the following operating conditions: Fp = 8452.15 MHz; IF = 706.4 kHz; Fbpsk = 3.757 18 kHz; FTrigger = 313.0885 Hz.

Figure 7. Comparison of the XDMR PSD spectra recorded at either the Gd L2 edge (figure (A)(b)) or the Fe K-edge (figure(B)(b)) with the relevant FMR PSD spectra (figures(A)(a) and (B)(a)) recorded under strictly identical conditions (100 K < T ≃ TB < Tcp). Note the rather unexpected splitting of the Gd L2 edge XDMR spectrum in several resonance lines, two of them (labeled 1 and 2) being well resolved and of comparable intensity. The Fe K-edge XDMR spectrum also splits into several lines but is largely dominated by the high field resonance (labeled 2). Vector decompositions of the same spectra are displayed in figures (C)(a, b) and (D)(a, b). Whereas the FMR and Gd L2 edge XDMR spectra can be analyzed with the same phase shift, this is surely not the case for the Fe K-edge XDMR spectra.
Download figure:
Standard imageMost spectacular is the splitting of the XDMR PSD spectrum into several resonance lines in figure 7(A)(b): two of them, which peak at HR(1) = 2827 Oe and HR(2) = 3108 Oe, respectively, are not only well resolved but also of comparable intensity. There might be a third resonance (labeled 1s) contributing to a weak shoulder at about 2981 Oe. As illustrated in figures 7(C), the two intense lines, i.e. HR(1) and HR(2), can be reasonably well analyzed with the same phase shift (ΔΦ = −15.5°) as the FMR line. The linewidths of those two lines, as estimated from the XDMR PSD spectrum, should be of the order of ΔH1 = 70 Oe and ΔH2 = 80 Oe, respectively, the line splitting being as large as δH = 281 Oe.
The XDMR PSD spectrum recorded at the Fe K-edge (figure 7(B)(b) similarly splits into several resolved resonance lines which, however, peak at slightly higher fields than in the Gd XDMR PSD spectrum: HR(1) = 2848 Oe, HR(2) = 3148 Oe and HR(1s) = 2945 Oe. There could be an additional shoulder at HR(2s) = 3283 Oe. Let us emphasize that the resonance lines labeled 1 and 1s are considerably weaker than the resonance line labeled 2, which exhibits a narrow linewidth (ΔH = 80 Oe) and largely dominates the XDMR spectra recorded at the Fe K-edge. On the other hand, it appears from figures 7(D) that vector analyses of the FMR and Fe K-edge XDMR spectra require phase shifts (ΔΦ) that are significantly different. Moreover, it looks like the resonances labeled 1 and 2 would now contribute to signatures with opposite signs in the dispersive spectral component Im [XDMR]: this might indicate that the relevant magnetization vectors could precess with opposite angular velocities.
The narrow linewidths of the XDMR signatures support our guess that the experiments were performed only slightly above the Gd ordering temperature (TB): following Belov [32], the gadolinium sublattice might thus be in a so-called exchange-enhanced paramagnetic regime in which the resonance lines could undergo some exchange-narrowing effect. What causes the peculiarity of this regime is that exchange should be dominated by intersublattice interactions which are strongly site-selective: molecular field predictions [42] as well as NMR experiments [43, 44] on GdIG let us expect the exchange integral between the tetrahedral
d-sites of iron ( ) and the dodecahedral c-sites of gadolinium (
 ) to be considerably smaller (Jdc ≃ − 4 K) than the exchange integral between the octahedral a-sites (
 ) and the tetrahedral d-sites (
 ) of iron (Jad ≃ − 36 K); however, Jdc itself would be one order of magnitude larger than the exchange integral between the octahedral (
 ) a-sites of iron (Jac ≃ − 0.3 K) and the c-sites of gadolinium. Recall that the exchange integral between the gadolinium sites (Jcc ≃ − 0.13 K) should be even smaller, as inferred from Mössbauer spectroscopy [45]. This appears a propitious situation for the excitation of non-uniform precession modes subject to unequal anisotropy fields: it is our interpretation that this is the primary cause of the line splitting of the Gd L2-edge XDMR spectra. A priori, it seems natural to envisage that the line labeled 1, which is slightly more intense and exhibits the narrowest linewidth, could be assigned to gadolinium sites that would be more strongly exchange coupled to the iron d-sites. A very preliminary test experiment tentatively carried out at lower temperature under lower pumping power (35 mW) would suggest that the XDMR line would shift down toward even lower resonance fields, just like the microwave absorption PSD spectrum.
Whereas the XDMR experiments performed at the Gd L-edge probe essentially the precession of spin magnetization components that directly experience exchange interactions, one would expect the XDMR spectra recorded at the Fe K-edge to look different for two reasons: (i) the precessing magnetization components being of orbital nature are not intrinsically affected by exchange interactions; (ii) the iron d-sites ( ) should contribute to much larger XDMR signatures than the a-sites (
 ) as a consequence of the site selectivity illustrated in figure 1(A). Regarding exchange, the reality is, however, more subtle since most of the XDMR signal arises from spin–orbit interactions which implicitly are affected by exchange through the relevant spin component. It is therefore tempting to assign the strong peak labeled 2 in figure 7(B)(b) mostly to orbital components precessing at the tetrahedral d-sites of iron and that would be indirectly coupled by exchange and spin–orbit interactions with the gadolinium c-sites. The assignment of the much weaker signatures labeled 1 and 1s in figure 7(B)(b) is more ambiguous: our guess is that those lines might possibly be assigned to iron sites that would be weakly coupled (or even uncoupled) to the gadolinium sites: indeed, this includes iron ions in octahedral a-sites that should be poorly coupled by exchange interactions to the gadolinium sites, and which would contribute to only very weak XDMR signatures through electric quadrupole (E2) allowed transitions. Let us stress that, regarding XDMR experiments carried out at the Fe K-edge, there is actually no chance to pick up a signal from the octahedral (
 ) coordination sites of iron unless the magnetic resonances of the
  and
and  sites are fully resolved: this is totally hopeless in the case of YIG films, but this could become possible near or below the ordering temperature TB of GdIG if the exchange interactions between the gadolinium c-sites and iron d-sites turn out to be strong enough to cause the excitation of a non-uniform mode subject to a strongly perturbed anisotropy field. In such a case, the broad band encompassing the weak signatures labeled 1 and 1s in figure 7(B)(b) might well be assigned to contributions of the octahedral (
 ) coordination sites of iron.
If the latter picture holds true, we would face a totally unanticipated situation where the resonance line labeled 1 in the Gd L2-edge XDMR spectrum and the resonance line labeled 2 in the Fe K-edge XDMR spectrum would correspond to cross-coupled sites. This could be the case if the spins located at the gadolinium in  sites and the orbital magnetization components located at the iron
  sites would precess around slightly tilted axes. This may happen if the anisotropy fields are significantly different at the gadolinium and iron sites. On the other hand, our interpretation is supported by the rather similar lineshapes of the whole bands [1 + 1s] in figure 7(A)(b) and [2 + 2s] in figure 7(B)(b). In contrast, one would certainly expect the somewhat broader resonance labeled 2 in figure 7(A)(b) to be much more intense than the weak signatures labeled [1 + 1s] in figure 7(B)(b) because the spectroscopic selection rules at the Gd L-edges do not cause any difference between gadolinium c-sites coupled with iron d- and a-sites.
4.2. Saturation of XDMR spectra above Tcp
We have reproduced in figures 8(A) standard PSD analyses of the Fe K-edge XDMR spectra measured in TRD geometry with sample 3. Vector analyses of the same data are displayed in figure 8(B). It was our initial goal to compare XDMR spectra recorded either below the compensation point, e.g. at T ≃ 150 K < Tcp = 290 K (figures 8(a)), and above the compensation point, e.g. at T = 450 K > Tcp (figures 8(A)(b) and (B) (b). Indeed, the microwave pumping conditions were kept strictly identical for both experiments. Obviously, the two sets of XDMR spectra are fairly different: everything looks like we had either some kind of saturation or a splitting of the XDMR PSD spectrum at high temperature (450 K). With FMR linewidths in excess of 200 Oe, the pumping power could be increased up to 500 mW (or even higher) without any detectable foldover lineshape distortion. Note that these experiments were performed with a rather high BPSK modulation frequency: Fp = 8452.3 MHz; IF = 556.4 kHz; Fbpsk = RF/(34 × 32 × 3 × 2) = 53.9525 kHz; FTrigger = Fbpsk/(9 × 31) = 193.378 Hz.

Figure 8. (A) Fe K-edge XDMR PSD spectra recorded in TRD geometry for a thin, disc-shaped single crystal of GdIG : (a) below the compensation point, i.e. at T ≃ 150 K < Tcp = 290 K; (b) above the compensation point, i.e. at T = 450 K > Tcp. The microwave absorption PSD spectra that were recorded simultaneously are also reproduced for the sake of comparison. All scaling factors were kept identical for figures (a) and (b). (B) Vector analyses of the Fe K-edge XDMR spectra. Note the strongly distorted lineshapes of the XDMR PSD or modulus spectra recorded at 450 K: this is clearly correlated with a vanishing contribution of the absorptive component Re [XDMR].
Download figure:
Standard imageSince our primary motivation was to look for an eventual change of the precession helicity at high temperature, we paid much attention to properly recovering the phase information. The phase shifts (ΔΦ) derived from the vector analyses were determined according to strictly identical criteria: we assumed that the imaginary (dispersive) part of the XDMR spectrum had to pass through zero at resonance, whereas the real (absorptive) part should remain positive over most of the resonance spectral range. This required us to vary ΔΦ from +15° to −177° in the vector analyses displayed in figure 8(B). Recall that two modes with inverted precession helicities should differ by the sign of the time-reversal odd dispersive part (Im XDMR), the sign of the time-reversal even part (Re XDMR) remaining unchanged. A puzzling problem with figure 8(B) is that a variation of ΔΦ close to 180° implies that both Im XDMR and Re XDMR changed sign. Moreover, at T = 450 K, the contribution of the absorptive part (Re XDMR) is getting anomalously weak with the typical consequence that the modulus (|XDMR|) and XDMR PSD spectra become largely dominated by the contribution of the dispersive part (Im XDMR). Interestingly, the microwave absorption PSD spectrum measured at T = 450 K is clearly much weaker than the corresponding PSD spectrum measured at low temperature (T ≃ 150 K).
Such unexpected results did call for investigations, which, unfortunately, could only be performed one year later but with the same sample in the same geometry. We decided to concentrate our efforts on high-temperature measurements (T > Tcp) in order to make sure that the previous experiments were fully reproducible and to clarify the eventual role of various parameters such as the microwave pumping power or the sample temperature. We deliberately kept strictly the same experimental conditions affecting the detection sensitivity: Fp = 8452.3 MHz; IF = 556.4 kHz; Fbpsk = 53.9525 kHz; FTrigger = 193.378 Hz. The results are shown in figure 9.

Figure 9. (A) Comparison of the whole series of FMR and Fe K-edge XDMR PSD spectra recorded with the same disc-shaped GdIG single crystal. All XDMR experiments were systematically carried out above the compensation temperature: (i) at T = 450 K under pumping powers of 67.5 mW (a), 244 mW (b) and 929 mW (c); (ii) at T = 510 K under a pumping power of 240 mW (d). Everything looks like the XDMR spectra would undergo a peculiar saturation effect at pumping powers in excess of 150 mW. (B) Vector analyses of the previous Fe K-edge XDMR spectra. Note the inverted signs of all dispersive components Im [XDMR] with respect to figure 7(B)(b).
Download figure:
Standard imageIn figure 9(A), we compare the whole series of Fe K-edge XDMR PSD spectra recorded: (i) at T = 450 K under pumping powers of 67.5 mW (a), 244 mW (b) and 929 mW (c); (ii) at T = 510 K under a pumping power of 240 mW (d). The XDMR PSD spectrum recorded at low microwave pumping power (67.5 mW) is the only one which does not show any anomaly: it consists of a rather sharp line with a typical linewidth of 86 Oe. Everything looks like the XDMR spectra measured under pumping powers exceeding 150 mW would undergo a peculiar saturation effect. Of course, we carefully checked that we could rule out any instrumental problem. There are clearly some differences between the XDMR PSD spectra displayed in figures 8(A)(b) and 9(A)(b) which refer to similar experimental conditions, but the key point is that both XDMR PSD spectra unambiguously exhibit quite a reproducible spectral distortion. Note that the corresponding spectral anomaly becomes much more spectacular at high pumping power (929 mW). A weaker effect still persists at high temperature (T = 510 K): it is our guess that a saturation effect as intense as the effect measured at 450 K would probably be observed at higher pumping power simply because the resonance inherently becomes weaker and much broader on approaching the Curie temperature.
Vector analyses are again displayed in figures 9(B) for the whole series of XDMR spectra. Note that the phase shift determined for the XDMR experiment carried out at low pumping power (ΔΦ ≃ − 72°) is only one half of the phase shifts (ΔΦ ≃ − 144°) found for all experiments performed under high pumping power and which exhibit characteristic spectral anomalies. In this respect, the vector analysis reproduced in figure 9(B)(c) looks most typical since it confirms our previous observation that the contribution of the absorptive component, i.e. Re [XDMR], tends to vanish. There is still another detail which we initially neglected but which calls for more attention in the future: this concerns the inverted signs of all dispersive components (Im [XDMR]) if one takes figure 8(B)(b) as reference. Whereas we kept the pumping frequency (Fp), the beating frequency (IF), the modulation frequency (Fbpsk) and the trigger frequency (FTrigger) all strictly identical for both sets of XDMR experiments, it is only much later that we realized that the small tuning mismatch (ΔF = Fcav − Fp) between the cavity resonance frequency (Fcav) and the pumping frequency has opposite signs for both sets of experiments: ΔF(2) = −0.3 MHz against ΔF(1) = + 0.5 MHz. It is clearly seen that comparing the phase information of different spectra is a risky exercise whenever the XDMR experiments are not conducted with strictly the same cavity tuning. For samples that are strongly dispersive such as the GdIG single crystal, one should also worry about eventual temperature drifts, especially over long data acquisition times. Such a small temperature drift might well explain the slow increase of ΔΦ quoted in figures 8(B)(b)–(d).
The key objective of this section is, indeed, to elucidate the origin of the spectral anomaly observed in the XDMR spectra recorded under high pumping power at T = 450 K or higher. It is our interpretation that it is the typical signature of a destructive interference between two resonant modes in which the magnetization vectors would precess out of phase and with opposite angular velocities. For simplicity, let us assume that the two modes can be represented with complex conjugated Lorentzian susceptibilities χ(±):

in which H0 is the scanned bias field, HR denotes the resonance field and 2α defines the resonance linewidth. If we further assume that there is a 180° phase-shift between the two precessing magnetization vectors, what should be probed by XMCD is then the complex vector difference:

Obviously, this describes a fully coherent interference process in which the real part of Δm should cancel out, whereas its imaginary part should be twice as large as the individual contribution of m. Note that this is precisely what should happen if one were to try probe with XDMR two non-uniform modes of opposite helicities and respectively associated with the wavevectors k and − k. This immediately reminds us that, at high pumping power, Suhl's famous second-order instability process is expected to annihilate two uniform magnons (k = 0) while creating a pair of non-uniform magnons with opposite wavevectors (k, − k) [40, 41]. Energy and momentum conservation implies that, in the latter nonlinear process, the non-uniform modes should have the same precession frequency as the uniform mode and opposite helicity [5, 6]. It is therefore our interpretation that the spectral anomaly observed in figures 8 and 9 is basically the typical signature of the four-magnon nonlinear interaction process that is usually regarded as the main source of saturation of the FMR spectra [41].
Of course, it would be totally unrealistic to expect complete annihilation of the uniform mode (m0) and what should be probed by XDMR is a signal resulting from the complex vector addition: (1 − β)m0 + βΔm. As illustrated by figure 10(A), this causes some imbalance between the magnetization vectors precessing with opposite angular velocities and leaves a residual contribution of Re XDMR. On the other hand, one should expect the non-uniform modes to have a much longer lifetime than the uniform mode: this point, which was recognized first by Schlömann [46], is relevant here since it contributes to lowering the weight of the uniform mode and thus, in fine, it should further reduce the residual contribution of Re XDMR.

Figure 10. Destructive interferences in XDMR: (A) Simulated XDMR spectra of two ferrimagnetically coupled sublattices with unequal magnetization undergoing coherent resonant precession with opposite precession velocities. (B) Simulated XDMR spectra when each interfering mode is further split into two partly resolved resonances, e.g. under the influence of some additional coupling. For the sake of illustration, we assumed Lorentzian resonance lineshapes, the resonance linewidth (ΔH) and the line splitting (δH) to be identical: ΔH = δH = 50 Oe.
Download figure:
Standard imageThese considerations provide us with a reasonable basis to explain the typical distortions which we noticed for the XDMR PSD (or modulus) spectra recorded under high pumping power. However, we have to admit that the rather crude model used to simulate the XDMR spectra shown in figure 10(A) fails to reproduce further structures that are nicely resolved in the vector analyses of the experimental XDMR spectra, e.g. in Re XDMR spectra. As illustrated in figure 10(B), the simulated XDMR spectra would better match the experimental reality if one further assumes that every resonance would split into two lines according to:  . The spectra reproduced in figure 10(B) were obtained under the assumption that the signal probed by XDMR would result from the extended vector sum: (1 − β)(m(1)0 + m(2)0) + β(Δm(1) + Δm(2)). Of course, it remains to be clarified what sort of interaction might cause such a splitting of the uniform mode. Dipole–dipole interactions that are at the origin of magnetostatic modes look like the best candidate even though interlattice exchange could still be envisaged.
5. Implications and conclusion
In this paper, we report on XDMR experiments carried out in the TRD mode with three different samples corresponding to increasing levels of complexity. In the case of the YIG film 1, sharp lines could be rather easily measured at the Fe K-edge, even under a pumping power as low as 1 mW. Once again, our experiments confirm that the satellite resonances that are commonly assigned to magnetostatic modes in the FMR spectra are only very weak in the XDMR spectra. Significant differences were noticed between XDMR and FMR spectra measured simultaneously at low pumping power: typically, the peak resonance fields (HR) and lineshapes were slightly different. At this stage, we have no firm interpretation for this experimental observation, and obviously, it would be premature to relate it to a small tilt angle that could possibly exist between the precession axes of spin and orbital magnetization components at the iron sites in YIG. On the other hand, let us insist that one should not take for granted that XDMR spectra recorded at the Y L-edges would peak at strictly the same resonance field (HR) as the XDMR spectra recorded at the Fe K-edge. Unfortunately, there is no hope as yet of recording XDMR spectra at Y L-edges under such a low pumping power.
High-quality XDMR spectra were also recorded at the Fe K-edge on the Y–La–LuIG film 2 but only under a much higher pumping power (99 mW). In these experiments, the differences between XDMR and FMR PSD spectra became much more spectacular. As opposed to the broad, foldover distorted lineshape of the microwave absorption PSD spectrum, the XDMR PSD spectrum was found to exhibit a very sharp and narrow line (ΔH ≃ 6 Oe) peaking at the typical resonance field of the uniform mode in FMR spectra recorded under very low pumping field. Satellite resonances of low-order magnetostatic modes turned out to be even better resolved than in FMR spectra. Most intriguing, however, was the presence of a well-resolved second resonance line shifted by +14 Oe and with about 180° inverted phase. XDMR spectra were also successfully recorded at the La L3-edge: in addition to the split resonance lines which already contributed to the Fe K-edge XDMR spectrum, we noticed the presence of new features peaking very close to the foldover jump of the FMR spectrum and which strongly depend on the pumping power. In contrast with what was observed at the Fe K-edge, the relative intensity of the high field signatures now largely exceeded the contribution of the pseudo uniform mode resonance. These results, which could hardly have been anticipated, raise at least two questions: (i) how is it possible to detect narrow lines in XDMR spectra while the microwave absorption spectrum measured simultaneously is so broad and foldover distorted? (ii) What is the origin of the additional signatures observed at high field?
In film 2, strong perturbations stem from the large size of the La3+ cations and from the small size of the Lu3+ cations which allow lutetium to partly replace iron in the octahedral sites [22, 30]. The non-uniform distribution of the RE cations induces fluctuations in the lattice parameter, i.e. dynamical strains and stresses resulting in the excitation of magneto-elastic waves [47]. This is supported by the much larger growth anisotropy of film 2 as compared to film 1. Such a large growth anisotropy incidentally enhances the probability of foldover distortions of the FMR lineshape at high pumping power. Lattice fluctuations also act as defects that strongly favor unwanted two-magnon scattering processes in which a uniform magnon is annihilated while a non-uniform magnon is created [41]. Two-magnon scattering processes have long been recognized to be a very efficient spin–spin relaxation mechanism affecting T2 in FMR [41, 48], but not T1. The Fe K-edge XDMR spectra carried out on film 2 would suggest that two-magnon scattering processes would poorly affect the relaxation of orbital magnetization components, which would remain primarily controlled by slow orbit–lattice relaxation mechanisms. A fairly different situation is expected for spin magnetization components, which play a key role in the XDMR experiments carried at the La L3-edge.
Since two-magnon processes are most often regarded as elastic scattering processes conserving energy, they cannot explain the excitation of additional, well-resolved resonance modes peaking at higher field. By analogy with the case of GdIG, we suspect that the XDMR spectra recorded at the La L3-edge could be dominated by the precession of spin components antiferromagnetically coupled to the spins located at the tetrahedral ( ) sites of iron. If this is true, then the spin components located at the lanthanum sites should thus precess in antiphase with both the spin and orbital magnetization components located at the iron d-sites. This seems to be supported by our XDMR spectra. It cannot be taken for granted, however, that the resonance fields should be strictly identical since the magnetic anisotropy could differ for both sublattices. Furthermore, exchange interactions may weakly couple in a slightly different way the lanthanum c-sites with either the d- or a-sites of iron: this may well cause the La L3-edge XDMR spectrum to split into two lines of unequal intensity with a probable imbalance in favor of the d-sites, but also with antiphase resonance given that the a- or d-sites of iron are inherently antiferromagnetically coupled. Conversely, the Fe K-edge XDMR spectra may split in the same way if dipole–dipole interactions couple the orbital magnetization components precessing at the tetrahedral (
 ) sites of iron with the spin components located at the lanthanum c-sites independently of which non-uniform precession mode is excited at those c-sites. Indeed, at very high pumping power, foldover lineshape distortion and further nonlinear processes (e.g. four-magnon scattering) would rapidly spoil any chance to resolve these modes.
From a technical point of view, the XDMR experiments carried out with the GdIG single crystal (sample 3) were particularly challenging owing to the broad linewidths of the resonance lines. Nevertheless, a number of subtle effects have been observed which nicely illustrate the potentiality of XDMR experiments. In this respect, experiments performed at low temperature (T ⩾ 100 K) but slightly above the gadolinium ordering temperature provided us with a unique opportunity to investigate what happens in the so-called exchange-enhanced paramagnetic regime in which exchange is dominated by intersublattice interactions that are inherently site-selective. A careful comparison of the XDMR spectra recorded successively at the Gd L2-edge and at the Fe K-edge revealed a similar splitting of the resonance lines which allowed us to resolve the large signal due to the tetrahedral ( ) iron sites that are strongly coupled to the gadolinium c-sites, from the weak contributions of the octahedral (
 ) iron sites which, in contrast, should be poorly coupled to the RE c-sites. Further work is in progress to check whether reliable quantitative information could be extracted from XDMR spectra concerning site-selective exchange integrals. If this turns out to be possible, one could extend such analyses to other REs, especially those with empty 4f shell (La, Lu and perhaps Y) for which no alternative source of experimental information is available.
At high temperature (T ⩾ 450 K), vector analyses of XDMR spectra recorded at the Fe K-edge under high pumping power produced the first experimental evidence of destructive interferences developing within the nonlinear four-magnon scattering process that is classically given as the main source of saturation of the FMR lines.
In conclusion, ample demonstration is made in this paper that XDMR should not be perceived as just another exotic, time-consuming method for replicating FMR spectra. Concrete examples are given that support our claim that site-selective XDMR experiments can yield a far more detailed picture of magnetic couplings and nonlinear mode interactions in complex ferrimagnetic systems than standard FMR. In this respect, XDMR offers a valuable complement to spin-echo NMR that, unfortunately, is restricted to ultra-low temperatures (T ⩽ 10 K).