
Abstract
There are few silicides that could be used for thermoelectric energy conversion, following higher silicides of transition metals: CrSi2, MnSi1.75, β-FeSi2, Ru2Si3, ReSi1.75, and solid solutions based on compounds of Mg2X (X = Si, Ge, and Sn). Some of them have very high figures of merit (ZT). It can be shown that, in some silicides, a high ZT is the result of energy spectrum optimization besides the decrease in thermal conductivity. This is very difficult to achieve in some materials, because the density of states is typically dependent only on the band structure of a material, for which there is no means to produce such a change. However, in solid solutions, if they have a special band structure of components, it is possible to alter the band structure to increase ZT.
Export citation and abstract BibTeX RIS
1. Introduction
The following silicides have favorable properties as thermoelectrics: CrSi2, MnSi1.75, β-FeSi2, Ru2Si3, ReSi1.75, and solid solutions based on compounds of Mg2X (X = Si, Ge, and Sn).1) They have energy gaps and melting temperatures suitable for mid-temperature-range thermoelectrics, the area with the highest potential for thermoelectric generators (Table I). The operation temperature range of mid-temperature-range thermoelectrics is 300–600 °C, which is the range for organic fuel burning.
Table I. Some parameters of silicides that could be used in thermoelectric devices.
| Compound | Tmelting (K) | Type | Eg (eV) | ZTmax | Ref. |
|---|---|---|---|---|---|
| Mg2Si | 1358 | n | 0.7 | 0.9 | 3 |
| Mg2Si–Mg2Sn | >1023 | n, p | 0.4–07 | 1.4 (n) 0.5 (p) | 4 5 |
| Mn4Si7 | 1430 | p | 0.66 | 0.9 | 6 |
| ReSi1.75 | 2213 | p | 0.15 | 0.8 | 7, 8 |
| Ru2Si3 | 1970 | n, p | 1.1 | 0.4 (n) 0.2 (p) | 9 10 |
| CrSi2 | 1763 | p | 0.4–0.7 | 0.25 | 11 |
| FeSi2 | 1490 | n, p | 0.87 | 0.4 (n) 0.2 (p) | 12 12 |
It is easy to show that the thermoelectric figure of merit ZT = TS2σ/κ is the square of the Seebeck coefficient (S) multiplied by electrical conductivity (σ) and divided by thermal conductivity (κ); the result is multiplied by absolute temperature (T). The Seebeck coefficient and electrical conductivity both depend on charge carrier density and cannot be simultaneously increased in a practical manner. There is an optimum charge carrier density that delivers the highest nominator (power factor) of the thermoelectric ZT. Only one parameter can be changed independently of charge carrier density: this is the thermal conductivity, which consists of two parts — phonons and electrons. These parts can be altered more or less independently. The method of preparing solid solutions allows essential reductions in thermal conductivity. In this method, the solution of two isovalent materials with the same crystal structure could be used to enhance phonon scattering, thereby reducing thermal conductivity. Maximizing ZT requires minimizing thermal conductivity.
At an optimal charge carrier density, maximum Z will depend on carrier mobility (u), effective mass of density of states (m*), and lattice thermal conductivity (κL) as

Since the phonon mean free path is larger than the electron, it is possible to some extent to reduce thermal conductivity without affecting carrier mobility and hence increasing u/κL ratio. Reference 2 shows that nanostructure samples have a higher ZT than classic ones. The last parameter, the effective mass of density states, depends on the band structure of the material and it is difficult to change. However, in some cases, it can be changed and the optimization of the band structure can result in a sufficiently high ZT notwithstanding the relatively high thermal conductivity of the crystal lattice.
Crystal structure parameters of silicides are shown in Table II. As the table shows only that Mg2Si has a cubic symmetry, all other thermoelectrics are higher silicides and have lower symmetries. Although they have different crystal structures, all these structures (except CrSi2) could be considered as various deformations of the tetragonal structure. Therefore, it is possible to find the anisotropy of transport properties in these materials.
Table II. Crystal structures of silicides.
| Material | Syngony | a (nm) | b (nm) | c (nm) | a0 | Ref. |
|---|---|---|---|---|---|---|
| CrSi2 | Hexagonal | 0.4431 | — | 0.6364 | — | 13, 14 |
| Mn4Si7 | Tetragonal | 0.5525 | — | 1.7463 | — | 15 |
| FeSi2 | Orthorhombic | 0.9863 | 0.7791 | 0.7833 | — | 16 |
| Ru2Si3 | Orthorhombic | 1.1074 | 0.8957 | 0.5533 | — | 17 |
| ReSi1.75 | Triclinic | 0.3138 | 0.3120 | 0.7670 | 89.9 | 18 |
| Mg2Si | Cubic | 0.6338 | — | — | — | 19 |
2. Magnesium silicide and its solid solution
Mg2Si belongs to compounds of group Mg2X (X = Si, Ge, and Sn). All these compounds crystallize with an antifluorite structure and a cubic symmetry.19) Mg2Si and Mg2Ge form continuous solid solutions,20) but the other two systems of alloys (Mg2Si–Mg2Sn and Mg2Ge–Mg2Sn) are characterized by peritectic reaction and limited regions of solid solution existence.21–23) It is possible to obtain peritectic region alloys if the formation of the liquid phase can be suppressed during synthesis.24) Some properties of Mg2X compounds are shown in Table III.
Table III. Properties of Mg2X compounds.25)
| Compound | Melting point (K) | Spacing (Å) | Density (g·cm−3) | Eg (0 K) (eV) | un (300 K) | up (cm2 V−1 s−1) | mn/m0 | mp/m0 |
|---|---|---|---|---|---|---|---|---|
| Mg2Si | 1375 | 6.338 | 1.88 | 0.77 | 405 | 65 | 0.50 | 0.9 |
| Mg2Ge | 1388 | 6.384 | 3.08 | 0.74 | 530 | 110 | 0.18 | 0.31 |
| Mg2Sn | 1051 | 6.765 | 3.59 | 0.35 | 320 | 260 | 1.2 | 1.3 |
Mg2Si heavily doped with Bi has ZT = 0.86 at 862 K.3) This high value can be explained by the two subbands in the conduction band, the high electron mobility, and the minimum conduction band at the X point of the Brillouin zone. All these parameters result in a high power factor. However, the thermal conductivity of simple compounds is very high for thermoelectrics. As mentioned above, magnesium silicide forms solid solutions. The strongest thermal conductivity reduction of almost threefold occurs in alloys already with 20% Mg2Sn.26) The thermal conductivity of Mg2SixSn1−x weakly depends on the composition at x from 0.2 to 0.8, i.e., in a wide range of solid solution compositions.
The temperature dependences of ZT for high electron carrier concentrations are shown in Fig. 1.27) The ZTs of Mg2Si0.6Sn0.4 and Mg2Si0.4Sn0.6 at high temperatures are similar, exceed unity, and are higher than that of Mg2Si. However, at low temperatures, the ZT of Mg2Si0.4Sn0.6 is higher than that of Mg2Si0.6Sn0.4. This means that average ZT is higher for the first one.
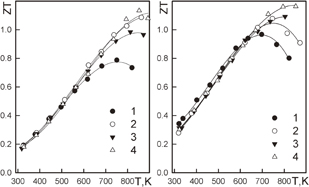
Fig. 1. Thermoelectric properties of the solid solutions Mg2Si0.6Sn0.4 (left) and Mg2Si0.4Sn0.6 (right). n, 1020 cm−3: (left) 1 — 3.17; 2 — 3.30; 3 — 3.83; 4 — 4.54. n, 1020 cm−3: (right) 1 — 2.31; 2 — 2.52; 3 — 2.99; 4 — 3.10.
Download figure:
Standard image High-resolution imageThis can be explained from the features of the band structures of Mg2Si and Mg2Sn compounds. It was noted that there is a nonlinear dependence of energy gap in the solid solution.28) In these compounds, conduction bands consist of two subbands with gaps of 0.2–0.5 eV. Calculation of these band structures showed that the conduction band minima in Mg2Si and Mg2Sn have different origins.29) The minimum in Mg2Si is formed by Si atom states and that in Mg2Sn is formed by Mg states. In a certain composition of a solid solution, the minima of these subbands have the same energy. From the point of view of thermoelectricity, such a situation is favorable, because the density of states increases without decreasing electron mobility.30) Such degeneration of subbands occurs at certain X and temperature; thus, this favorable situation is very limited. Calculations show a better situation when a heavy-electron subband lays higher.31) Another advantage of this material is the absence of interband scattering in these materials.32)
3. P-type magnesium stannide and its solid solution
It would be preferable when thermoelectric materials can be distinguished only by the type of conductivity. We shall consider now the thermoelectric properties of p-type materials based on the same solid solutions. As mentioned above, the high ZTs of n-type solid solutions are partly due to the features of the band structure, which provide optimal positions of the bands. P-type solid solutions do not provide such high ZTs. There are several factors for this. The hole mobility is lower than the electron mobility in all Mg2X compounds; hence, bipolar diffusions begin at temperatures lower than those in n-type alloys. The difference between hole and electron mobilities is small in Mg2Sn-rich solid solutions and the electron-to-hole mobility ratio is about 1.5. Therefore, the most effective composition of p-type solid solutions must consist mainly of Mg2Sn and have Mg2Si or Mg2Ge in order to reduce thermal conductivity and increase energy gap. In our opinion, the best solid solution that meets this requirement is Mg2Si0.3Sn0.7.33)
The valence band structure does not have any thermoelectric features. The maximum valance band is at the Γ point; thus, the inertial mass and mass of density of states are not different. The valence band has three subbands, one of which split owing to spin orbital interaction.34) This splitting widens with increasing atom mass. The third subband in Mg2Sn lies about 0.5 eV below the valence band maximum. In a Mg2Sn-rich solid solution, spin–orbit interaction split-off subbands exert influence only at high temperatures or high hole concentrations.
References 35–37 show that several impurities can yield the p-type. The most effective impurities are Ga and Li in Mg2Sn-rich solid solutions. Both of these dopants provide hole concentrations higher than 1020 cm−3. Our study shows that these impurities yield one hole per dopant atom up to 2.5% Ga and 1.5% Li, after that saturation occurs. However, in Ref. 5, a sample with 7% Li was prepared and a hole concentration of 4 · 1020 cm−3 was obtained. This heavily doped solid solution reaches a maximum ZT of 0.5 at 750 K (Fig. 2). Our samples do not have such a high hole concentration and do not reach a maximum ZT = 0.45 at 650 K. However, below this temperature, the properties of our samples show a ZT behavior similar to those in Ref. 5.
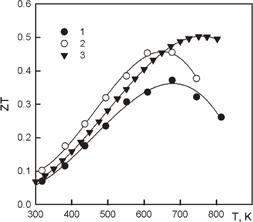
Fig. 2. Best ZT properties of p-type Mg2Si0.3Sn0.7 doped with Ga(1) and Li(2,3). 1 and 2 — our data;33) 3 — Ref. 5.
Download figure:
Standard image High-resolution image4. Higher manganese silicide
As considered in the previous section, solid solutions based on Mg2Si have high ZTs only for n-type materials, whereas the ZT of the p-type is relatively low. To make a silicide thermoelectric generator, the highly effective p-type material is necessary. The most suitable material is higher manganese silicide (HMS). Without any doping it has p-type conductivity with a high carrier concentration (up to 1021 cm−3). However, it has a very low hole mobility (∼10 cm2 V−1 s−1 at 300 K).
HMS has a very wide region of homogeneity with a number of crystal structures (MnSi1.7–1.75). All these structures can be described by the general formula MnnSi2n–m.
During directed crystallization, the second phase form precipitates. These precipitates do not destroy the "single-crystal structure". The precipitates are the planes oriented orthogonal to the tetragonal axis. This orientation leads to the strong anisotropy of thermoelectric properties in HMS.
Figure 3 shows the thermoelectric properties of HMS. The temperature dependence of the Seebeck coefficient and electrical conductivity for T > 100 K is typical for semiconductors with a small energy gap. There is peak for the Seebeck temperature dependence at T < 100 K. This is likely due to the contribution of the phonon-drag effect. The existence of the phonon-drag effect along only one direction could be associated with the features of the HMS crystal structure. As one can see in the figure, the anisotropic Seebeck coefficient changes sign at low temperatures.

Fig. 3. Temperature dependences of the Seebeck coefficient (S) and electrical (σ) and thermal conductivities (κ) of HMS. The directions are represented as follows: [100] (empty symbols) and [001] (filled symbols) in accordance to Ref. 38 (circles) and Ref. 39 (triangles). The dependences of κ ∼ T3 and κ ∼ 1/T are shown in solid lines.36)
Download figure:
Standard image High-resolution imageThe behavior of thermal conductivity in relation to temperature is not similar for normal single crystals. Thermal conductivity increases as κ ∼ T3, but the decrease is much weaker than κ ∼ T−1. Moreover, thermal conductivity does not depend on temperature in a wide range beginning from 200 K.
The minimal thermal conductivity is along the C-axis, and the maximal thermal conductivity is across the C-axis. The thermal conductivity of HMS with different types of dopant varies between the maximal and minimal thermal conductivities of pure single crystals of HMS. Because of these findings, only the modification of the energy spectrum of current carriers leads to the increase in the thermoelectric figure of merit.
It was shown that the distance between monosilicide precipitations can be controlled by the quantity of impurities and crystal growth rate. These precipitations can work as barriers for electrons and phonons. This explains the minimal thermal conductivity along the C-axis. Current flow can be described by a simple model, the so-called "mobility edge". One can suggest that at some energy E < Ec, the mobility of current carriers is negligibly low; and at some energy E > Ec, the mobility is equal to the usual band mobility. In Ref. 41, the higher Ec is, the higher the power factor and the lower the electronic thermal conductivity are, if the Fermi level is close to Ec.41,42) Optimization of the composition of HMS improves its thermoelectric properties (Fig. 4).
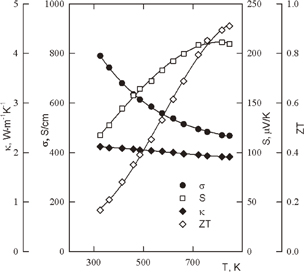
Fig. 4. Temperature dependences of the Seebeck coefficient, electrical and thermal conductivities, and dimensionless figure of merit of optimized HMS.40)
Download figure:
Standard image High-resolution image5. Chromium disilicide
Chromium disilicide (CrSi2) is the least studied material among 3d-transition metal silicides. Probably, this is due to its sufficiently high melting point and not very high ZT. A detailed study of the thermoelectric properties of CrSi2 along and across the C-axis in the temperature range from 300–1000 K was carried out only in one work.11) The thermoelectric properties of undoped CrSi2 are shown in Fig. 5. As one can see, CrSi2 has the anisotropy of all thermoelectric properties. Although the maximal ZT is only 0.25 along the C-axis, CrSi2 has not been well studied yet to evaluate its potential as a thermoelectric material. However, its anisotropic Seebeck coefficient is sufficiently high (S∥ − S⊥) in a wide temperature range for use in IR detectors.
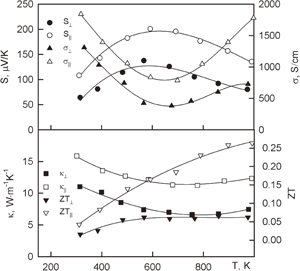
Fig. 5. Thermoelectric properties of cromium disilicide.11)
Download figure:
Standard image High-resolution image6. Iron disilicide
FeSi2 is one of the cheapest materials. Since Ware and McNeil43) proposed its use in thermoelectric devices, very many papers devoted to the study of this material have been published. There are two phases of higher iron silicide: α-phase — metal, which has a tetragonal structure and is stable at T > 1210 K, and β-phase — semiconductor with an orthorhombic structure, which is stable at T < 1210 K. Undoped samples of β-FeSi2 exhibit both negative and positive Seebeck coefficients. Heinrich et al. showed that the sign of the Seebeck coefficient most likely depends on the purity of the source components.44) Increasing the purity of iron up to 5N resulted in a stable negative Seebeck coefficient instead of the positive Seebeck coefficient observed when using 4N Fe. Another reason for variations in the properties may be stoichiometry deviations.45) The position of the growth depends on the composition of the sample and on the purity of components. The observed increase could be associated with the optical phonon-drag effect.46) Doping β-FeSi2 with Al and Co was proposed initially by Ware and McNeil,43) and p-type doping with Mn has also been used.47) The highest thermoelectric ZTs were obtained in the following samples: (FeCo)Si2 (n-type) ZT ≈ 0.4 at T ≈ 700 K and Fe(SiAl)2 (p-type) ZT ≈ 0.2 at T ≈ 600 K (Fig. 6).
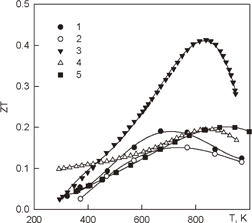
Fig. 6. Thermoelectric properties of β-FeSi2: 1 — Fe0.95Co0.05Si2,43) 2 — FeSi1.96Al0.04,43) 3 — Fe0.95Co0.05Si2,48) 4 — FeSi1.92Al0.08,48) and 5 — Fe0.93Co0.07Si1.99Al0.01.12)
Download figure:
Standard image High-resolution imageThe principal feature of the Seebeck coefficient measurement is the sharp increase in the absolute Seebeck coefficient in the temperature range of 100 < T < 300 K. This sharp increase is associated with the excitation temperature of optical phonons.46) It is supposed that this increase is associated with the optical phonon drag. We have no experimental confirmation, but there is a good agreement between theory and experiment. We can estimate the possible thermoelectric figure of merit at T = 200 K, ZT ∼ 3.
7. Ruthenium silicide (Ru2Si3)
The following two silicides have no merits — they are not cheap. Nevertheless, they could be used in some applications. Moreover, the study of their properties could contribute to the study of the physics of thermoelectrics.
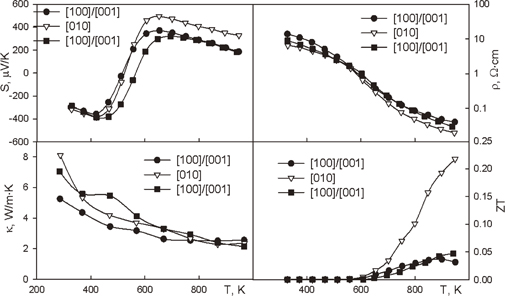
Ru2Si3 and FeSi2 have phase transitions at ∼1240 K.49) Low-temperature phase α-Ru2Si3 has an orthorhombic structure, whereas high-temperature phase β-Ru2Si3 has a tetragonal structure. Both phases are semiconductors. Similarly to HMS, Ru2Si3 crystal has cleavage planes. In Ref. 50, the cleavages were orthogonal [010], whereas in Ref. 51, they were oriented orthogonally either [100] or [001]. Probably, similarly to HMS, this is related to the crystal pulling rate. A full set of experimental curves was obtained by Simkin et al.51) for the crystals with the domain structure. Figure 7 shows the properties of these crystals. Sufficiently high ZTs for doped Ru2Si3 have been reported in a number of papers.9,10,52–54) Practically, all of them have elements of extrapolation for ZT calculation, because the data obtained from different samples were used. Nevertheless, a systematic study of this material has not been conducted yet.
Fig. 7. Thermoelectric properties of Ru2Si3.51)
Download figure:
Standard image High-resolution image
The thermoelectric properties of Ru2Si3 have been studied in a number of works. Vining et al. found anisotropy in the transport properties of pure Ru2Si3.54) At temperatures higher than 500 K, the properties slightly depend on the sample features but are strongly dependent on orientation.
At lower temperatures, the dependence on sample features becomes much stronger.54) Evidently, the hole mobility of pure Ru2Si3 is higher than that of electrons; even when the Seebeck coefficient is negative at a low temperature, it is positive at a high temperature. In the study by Souptel et al.,50) the Seebeck coefficient of a single crystal was measured down to 100 K. At temperatures higher than 210 K, the Seebeck coefficient temperature dependence is equivalent to that of other n-type materials, where the mobility of holes is higher than that of electrons. At lower temperatures, the absolute Seebeck coefficient increases with decreasing temperature. This was thought to be associated with donor-level filling,53) but it could also be associated with the phonon-drag effect. The widths of the energy gaps reported in these papers are similar: 1.08 eV53) and 0.95.50) The electron concentration in Ru2Si3 can be increased by doping with P, Ga,55) Ir,55,56) or Rh.9) Mn can be used as a p-impurity.10) Mn impurity addition decreases electrical resistivity, while the positive sign of the Seebeck coefficient is conserved over all temperature ranges.10) There is no essential change in thermal conductivity at elevated temperatures. A maximum value of the thermoelectric figure of merit (∼0.27) was achieved at T ∼ 800 K. Rh doping increases the electron concentration and consequently increases the thermoelectric figure of merit.9) The curves of the transport properties for samples having 4 and 6% of Rh are very close (except for two points at the highest temperature). It is concluded that Rh-doped Ru2Si3 has a maximum thermoelectric figure of merit of <0.4 at T ∼ 900 K.
8. Rhenium silicide (ReSi1.75)
For a long time, higher rhenium silicides have been considered as stoichiometric disilicide ReSi2 with a tetragonal structure (space group 4/mmm, a = 0.3131; c = 0.7676 nm).57) Recently, it has been shown that it is defect disilicide and its crystal structure should be described as a triclinic (space group P1, a = 0.3138; b = 0.3120; c = 0.7670 nm; α = 89°90).18) The real composition of the higher rhenium silicide is ReSi1.75.
The band structure of ReSi1.75 determined by the full-potential linearized-augmented-plane-wave (FLAPW)58) method or the linear muffin-tin orbital (LMTO)59) method has the conduction band minimum at the S point, which is the [110] direction within an orthorhombic symmetry, and the valence band maximum at the Γ point. The most interesting feature of the band structure is that the highest valence band in the Γ–Z direction, which is the [001] direction, is almost flat. That leads to a very large hole effective mass, and this is the reason for the great anisotropy of the thermoelectric properties of ReSi1.75. Its electrical conduction is of the n-type when measured along [001], while it is of the p-type when measured along [100]. Although the Seebeck coefficient along [100] is moderately high (+150 to +200 µV/K), it is very high along [001] (−250 to −300 µV/K). In Ref. 60, it was shown that the large effective mass of holes along [001], which is mainly due to the characteristic flat feature of the band structures, gives inconsiderable contribution of holes to the whole energy transport along [001] induced by the Seebeck effect.
As a result, a very high ZT of 0.7 is achieved at 1073 K when measured along [001].8) Similar results are shown in Ref. 7, where the ZT is even increased to 0.8 with a small amount (2% substitution for Re) of Mo added.
9. Conclusions
The considered silicides are very interesting as thermoelectrics. Some of them have a high figure of merit, while others have strong anisotropic properties that can be used in anisotropic thermoelectric devices. These properties are attributed to the internal structure of the higher transition metal silicides. They show unusual kinetic properties and understanding the nature of these features can result in new ways of thermoelectrics improvement.