
Abstract
The sonoluminescence (SL) spectrum of Na atoms revealed that the Na line consists of two components, one of which is a broadened component (broad component) which is shifted from the original D lines, and the other is an unshifted narrow component (narrow component). We spatially separated the continuum, broad, and narrow components by capturing SL images using different optical filters. We also temporally separated these components by measuring SL pulses using respective band-pass filters. The SL image distribution and the timing of the SL pulses were different between the broad and narrow components. The results suggested that the broad and narrow components of Na emission are generated from different bubble populations. The dependences of SL spectra on ultrasonic frequency and dissolved rare gas (He, Ne, Ar, Kr, and Xe) were also investigated. It is concluded that the broad component and a blue satellite peak at 558 nm originate from van der Waals molecules composed of Na and rare-gas atoms. The narrow component was predicted to occur under temperature conditions at bubble collapse higher than that for the broad component.
Export citation and abstract BibTeX RIS
1. Introduction
Sonoluminescence (SL) is emitted under the high-temperature and high-pressure conditions inside bubbles at collapse under intense ultrasounds in liquid.1–4) A spectrum of multibubble sonoluminescence (MBSL) from NaCl aqueous solutions consists of continuum emission, which is pale light extending from UV to IR wavelengths, and Na emission, which is orange light from Na atoms. The Na emission has two peaks at 589.0 nm (D2 line, 3P3/2 → 3S1/2) and 589.6 nm (D1 line, 3P1/2 → 3S1/2), and they are broadened and peak-shifted, which were caused by the high-temperature and high-pressure conditions inside bubbles.5) This phenomenon has attracted much interest from the viewpoint of not only sonoluminescence but also sonochemistry,6,7) because it includes basic questions on acoustic cavitation if nonvolatile species can enter the hot core of the bubbles. A key issue on alkali-metal atom emission in SL is whether alkali-metal atom emission occurs in the gas phase8–14) or liquid phase.15–17) Unlike alcohol or water molecules, nonvolatile species such as alkali-metal ions hardly enter the bubble interior by evaporation.
Hayashi and Choi18) compared the SL spectra of K atoms in KCl aqueous solutions saturated by various rare gases. They observed that the K lines from He-saturated solutions broadened symmetrically and those from Ar- or Xe-saturated solutions broadened asymmetrically toward the red side relative to the original wavelength. The result was consistent with those of gaseous spectroscopic studies that examined the broadening and shift by rare gas under high pressures. This suggested that the emission from alkali-metal atoms occurs in the gas phase inside bubbles. They obtained the conditions of 3480 K and 585 atm at the Na emission assuming adiabatic bubble collapse. Hayashi and Choi19) investigated the sonication-time dependence of Na spectra from sodium dodecyl sulfate aqueous solutions. From the change in the spectral shape, they found that the Na emission consists of two components: broadened lines, which exhibited a redshift from the original D lines, and unshifted narrow lines. We respectively refer to these components as the broad and narrow components hereafter.
To investigate the origin of these two components, we performed experiments to separate the broad and narrow components spatiotemporally by capturing SL images and SL pulses using different optical filters. We also studied ultrasonic frequency and dissolved gas dependences of the Na emission spectra. The correlation of the two components with a blue satellite peak (BSP) at 558 nm was investigated at 85, 145, and 512 kHz. The line width of the broad component and ratio of the two components were compared under several dissolved gas conditions. The present results suggest that the broad component and BSP originate from strong interactions between alkali-metal atoms and rare-gas atoms in the bubble, indicating the formation of van der Waals molecules. The narrow component is associated with temperature conditions which may be higher than that for the broad component.
2. Experimental methods
A NaCl aqueous solution of 4 M concentration was carefully degassed in a vacuum chamber and then saturated with rare gas for one day. The solution of 350 mL volume was contained in a cylindrical glass cell. The temperature of the cell was maintained at 15 °C by circulating temperature-controlled water around the cell. A sandwich-type transducer with a fundamental frequency of 28 kHz or a piezoceramic transducer with a frequency of 512 kHz was glued using epoxy-resin adhesive to the bottom of the cell. A continuous signal from a function generator (NF Circuit WF 1944A) was amplified using a power amplifier (E&I 2100L) and impedance-matched using a transformer.
We used a blue-pass filter (transparent wavelength of 350–539 nm) and a Na band-pass filter (transparent wavelength of 589.3 nm with FWHM of 9.92 nm) to separate the continuum and Na emissions, respectively. We also used filter N (transparent wavelength of 589.3 nm with FWHM of 1.18 nm) and filter B (transparent wavelength of 592.5 nm with FWHM of 1.57 nm) to separate the two components of Na emission. Figure 1 shows the spectra of the Na components measured without and with the three types of filter. Filter N extracts the narrow component and filter B extracts part of the broad component.
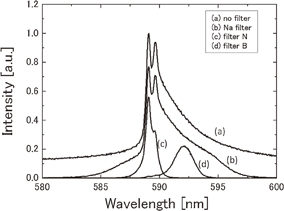
Fig. 1. Na spectra measured by using different filters. Spectrum (a) observed without filter, (b) observed with Na filter (FWHM of 9.92 nm), (c) observed with the filter N (FWHM of 1.18 nm), and (d) observed with the filter B (FWHM of 1.57 nm).
Download figure:
Standard image High-resolution image2.1. Temporal separation of SL pulses
An experimental setup for the temporal separation is shown in Fig. 2. SL pulses from Xe-saturated NaCl solutions were measured at 145 kHz frequency and 9 W acoustic power. The acoustic power was measured by the calorimetry method. The emitted light was divided into two by a half mirror and was filtered by two of the four filters mentioned above. The filtered light was detected with two photomultipliers (Hamamatsu Photonics H10721-2 and H7422-01). Single shots of SL pulse were captured with a 4 × 10⁹ samples/s oscilloscope (Agilent DSO5052A), and over a hundred traces of the single shot were accumulated on a screen.
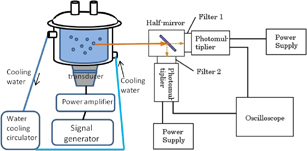
Fig. 2. Experimental setup for the temporal separation of SL pulses.
Download figure:
Standard image High-resolution image2.2. Spatial separation of SL distribution
For the spatial separation of these components, we photographed the SL using a camera (Canon EOS 6D) with a sensitivity of ISO 12800, equipped with the appropriate filter. We used two types of cell, a cylindrical glass cell at 145 kHz and 15 W, and a rectangular glass cell at 512 kHz and 34 W. The photographs were taken from the top and front face of the cell.
2.3. Spectral measurements of Na emission
We measured MBSL spectra in the wavelength range of 550–610 nm in NaCl solutions of 4 M concentration. Emitted light was analyzed using the system of a monochromator (SpectraPro 300i) and a cooled CCD detector (Princeton Instrument Pixis). Spectra were collected with a slit width of 0.1 mm using a grating of 1200 grooves/mm blazed at 500 nm. The instrumental bandwidth was estimated to be 0.16 nm (FWHM) from the measurement of a He–Ne laser line.
We examined the frequency dependences of Na emission and BSP at 558 nm in an Ar-saturated NaCl solution at the power of 12 W. The spectra were measured at the frequencies of 85, 145, and 512 kHz.
To clarify rare gas effects on the intensity and line width of Na emission, we measured the spectra of Na emission at 145 kHz and 15 W for He, Ne, Ar, Kr, or Xe gas dissolved in the solution. For comparison, we also measured the intensity and line width of K emission from 3 M KCl aqueous solution at 145 kHz and 15 W for He, Ne, Ar, or Kr gas dissolved in the solution.
3. Results
3.1. Temporal separation of Na emissions
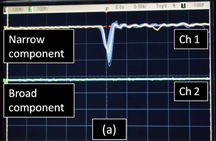
Figure 3 shows the oscilloscope tracings of the SL light pulses detected with the four types of filter. Figure 3(a) shows the comparison of the narrow component pulses [channel 1 (Ch.1)] and the broad component pulses (Ch.2). The synchronous trigger was set to Ch.1. The traces were superposed over a hundred times on the oscilloscope screen. Only the narrow component pulses were detected, and no broad component pulse was observed within the time axis of ±25 ns. The FWHM of the detected pulses was about 1.3 ns, which is determined by the time responses of the photomultiplier and oscilloscope. An intrinsic pulse width of Na emission was measured to be 0.32 ns by Choi et al.20) We have checked that SL pulses were observed in both channels of the oscilloscope at all times when no filter was used for both channels. When the synchronous trigger was set to Ch.2 (the broad component), only the broad component pulses were observed and no narrow component pulse was observed. These results suggest that the emissions of the narrow and broad components occur at different timings. Figure 3(b) shows the comparison of Na emission pulses (Ch.1) and continuum emission pulses (Ch.2) when the trigger was set to Ch.1. The situation was similar to the case of Fig. 3(a). The timing of Na emission pulses was different from that of the continuum emission pulses.
Download figure:
Standard image High-resolution image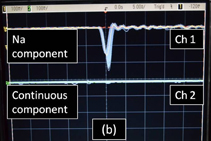
Fig. 3. Temporal separation of SL pulses from 4 M NaCl solution saturated with Xe gas at 145 kHz. (a) Pulses of Narrow component (Ch.1) and Broad component (Ch.2). (b) Pulses of Na component (Ch.1) and continuous component (Ch.2). The trigger was set to Ch.1 in both cases. The time axis is 5 ns/div.
Download figure:
Standard image High-resolution image3.2. Spatial separation of SL distribution
Figure 4 shows photographs of the cell, SL images with no filter, SL images with filter N (narrow component), and SL images with filter B (broad component) from the top to bottom row. Figures 4(a)–4(d) and 4(e)–4(h) are photographs taken from the front and top of the cell, respectively, at 145 kHz and 15 W. Figures 4(i)–4(l) and 4(m)–4(p) are photographs taken from the front and top of the cell, respectively, at 512 kHz and 34 W. Ultrasound was irradiated from the bottom of the cell toward a free liquid surface. Each SL image in the second row exhibits a spatial separation of the distribution between the continuum (white) and the Na (orange) emissions. The emission of the narrow component (third row) is relatively strong in the region near the center of the cell, as shown in Figs. 4(c), 4(g), 4(k), and 4(o). The emission of the broad component (fourth row) is distributed in the region near the side wall of the cell and liquid surface, as shown in Figs. 4(d), 4(h), 4(l), and 4(p).

Fig. 4. (Color) Spatial separation of sonoluminescence from 4 M NaCl solution saturated with Kr gas. (a)–(h) Images for a cylindrical cell sonicated at 145 kHz. (i)–(p) Images for a rectangular cell sonicated at 512 kHz. The images were captured with a camera using different filters with a sensitivity of ISO 12800. The exposure time is indicated in each picture.
Download figure:
Standard image High-resolution image3.3. Spectra of Na emission
3.3.1. Dependence on ultrasonic frequency
Figure 5 shows the Na emission spectra from Ar-saturated 4 M NaCl solutions at frequencies of 85, 145, and 512 kHz. The inset of Fig. 5 shows BSP observed at 558 nm. All the spectra are normalized by their maximum intensities. As the frequency increases, the line width appears to decrease. This may be caused by the relative change in the intensities of the broad and narrow components. The intensity of BSP decreased with increasing frequency.
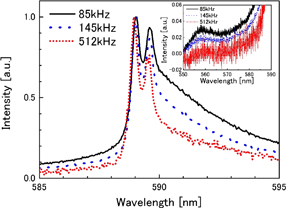
Fig. 5. (Color) Effect of ultrasonic frequency on Na emission spectra from Ar-saturated 4 M NaCl solution at 12 W. All the spectra are normalized by their maximum intensities. The inset shows blue satellite peaks centered at 558 nm. The ultrasound frequencies are 85, 145, and 512 kHz from the upper to the lower curve.
Download figure:
Standard image High-resolution imageBy the method of Kazachek and Gordeychuk,21,22) who successfully analyzed asymmetric spectrum, we resolved the spectrum shown in Fig. 5 into D1 and D2 lines, each having Broad and Narrow components. Figure 6 shows the resolved spectra at 145 kHz. Line (a) is the observed spectrum, and lines (b) and (c) indicate Narrow components accompanying no line shift and no broadening. Lines (d) and (e) indicate Broad components accompanying line shift and asymmetrical broadening. The apparent line width of Narrow components was the same as the instrumental width, and the real line width will be much smaller than the instrumental width.

Fig. 6. Separation of the spectrum of Na emission observed at 145 kHz and 12 W. (a) Observed spectrum. (b) Narrow component of D2 line. (c) Narrow component of D1 line. (d) Broad component of D2 line. (e) Broad component of D1 line.
Download figure:
Standard image High-resolution imageFigure 7 shows the frequency dependences of the intensities of the broad component and BSP relative to that of the narrow components of the D2 line. As the frequency increases, the intensity of the broad component decreases relative to that of the narrow component, which causes the lines to be apparently narrower with increasing frequency as shown in Fig. 5. Similarly, the intensity of BSP relative to that of the narrow component decreases with increasing frequency. Also, in the case of the D1 line, the frequency dependences of the intensities of the broad and BSP relative to that of the narrow component were similar to the case of the D2 line in Fig. 7.

Fig. 7. Effect of ultrasonic frequency on the intensity ratio of the broad component and BSP to Narrow component for Ar-saturated 4 M NaCl solution at 12 W.
Download figure:
Standard image High-resolution image3.3.2. Dependence on dissolved rare gas
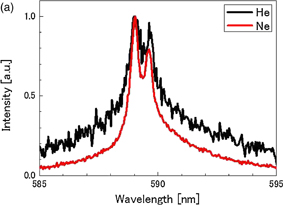
Figures 8(a) and 8(b) show spectra of the Na emission from 4 M NaCl solutions dissolved with He, Ne, Ar, Kr, or Xe at 145 kHz and 15 W. The line width tends to be narrower and the line shape tends to be more asymmetrical, as the atomic number of the dissolved gas increases. The peak intensity of Na emission, normalized by that for He saturation, is shown for various dissolved gases in Fig. 9(a) as represented by bars. The intensity increases in the order from He to Xe. The intensity for Xe is approximately 2,000 times larger than that for He. The spectra in Fig. 8 were separated to obtain the broad and narrow components of the D1 and D2 lines by the same procedure as employed in Fig. 6. The intensity ratio of the narrow to broad components is plotted by closed squares in Fig. 9(a) for various dissolved gases. A similar plot was made for the intensity of the K line (769.9 nm) and is shown in Fig. 9(b). The intensity ratio increases in the order from He to Kr. The rare-gas effect for Na and K cases shows a very similar trend.
Download figure:
Standard image High-resolution image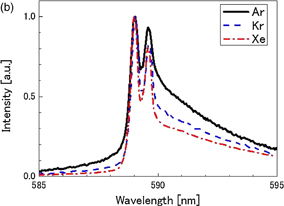
Fig. 8. Spectra of Na emission for 4 M NaCl solution saturated with (a) He and Ne, and (b) Ar, Kr, and Xe. The frequency was 145 kHz and the acoustic power was 15 W.
Download figure:
Standard image High-resolution image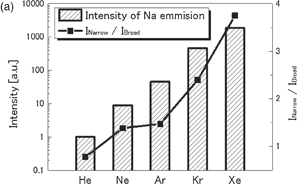
Download figure:
Standard image High-resolution image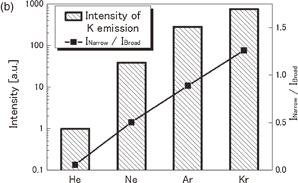
Fig. 9. (a) Rare-gas dependences of the peak intensity of Na emission (bars) and the intensity ratio of the narrow component relative to the broad component (closed squares). (b) A similar plot for K emission.
Download figure:
Standard image High-resolution imageThe half widths of the broad components of the D1 lines of Na and K emissions are compared for various dissolved gases in Figs. 10(a) and 10(b), respectively. Closed squares denote the averaged values of half width per unit density obtained from Ref. 23, which summarizes the results obtained by optical spectroscopy in the gas phase. The rare gas dependence of the half width of the Broad components correlates well with the literature values for both Na and K cases.

Download figure:
Standard image High-resolution image
Fig. 10. (a) Half width of Broad component obtained for Na emission (D1 line). Closed squares denote literature values obtained by gas-phase spectroscopy. The latter values are half width divided by n, which is the number of atoms under standard reference conditions of a gas. (b) A similar plot for K emission.
Download figure:
Standard image High-resolution image4. Discussion
Figure 3(b) shows that the timings of SL pulses between the continuum and the Na emissions are different. The SL images in the second row of Fig. 4, captured with no filter, show the separate distributions between the continuum and the Na emissions. The spatiotemporal separation of the continuum and the Na emissions in aqueous NaCl solution was first reported by Abe and Choi.24) They showed that Na emission occurs in a region with a sound pressure lower than that of the continuum emission. Bubbles that cause the Na emission have large radii with a wide distribution. The peak temperature in such bubbles is relatively low compared with that of the bubbles that emit the continuum emission. Cairós et al.25) reported that nonspherical bubbles are associated with Na emission. Xu et al.12) demonstrated a spatial separation of Na emission from Na2SO4 solution in sulfuric acid. They observed the continuum emission near the horn tip where the sound pressure is higher, and Na emission further away from the horn tip where the sound pressure is lower. Hatanaka et al.14) also observed a spatial separation of the continuum and the Na emissions in sulfuric acid solution.
In the comparison of the SL images between the narrow and broad components, some differences in the SL distribution can be pointed out. As shown in Figs. 4(d), 4(h), 4(l), and 4(p), the SL distribution for the broad component extends to outer part of the liquid container, compared with the SL distribution for the narrow component in Figs. 4(c), 4(g), 4(k), and 4(o). All the images for the narrow and broad components were captured under the same conditions of exposure time and sensitivity. An exact comparison of the SL distribution should be carried out under similar image brightness values. The brightness values of the images in the fourth row (broad component) are smaller than those in the third row (narrow component). Then, if we increase the brightness values of the images in the fourth row so as to be similar to those in the third row, the difference in the SL distribution will enlarge. Thus, the results of spatiotemporal observation indicate that the narrow and broad components originate from different bubble populations.
In the discussion of the spatial separation of the continuum and Na emissions, Xu et al.12) argued that if the Na emission originated from the liquid-bubble interface, the spatial separation of different sonoluminescence emitters should not occur. Their result supported the model of the nanodroplet injection into a bubble for the Na emission to occur. A similar discussion may be applied for the narrow and broad components. If the narrow component originated from the liquid-bubble interface where the temperature may be lower than that inside the bubble, the narrow component would always be present whenever conditions are sufficient to give rise to the broad component inside the bubble.
In the experiment of sonication time dependence of Na emission in SDS solution,19) the intensity of the narrow component decreased more quickly than that of the broad component. This indicated that decomposed gases quenched the narrow component easily. Adding CO2 gas to the NaCl aqueous solution had a very similar effect on the narrow component. These results favor the gas phase origin over the liquid-bubble interface origin for the narrow component.
Figure 4, particularly Figs. 4(c) and 4(d), indicates that the SL distribution of the narrow component is confined near the central axis of the sound fields where the sound pressure is relatively high compared with that of the SL region of the broad component. It is suggested that the narrow component originates from bubbles with a collapse temperature higher than that in the case of the broad component.
On the assumption of the gas phase origin for the narrow and broad components, three generation mechanisms are possible: (i) the two components arise simultaneously from the same bubble, (ii) the two components arise from the same bubble at a different timing, and (iii) the two components arise from different bubbles. Model (i) is not accepted clearly because the SL distribution and the timing of SL pulses of the two components did not coincide. Model (ii) is also not accepted. If the two components were emitted at different times in the course of a single bubble collapse, the difference should be less than a few ns since the duration time of the high temperature sufficient to emit light may be 5 ns or less.26) Figure 3 shows that the pulses of the two components were not simultaneously observed within 50 ns. Thus, the present results support model (iii).
The frequency effect on Na emission was studied by Cairós et al.25) in the range of 34.5–945 kHz. They observed a marked reduction in Na emission at 945 kHz compared with that at lower frequencies. This is in agreement with the present result shown in Fig. 5. Cairós et al.25) discussed that a higher shape stability of the smaller bubbles at higher frequency prevented droplet injection into the bubbles.
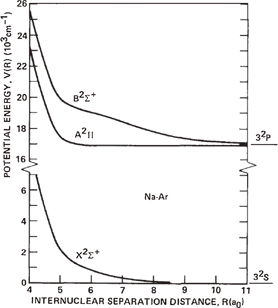
Figure 7 shows that the frequency dependence of the intensity ratio of the broad to the narrow components exhibits a behavior similar to that of BSP to the narrow component, suggesting that the broad component and BSP have similar origins. Lepoint-Mullie et al.10) observed the rare gas dependence of BSP for Rb emission in sonoluminescence, and concluded that the alkali-metal atom emission occurs in the gas phase because the rare-gas dependence of the BSP was in accordance with the results obtained by gas-phase fluorescence. They considered that the BSP originates from the electronic transition of van der Waals molecules formed between Rb and rare-gas atoms. For the Na–Ar system, Laskowski et al.27) calculated the potential curves of X2Σ+ (the ground state), A2Π (the first excited state), and B2Σ+ (the second excited state), as shown in Fig. 11. In the emission spectra of a high-pressure sodium lamp containing Ar, Woerdman and de Groot28) observed BSP at 555 nm for NaAr satellites attributable to the transition of B2Σ+–X2Σ+. The present result shown in the inset of Fig. 5 indicates that BSP exists at 558 nm, which is in agreement with the value observed in the gas phase emission spectra.
Fig. 11. Na–Ar interaction potentials as a function of the internuclear distance. Reprinted with permission from Ref. 27. © 1981 American Institute of Physics.
Download figure:
Standard image High-resolution image
The broad component observed is asymmetrically broadened and redshifted, indicating that this component corresponds to the transition of A2Π–X2Σ+. The line broadening and shift of alkali-metal atom emission caused by a rare gas have been well documented in the literature.23,29–31) The rare-gas dependence of the half width of Broad components is consistent with that of the gas-phase spectroscopic values, as shown in Figs. 10(a) and 10(b). The experimental accuracy of the half-width measurement was 10–30%. In the case of Na–He, in which the signal-to-noise ratio of the spectrum was very small, the accuracy was the worst. In the case of K–He, the accuracy was not very low (approximately 20%) because the procedure of the spectrum separation was simple as the spectrum consisted of mainly the broad components. These results suggest that the broad component arises from strong interactions between the rare gas and the alkali metal atoms in the bubbles. Thus, the broad component and BSP are probably caused by the transition from van der Waals molecules, which resulted from the interactions between the alkali-metal atom and the rare gas in the bubble at collapse.
The intensity ratio of Narrow to Broad components increases when the dissolved gas changes from He to Xe, as shown in Fig. 9. The thermal conductivity of the rare gas is reduced in the order of He > Ne > Ar > Kr > Xe. Xe has the smallest thermal conductivity, resulting in the highest temperature at bubble collapse because heat within the bubble is difficult to conduct from the bubble.32) Thus, when Xe is dissolved, the temperature within the bubble may be higher than in the cases of other gases. The frequency dependence of the Na spectrum, as shown in Fig. 5, indicates that the narrow component dominates at higher frequencies where a higher shape stability of bubble may provide a higher temperature at collapse. The effects of CO2 on Na emission, studied by Hayashi and Choi,19) demonstrated that the narrow component quenched more easily than the broad component. CO2 is known to quench SL by decreasing the temperature inside the bubble.33,34)
The present and previous results suggest that the narrow component may originate from bubbles of higher temperature than those for the broad component. Van der Waals molecules of Na and rare gas atoms may not be formed under high-temperature condition at the emission of the narrow component, which resulted in no line shift and no broadening of the narrow component. An alternative model is possible for elucidating the origin of the narrow component. Chu et al.35) proposed resonant radiation trapping by alkali atoms as a mechanism of Na emission in a laser-induced bubble. The resonant trapping of the Na emission line by the surrounding ground-state Na atoms or rare gas may increase the effective lifetime governing the emission dynamics.
The rare gas dependence of the peak intensity of Na emission, represented by the bars in Fig. 9, can be explained partly by the thermal conductivity of gas and also by the solubility of the rare gas.36) The solubility is closely related to the active bubble population. The solubilities for a partial pressure of 1 atm are 0.70, 0.82, 2.5, 4.5, and 7.9 × 10⁻⁵ M for He, Ne, Ar, Kr, and Xe, respectively. This order from He to Xe agrees with the increasing order of the Na emission intensity. It is well known that the ionizing potential of a rare gas is in the order of He > Ne > Ar > Kr > Xe. The order of this property may account for the intensity of the continuum emission, which is partly due to bremsstrahlung. The excitation of OH (C2Σ+) radicals was also explained by the ionization of the rare gas.37) For the excitation of Na emission, there are few experimental lines of evidence suggesting the participation of electrons.
5. Conclusions
Sonoluminescence from a NaCl aqueous solution exhibited two types of Na emission, the broad and narrow components, and also a blue satellite peak. The spatiotemporal separation of SL showed that the broad and narrow components are generated from different bubble populations. Spectral measurements of SL indicated that the broad component and the blue satellite peak originated from strong interactions between alkali-metal atoms and a rare gas in the bubble at collapse, suggesting the formation of van der Waals molecules. The narrow component was predicted to arise from temperature conditions within the bubble higher than that for the broad component. Further studies are required for determining the exact origin of the narrow component.
Acknowledgment
This work was supported by a Research Project Grant from the Institute of Science and Technology, Meiji University.