
Abstract
Experimental studies on epoxies report that the microstructure consists of highly crosslinked localized regions connected with a dispersed phase of low-crosslink density epoxy. Because epoxies play a major role in many structural applications, the influence of the crosslink distribution on the thermo-mechanical properties must be determined. But as experiments cannot reliably report the exact number or distribution of crosslinked covalent bonds present in the molecular network, molecular modeling is a valuable tool that can predict the influence of crosslink distribution on thermo-mechanical properties. In this study, molecular dynamics are used to establish well-equilibrated molecular models of an EPON 862-DETDA epoxy system with a range of crosslink densities and distributions. Crosslink distributions are varied by forming highly crosslinked clusters within the epoxy network and then forming additional crosslinks that connect between clusters. Results of simulations on these molecular models indicate that elastic properties increase with increasing levels of overall crosslink density and the thermal expansion coefficient decreases with overall crosslink density, both above and below the glass transition temperature. It is also found that within the range of crosslink distributions investigated, there is no discernible influence of crosslink distribution on the elastic modulus and the linear thermal expansion coefficient of the epoxy.
Export citation and abstract BibTeX RIS
1. Introduction
Because of their excellent specific stiffness and specific strength, epoxy matrix composites serve an important role in lightweight load-bearing applications, particularly in the aerospace industry. The bulk-level thermo-mechanical properties of epoxy composites depend significantly on the molecular-scale structure of the epoxy matrix. Because of the difficulty in experimentally determining the influence of molecular structure on small-scale thermo-mechanical behavior, computational molecular modeling is necessary for establishing accurate structure–property relationships for efficient materials design and engineering.
Structural epoxy materials are formed when an epoxy monomer solution chemically combines with a hardener solution to form a crosslinked polymer network. The extent and distribution of crosslinks dictate the physical, mechanical, and thermal properties of the epoxy material. It has been shown [1–7] that the crosslink formation process does not always produce a uniformly crosslinked structure. Based on the monomer : hardener ratio, mixing conditions, temperature, pressure and time lag between curing and post-curing cycles; cured epoxies can exhibit localized regions of densely crosslinked polymer chains and other areas of loosely crosslinked chains. Vanlandingham et al [7] studied the changes in microstructure and mechanical properties as a function of epoxy–amine mix ratio. They studied EPON 828 epoxy resin cured with PACM 20 hardener, and this epoxy–amine system exhibited a two-phase structure consisting of a hard microgel phase and a dispersed phase of soft, unreacted and/or partially reacted material. Their studies showed that the size distributions in microgel regions increased with increasing amine content. Morgan and O'Neal [6] performed electron and optical microscopy to study the relationship between the structure and the microscopic flow and failure processes of diethylenetriamine-cured bisphenol-A-diglycidyl ether epoxies. They found that these epoxies consisted of particles which were intramolecularly crosslinked molecular domains that interconnected to form larger network morphological entities. The flow processes that occurred during deformation were dependent on the network morphology in which regions of either high or low crosslink density were the continuous phase. Misra et al [4, 5] showed that typical commercial epoxy resins usually exhibit a distribution of molecular weights which result in a distribution of crosslink density in the final network. Cuthrell [2] showed that epoxy polymers contain closely packed floccules and an interstitial liquid consisting of partially reacted or unreacted material. The floccules represent highly crosslinked and entangled epoxy chains while the interstitial liquid consists of low-crosslinked epoxy chains. Although these studies have indicated that the crosslink distribution is not always uniform in epoxy polymers, it is difficult to experimentally quantify the local and overall crosslink density of the polymer network.
Infrared (IR) spectroscopy provides an approximate quantification of the extent of crosslinking from the change of IR transmittance associated with specific epoxy groups during the curing process. As more epoxy groups crosslink by breaking the epoxide bonds, the transmittance associated with the epoxide bonds increases; while the transmittance associated with hydroxyl groups decreases with the formation of hydroxyl bonds during the crosslink process. However, some complications and limitations are found when the baseline in the IR spectrum is not flat and other chemical bonds present transmittance bands at the same wave numbers as the epoxide ring transmittance band [8]. Thus the IR spectra are not always a reliable indicator of the extent of crosslinking. In contrast, computational molecular modeling can be used to study the influence of crosslink distribution on bulk-level properties because the crosslinking process can be directly controlled and quantified.
Many molecular dynamics (MD) studies have been performed on various epoxy systems in the last two decades. Doherty et al [9] modeled PMA networks using lattice-based simulations on a polymerization MD scheme. Yarovsky and Evans [10] discussed a static crosslinking technique which they used to crosslink low molecular-weight, water-soluble, phosphate-modified epoxy resins (CYMEL 1158). The crosslinking technique involved formation of crosslinked products in one step but all the possible crosslinks were formed in multiple steps with a series of molecular relaxations. The crosslinking of epoxy resins using MD was performed by Wu et al [11] and their model was subsequently used to study the diffusion of water in crosslinked networks. An iterative MD/molecular minimization (MM) procedure was used to crosslink an epoxy resin (DGEBA), with one crosslink established per iteration. Fan and Yuen [12] modeled a 100% crosslinked system of 628 molecules of EPON 862-DETDA and predicted the corresponding thermal and mechanical properties. Heine et al [13] simulated large PDMS networks using a dynamic crosslinking approach and Varshney et al [14] used Heine's dynamic crosslinking approach and Wu's MD/MM concept [11] to crosslink EPON 862 with DETDA. Varshney et al [14] modeled systems having 14 976 molecules of EPON 862 and DETDA. Li and Strachan [15] modeled EPON862-DETDA systems having 16 000 atoms and showed the dependence of mechanical properties on the extent of crosslinking. Bandyopadhyay et al [16] modeled EPON 862-DETDA systems having more than 25 000 atoms with different crosslink densities and predicted thermo-mechanical properties of the crosslinked systems. Although these studies demonstrated the predictive capabilities of MD for epoxy systems, they did not address the influence of crosslink distribution on the bulk-level thermo-mechanical properties.
The objective of this study is to predict the influence of crosslink distribution on the thermo-mechanical properties of an epoxy system using computational molecular modeling. Specifically, MD approaches have been used to create molecular models of EPON 862-DETDA with varying levels of overall crosslink density (i.e. total number of crosslinks formed with respect to the total number of possible crosslink reaction sites in the entire MD model) and localized 'cluster' crosslink density (i.e. the crosslink density of highly-crosslinked regions within the MD model). The volume shrinkage, coefficients of thermal expansion and elastic moduli values have been predicted for each of the various crosslink distributions. The results indicate that there is no discernable influence of the crosslink distribution on the thermal expansion coefficients and elastic moduli of the modeled epoxy. Because the experiments described above [2, 4–7] did not report any trend for the influence of crosslink distribution on thermo-mechanical properties of epoxy, the computational predictions presented in this study are unique.
2. Molecular modeling
This section describes the procedure for building a series of MD models with various distributions of crosslinks. The techniques for creating a monomer/hardener solution are described first, followed by the procedure for crosslinking individual material clusters and the entire polymer network. It is important to note that the term 'cluster' used in this study strictly refers to smaller sub-divisions of the overall MD model.
2.1. Uncrosslinked molecular models
A small-scale MD model was established for a mixture of EPON 862 monomer (di-glycidyl ether of bisphenol-F) and crosslinking agent DETDA (diethylene toluene diamine). The molecules of EPON-862 and DETDA are shown in figure 1. A stoichiometric mixture (2 : 1 ratio) of two molecules of EPON-862 and one molecule of DETDA was modeled using the LAMMPS (large scale atomic/molecular massively parallel simulator) simulation program [17]. The initial atomic coordinates were written in a coordinate file in the native LAMMPS format and the OPLS united-atom force field [18–20] was used to define the bond, angle and dihedral parameters with Lenard-Jones non-bonded interactions. The initial 2 : 1 structure was simulated in a 10 × 10 × 10 angstrom (Å) simulation box with periodic boundary conditions. This structure was subjected to four energy minimizations (MM) and three MD simulations to drive the system to a stable equilibrium. After equilibration was achieved, the structure was replicated to form eight more structures within the simulation box such that a 16 : 8 molecular mixture of EPON 862 and DETDA monomers was established with a total of 664 united atoms. A gradual equilibration procedure was performed over a cycle of 20 MM and 10 MD simulations to equilibrate the structure and reduce the simulation box size such that a mass density of 1.2 g cm−3 was achieved. This procedure was previously established [16], however, it will be briefly explained here. Incremental reductions in the simulation box volume were followed by a MM simulation, a MD simulation, then another MM simulation to minimize the energy for each incremental reduction. Minimization was assumed to occur when the potential energy and pressure of the simulation boxes was stable with respect to simulated time. A total of 10 of such reductions were performed until the simulation box volume was reduced enough to yield a mass density of 1.2 g cm−3. Using 10 incremental volume reductions, the target mass density could be achieved without significant increases in potential energy and pressure of the molecular model. All MD simulations were conducted in the NVT (constant volume and temperature) ensemble for 100 ps at 600 K. This simulation time ensured that no residual pressures (and thus stresses) remained in the structure after each increment of simulation box size reduction. Therefore, there were no significant stresses present in the molecular structure once the density of 1.2 g cm−3 was achieved. The NVT ensemble made use of the Nose/Hoover thermostat for temperature control [21].
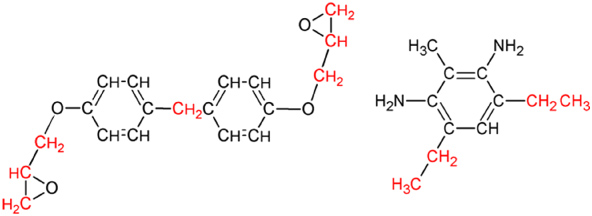
Figure 1. Molecular structures of EPON 862 resin and DETDA crosslinking molecules. Alkyl groups colored in red were considered as united atoms.
Download figure:
Standard image2.2. Crosslinking of molecular clusters
After equilibration of the 16 : 8 molecular mixture, the structure was crosslinked based on the root mean square (rms) distance between the N atoms of DETDA and CH2 groups of the EPON 862 molecules, similar to the approach used by Bandyopadhyay et al [16]. A crosslinked and equilibrated 16 : 8 molecular mixture is shown in figure 2 (Bonds have not been shown for better clarity of the image).

Figure 2. Crosslinked EPON 862-DETDA system with 16 : 8 molecular ratio after complete equilibration. (Figure has been zoomed for easy understanding.)
Download figure:
Standard imageThe simulated crosslinking process is depicted in figures 3 and 4. Three assumptions were made for the crosslinking procedure:
- (1)Both primary amines in DETDA were assumed to have the same reactivity.
- (2)The CH2–O and N–H bonds were broken simultaneously (figure 3).
- (3)One N atom was partially activated when it had only one activated CH2 within a defined cutoff distance.

Figure 3. First step of crosslinking reaction: The lone pair of electrons of the nitrogen atom attacks the carbon atom next to the epoxide oxygen, forming a C–N bond and leaving a negative charge on the oxygen and a positive charge on the nitrogen. (The wavy lines represent the remaining parts of the EPON 862 and DETDA molecules in the respective structures.)
Download figure:
Standard image
Figure 4. Second and final steps of crosslinking reaction: (a) the negatively charged oxygen abstracts a proton from the neighboring protonated amine, resulting in an alcohol group and an amine group and the crosslinking is complete. (b) The same crosslinked nitrogen reacts with another epoxide end of EPON 862 and forms two crosslinks.
Download figure:
Standard imageThe starting point of the crosslinking reaction is shown in figure 3 where the nucleophilic amine of the DETDA molecule reacts with the unsubstituted epoxy C, and the adjacent oxygen atom attains a negative charge when the C–O bond is broken. After forming a bond with the C atom, the N atom attains a positive charge and thus the neutrality of the EPON 862-DETDA system is maintained. Crosslinks were formed by computing all rms distances between each N atom and the CH2 united atoms within a defined cutoff distance. The CH2 radicals located outside the cut-off distance of a particular NH2 group were not crosslinked to that particular group. The cutoff distance was chosen to achieve a desired level of crosslinking as described elsewhere [16]. In the following step, the H atoms were formed by breaking NH2 bonds and were reacted with the O atoms of the broken epoxide ends. This bond formation was also performed based on the closest rms distances between the O and H atoms. The second step of the crosslinking reaction is shown in figure 4. The crosslink density of the molecular clusters is defined as the ratio of the total number of crosslinks that were formed to the 32 total crosslinks that could potentially be formed. For example, an epoxy network having 16 out of 32 crosslinks is defined as having a 50% crosslink density. A total of three molecular clusters were crosslinked to crosslink densities of 50%, 59% and 69%.
2.3. Crosslinking of the large-scale molecular models
Once the molecular clusters were crosslinked and equilibrated, they were replicated to form a 3 × 3 × 3 array, such that a series of larger-scale models were established that contained 27 individual molecular cluster models. A total of three larger-scale models were initially formed, one for each of the three cluster crosslink densities (50%, 59%, and 69%). The large-scale models had 432 molecules of EPON 862 and 216 molecules of DETDA. The three large-scale systems were equilibrated in the same manner as the molecular clusters to ensure a thorough mixing of the individual molecular clusters and an overall mass density of 1.2 g cm−3. A total of 17 928 united atoms were used in the model, which represented a total of 25 272 real atoms. A pictorial representation of how the large-scale structure was evolved from molecular clusters is shown in figure 5.
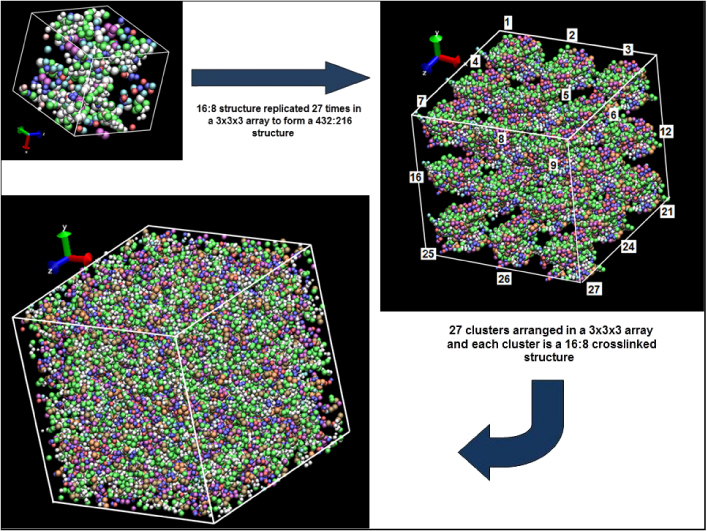
Figure 5. Evolution of EPON 862-DETDA model having 432 : 216 molecularratio.
Download figure:
Standard imageFor each of the three large-scale molecular models, various levels of additional crosslinks were added to previously un-reacted reactive groups that spanned different molecular clusters within the same large-scale structure. Figure 6 shows the crosslinking of the large-scale molecular model after equilibration. The yellow lines in the figure are not actual crosslinked bonds but are a magnified representation in order to explain the presence of crosslinks. These additional crosslinks served to mechanically stabilize the structure and to achieve a varying degree of overall crosslink densities. These interconnecting crosslinks simulated the dispersed phase of low-crosslink density as identified in the experiments discussed above [2, 4–7]. The crosslinked clusters represented the regions of high-crosslink density and higher molecular weight. Table 1 summarizes the nine different large-scale molecular models that were established, along with their corresponding cluster crosslink densities and overall crosslink densities. The ratio of the two crosslink measures is defined as
The ratio R provides a quantitative measure of the distribution of crosslinks. As shown in table 1, R varies from 0.66 to 0.99 for the large scale models. Larger values of R indicate that a higher percentage of the crosslinks are confined to the clusters, whereas small values indicate that the crosslinks are more distributed between clusters. It is also important to note that there is one 54% overall crosslinked system, two 63% overall crosslinked systems, three 70% overall crosslinked systems and three 76% overall crosslinked systems. Therefore, the predicted properties can be compared in terms of cluster crosslink density, overall crosslink density and R.
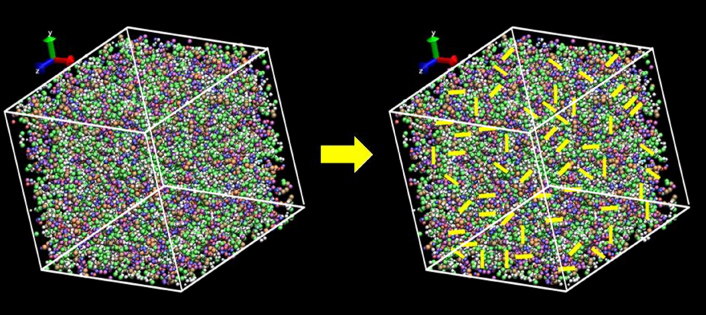
Figure 6. Crosslinking in between clusters of EPON 862-DETDA 432 : 216 model. (Yellow lines indicate crosslinked bonds connecting clusters.)
Download figure:
Standard imageTable 1. Summary of cluster and overall crosslink densities.
| Large-scale molecular model | Cluster crosslink density | Overall crosslink density | R |
|---|---|---|---|
| 1 | 50% | 54% | 0.93 |
| 2 | 50% | 63% | 0.79 |
| 3 | 50% | 70% | 0.72 |
| 4 | 50% | 76% | 0.66 |
| 5 | 59% | 63% | 0.94 |
| 6 | 59% | 70% | 0.85 |
| 7 | 59% | 76% | 0.78 |
| 8 | 69% | 70% | 0.98 |
| 9 | 69% | 76% | 0.91 |
3. Results and discussions
3.1. Volume shrinkage
For each of the nine cross-linked epoxy models, NPT (constant pressure and constant temperature) simulations were run for 400 ps at 29 different temperatures ranging from −73 °C (200 K) to 277 °C (550 K) at temperature intervals of 12.5 °C and at pressures of 1 atmosphere (atm). These simulations modeled the process of constant heating of the epoxy systems from cryogenic to elevated temperatures, and provided the equilibrated volumes corresponding to each temperature interval. Shown in figure 7 is the volume shrinkage of four of the large-scale models with a 50% cluster crosslink density (systems 1–4 in table 1) with respect to the volume at 277 °C. Similarly, the volume shrinkage curves of the three large-scale models with a 59% cluster crosslink density (systems 5–7 in table 1) are shown in figure 8, and the volume shrinkage curves of the two large-scale models with a 69% cluster crosslink density (systems 8 and 9 in table 1) are shown in figure 9. Data from the final 350 ps of each NPT simulation were used to establish the data points in the graphs. The data gathered during the first 50 ps of the simulations were not used because it was observed that the molecular structures were not initially equilibrated after the imposed changes in temperature, which is expected when the temperature of an initially equilibrated structure is changed. It took 50 ps for the molecular structure to reach an apparent equilibrium during the simulations. This time interval was determined by observing the oscillation of the total pressure. The oscillation arrived at a constant level by 50 ps. Figures 7–9 also show the scatter present in the final 350 ps of each simulation in the form of error bars. It is observed that the scatter is relatively small at low temperatures and large at high temperatures, which indicates that the crosslinked epoxy polymer molecules undergo larger vibrations in the rubbery phase to cause the changes commonly associated with the Tg.
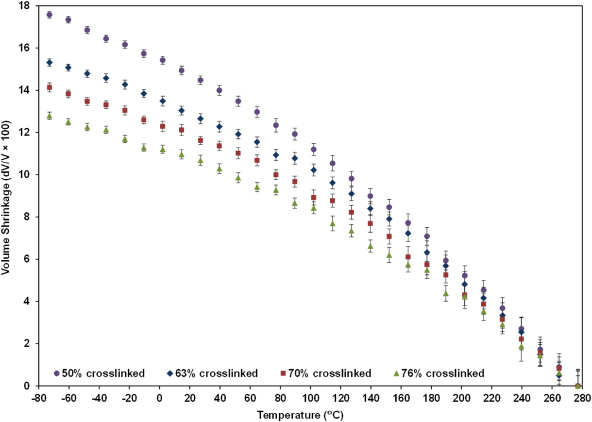
Figure 7. Volume shrinkage curves of 54%, 63%, 70% and 76% overall crosslinked systems with 50% crosslinked clusters with respect to the volume at 277 °C.
Download figure:
Standard image
Figure 8. Volume shrinkage curves of 63%, 70% and 76% overall crosslinked systems with 59% crosslinked clusters with respect to the volume at 277 °C.
Download figure:
Standard image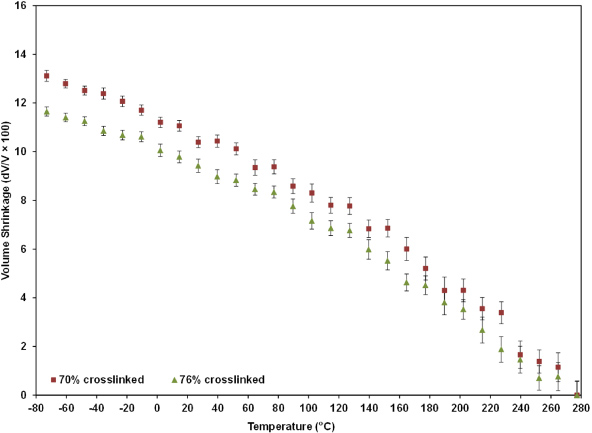
Figure 9. Volume shrinkage curves of 70% and 76% overall crosslinked systems with 69% crosslinked clusters with respect to the volume at 277 °C.
Download figure:
Standard imageThe data in figures 7–9 show that for decreasing simulation temperatures, the volume shrinkage increases, as expected, due to thermal contraction. The data also clearly show that for increasing levels of overall crosslink density the volume shrinkage decreases. This trend holds for all three cluster crosslink densities, and is similar to that reported by Bandyopadhyay et al [16].
The epoxy systems shown in figure 7 differ from each other in one aspect; the number of crosslinks in between the crosslinked clusters. As these crosslinks connecting the clusters are considered as the dispersed phase of low crosslink density, figure 7 shows that the clusters become more rigidly bonded to each other as the dispersed phase becomes more crosslinked. Thus the entire system becomes more resistant to volumetric deformations for a given temperature change. These results are expected, and are presented here as a validation of the present modeling technique.
3.2. Coefficients of linear thermal expansion
Linear regression lines were fitted on the first 10 data points (−73 to 39.5 °C) and the last 10 data points (164.5 to 277 °C) of the volume shrinkage curves shown in figures 7, 8 and 9 for determining the coefficients of volumetric thermal expansion (CVTE) below and above Tg, respectively. The Tg of similar EPON 862-DETDA systems have been reported elsewhere [12, 14, 16, 22]. The remaining nine data points in the middle portion of the volume shrinkage curves were assumed to be the glass transition range and were not used in calculating CVTE. The CVTE is defined as

where V0 is the initial volume of the simulation box at 277 °C, and the subscript P implies a constant-pressure process. The coefficient of linear thermal expansion (CLTE) is defined as

where L0 is the initial length of each side of the cubic simulation box at 277 °C. The CLTE values obtained for the nine different crosslinked systems are shown in figure 10. The uncertainty in the predicted CLTE values is shown in figure 10 based on the uncertainty in the data shown in figures 7, 8, and 9 and standard rules of propagation of errors [23].

Figure 10. Coefficients of linear thermal expansion versus overall crosslink density.
Download figure:
Standard imageThe predictions shown in figure 10 are consistent with those described in the literature [12, 16, 24], that is, the CLTE values decrease with increasing levels of overall crosslink density, both above and below Tg. This is likely because of increasing numbers of covalent crosslinks in the polymer network serve to inhibit volume expansion in response to temperature increases. The larger values of CLTE above Tg are due to the increase in molecular mobility of the polymer network in the rubbery state. In the glassy state, the network has a higher density and thus reduced molecular mobility decreases the material's volumetric response to temperature changes.
The CLTE values of the systems with overall crosslink densities of 63%, 70% and 76% are shown in tables 2, 3, and 4, respectively, with the corresponding values in uncertainty, calculated as described above. The arrangement of the data in this manner allows for the direct comparison between systems with the same overall crosslink density and different crosslink distributions. The comparison of systems with the same overall crosslink density but differently crosslinked clusters provides insight into the effect of crosslink distribution. Each of the three tables shows variation in values of CLTE above and below Tg. The scatter shown in figures 7–9 had a small effect on the CLTE values as seen in tables 2–4.
Table 2. Comparison of thermal expansion coefficients of 63% crosslinked systems with different crosslinked clusters (CLTE value ×10−5 °C−1).
| 50% cluster crosslink density | 59% cluster crosslink density | |
|---|---|---|
| Above Tg | 21.7 (±0.58) | 15.3 (±0.50) |
| Below Tg | 9.0 (±0.21) | 8.0 (±0.25) |
Table 3. Comparison of thermal expansion coefficients of 70% crosslinked systems with different crosslinked clusters (CLTE value ×10−5 °C−1).
| 50% cluster crosslink density | 59% cluster crosslink density | 69% cluster crosslink density | |
|---|---|---|---|
| Above Tg | 18.3 (±0.54) | 13.3 (±0.53) | 16.7 (±0.51) |
| Below Tg | 8.0 (±0.21) | 7.7 (±0.20) | 8.3 (±0.21) |
Table 4. Comparison of thermal expansion coefficients of 76% crosslinked systems with different crosslinked clusters (CLTE value ×10−5 °C−1).
| 50% cluster crosslink density | 59% cluster crosslink density | 69% cluster crosslink density | |
|---|---|---|---|
| Above Tg | 17.3(±0.48) | 11.7(±0.43) | 14.3(±0.49) |
| Below Tg | 7.0(±0.19) | 5.7(±0.21) | 7.7(±0.22) |
The CLTE data are plotted against R in figure 11. Above Tg, there is a considerable amount of scatter in the data, and there is no clear influence of R on the CLTE. Below Tg, the scatter in the data is reduced and it appears that there may be a slight increase in the CLTE for increases in R. This would indicate that as more crosslinks are confined to the individual clusters, the overall molecular mobility of the system increases by a small amount, as there is less resistance to volumetric changes with respect to temperature changes.

Figure 11. Coefficients of linear thermal expansion versus R.
Download figure:
Standard imageBecause the data in figure 11 indicate there is a slight influence of crosslink distribution on the overall CLTE (no influence above Tg), it follows that the scatter in the data shown in figure 10 is not highly influenced by the crosslink distribution, especially for the above-Tg data. Therefore, it is likely that the scatter in both sets of data in figure 10 is mostly caused from a statistical variation in properties of the discrete systems. Each system has a unique molecular structure and a finite number of atoms, and thus it is expected that a finite amount of scatter will exist in predicted properties. This has been discussed in detail elsewhere for thermoplastic systems [25, 26]. It is expected that as the number of atoms increases, the scatter will decrease.
3.3. Mechanical properties
The elastic constants of the nine crosslinked systems were predicted with MD simulations. Various magnitudes of uniaxial tensile strain and volumetric strain were applied to the MD models to determine the elastic properties. All simulations were performed in the NVT ensemble under periodic boundary conditions. For all simulations, the applied strains were ramped up to the final strain level over the duration of the simulated time. The virial stress components were calculated for each timestep over the entire loading range. It was assumed that the bulk material mechanical response was linear-elastic and isotropic. It is important to note that although the elastic response of polymers is generally dependent on applied strain rate, and the simulated deformations are at relatively high strain rates, it is expected that the predicted elastic properties are close to those observed experimentally [15, 16]. This has been demonstrated for a range of crosslink densities [16]. Therefore, it is expected that the predicted mechanical response from the high- and low-crosslink density regions are not dependent on the simulated strain rate.
For the volumetric deformations, equal axial strains were applied simultaneously over all three principal directions of the simulation boxes using the 'fix deform' and 'fix nvt/sllod' commands provided by the LAMMPS software. The simulations were run at 300 K (room temperature) for 200 ps with timesteps of 0.2 fs. The simulated deformations were applied in both tension and compression according to

where εxx, εyy and εzz are the axial components of the infinitesimal strain tensor component with respect to the basis vectors defined in figure 5. The overall dilatation of the molecular models was

For each timestep in these simulations, the overall hydrostatic stress σh of the model was calculated by

where σxx, σyy, and σzz are the volume-averaged virial stress tensor components. For each timestep of the final 180 ps of the simulations, the hydrostatic stress and dilatation were used to perform a linear regression analysis to determine the bulk modulus

The bulk moduli calculated for positive and negative dilatations over each of the three strain levels were averaged. The data gathered during the first 20 ps of the simulations were not used in the regression analysis because it was observed that the molecular structures were not initially equilibrated after the imposed deformation, which is expected when an initially equilibrated structure is statically perturbed. It took 20 ps for the molecular structure to reach an apparent equilibrium during the simulated deformation. This time interval was determined by observing the oscillation of the total pressure. The oscillation arrived at a constant level by 20 ps. A total of nearly one million data points were used to calculate the bulk modulus for each epoxy system.
For the uniaxial tensile deformations, strains were individually applied along each of the principal axes of the simulation box using the 'fix deform' and 'fix nvt/sllod' commands in the LAMMPS software package. Axial strains were applied such that Poisson contractions were allowed in the transverse directions. For each model, the tensile strain was divided equally over 200 ps with timesteps of 0.4 fs. Tensile strains of magnitudes ±0.003, ±0.005 and ±0.007 were applied in each direction.
A linear regression analysis of stress versus strain was performed over the final 180 ps of each simulation to determine the corresponding Young's modulus (E). Young's moduli were averaged over all three axes and all three strain levels in both tension and compression. Using the values obtained for Bulk moduli and Young's moduli, Shear moduli (G) were calculated for all nine molecular systems as

The predicted Young's and shear moduli are shown in figure 12 for the entire range of overall crosslink densities. From the figure it is clear that there is an increasing trend in both moduli as the crosslink density increases. The magnitude of the predicted elastic properties is similar to those reported in the literature for the same epoxy system [15, 16, 27–29]. This trend with respect to overall crosslink density is similar to that observed by Bandyopadhyay et al [16] and Li and Strachan [15] for EPON 862/DETDA. Similar increasing trends have been reported in other epoxy systems by Gupta et al [27] and in epoxy–nanotube composites by Miyagawa et al [29]. Lees and Davidson [28] discuss data that show increasing distances between reactive sites in epoxies result in decreasing crosslink densities and decreasing elastic properties. Figure 12 also indicates that there is a substantial amount of scatter in the predicted elastic properties over the range of overall crosslink densities, particularly at overall crosslink densities of 63% and 70%.

Figure 12. Young's and shear moduli versus overall crosslink density.
Download figure:
Standard imageTables 5, 6 and 7 show Young's modulus and shear modulus of the systems with overall crosslink densities of 63%, 70% and 76%, respectively. Similar to the CLTE values presented in tables 2, 3 and 4, there is no clear trend in the elastic properties with changes in the crossink distribution. The lack of trend may be due to the significant amount of scatter in the data, which is substantially reduced for the system with the overall crosslink density of 76%.
Table 5. Comparison of elastic moduli of 63% crosslinked systems with different crosslinked clusters (in GPa).
| 50% cluster crosslink density | 59% cluster crosslink density | |
|---|---|---|
| Young's modulus | 0.79 | 1.32 |
| Shear modulus | 0.27 | 0.46 |
Table 6. Comparison of elastic moduli of 70% crosslinked systems with different crosslinked clusters (in GPa).
| 50% cluster crosslink density | 59% cluster crosslink density | 69% cluster crosslink density | |
|---|---|---|---|
| Young's modulus | 1.04 | 1.83 | 1.54 |
| Shear modulus | 0.36 | 0.65 | 0.55 |
Table 7. Comparison of elastic moduli of 76% crosslinked systems with different crosslinked clusters (in GPa).
| 50% cluster crosslink density | 59% cluster crosslink density | 69% cluster crosslink density | |
|---|---|---|---|
| Young's modulus | 1.60 | 1.69 | 1.65 |
| Shear modulus | 0.57 | 0.60 | 0.59 |
Figure 13 shows Young's and shear moduli plotted as a function of R. The regression lines show R has no influence on moduli values. Similar to the interpretation of figure 11, this indicates that the crosslink distribution has no detectable influence on the overall elastic response. The scatter in the data shown in figures 12 and 13 is therefore most likely due to statistical variation in properties of the discrete molecular systems. This scatter would likely disappear if it were possible to simulate molecular systems with many more orders of magnitude of atoms.

Figure 13. Young's and shear moduli versus R.
Download figure:
Standard image4. Conclusions
A molecular modeling study using MD and molecular minimizations has been performed on an EPON 862-DETDA epoxy. Crosslinked systems with varying degrees of overall and local crosslink density have been modeled. Thermal expansion coefficients and elastic properties of the epoxy system were predicted for each of these crosslinked systems. The predicted thermo-mechanical properties were mostly consistent with those given in literature, thus validating the computational approach used. The results indicate that with increasing crosslink density the elastic stiffness tends to increase, while the coefficient of thermal expansion decreases, both above and below Tg.
For coefficient of linear expansion, the ratio of cluster to overall crosslink density R had a small influence below Tg and no influence above Tg. This indicates that although CLTE values decrease for increasing overall crosslink densities, there is negligible dependence between CLTE and crosslink distribution for the distributions considered in this study. The same conclusion is drawn for the values of Young's and shear moduli for different crosslink distributions. Because there is little dependence of thermo-mechanical properties on the crosslink distribution, the scatter that is observed in these predicted properties corresponding to individual overall crosslink densities indicates the amount of statistical variation that is expected in such molecular models consisting of about 25 000 atoms.
Acknowledgments
This research was funded by the NASA under the Aircraft Aging and Durability Project (Grant NNX07AU58A) and by the Air Force Office of Scientific Research under the Low Density Materials Program (Grant FA9550-09-1-0375).