Abstract
Piezoelectric fiber composites (PFC) represent an interesting subset of smart materials that can function as sensor, actuator and energy converter. Despite their excellent potential for energy harvesting, very few PFC mechanisms have been developed to capture the human body power and convert it into an electric current to power wearable electronic devices. This paper provides a proof of concept for a head-mounted device with a PFC chin strap capable of harvesting energy from jaw movements. An electromechanical model based on the bond graph method is developed to predict the power output of the energy harvesting system. The optimum resistance value of the load and the best stretch ratio in the strap are also determined. A prototype was developed and tested and its performances were compared to the analytical model predictions. The proposed piezoelectric strap mechanism can be added to all types of head-mounted devices to power small-scale electronic devices such as hearing aids, electronic hearing protectors and communication earpieces.
Export citation and abstract BibTeX RIS
1. Introduction
Continuous progress in reducing the size and power consumption of portable electronic devices and recent technological advances in energy harvesting from the human body has increased the odds of achieving battery-less wearable electronic devices. Human powered electronics would curb the current dependency on batteries, give more autonomy to mobile technologies, bring more convenience to electronic consumers and finally reduce the environmental effects associated with battery disposal.
Kinetic energy (limb motion), strain energy (muscle force), and thermal energy (body heat) are three main forms of energy that can be harvested from the human body. The jaw movement that normally occurs when chewing, eating and speaking is the most promising muscle activity from which energy could be harvested in the region of the head. For instance, one can obtain approximately 580 J only from daily chewing, which is equivalent to an average power of approximately 7 mW [1].
The conversion of energy generated by human body movements to electricity can be achieved, among other ways, by piezoelectric effect. Piezoelectric materials become electrically polarized and produce an electric charge when subject to a mechanical stress. Different piezoelectric materials have been discovered in nature or synthesized in laboratory. However, those with mechanical flexibility are best suited for energy harvesting from the human body, because they can follow the bodyʼs contours and be easily integrated to wearable devices [2].
Polymer-based piezoelectric materials exhibit excellent mechanical flexibility properties. For example, polyvinylidene fluoride (PVDF), the most common polymer in this category, can accommodate a strain of 2% or even higher. Therefore, it has been widely investigated for various human body energy harvesting applications ranging from a PVDF microbelt capable of harnessing power from human breathing [3] to a PVDF backpack shoulder strap to harvest energy from general human body movements [4]. However, PVDF mainly suffers from its inherent low electromechanical coupling factor [5].
Unlike PVDF, the performance of inorganic ceramic-based piezoelectric materials is superior in electromechanical conversion efficiency. For example, lead zirconate titanate (PZT), the most well-known material in the ceramic piezoelectric category, has a piezoelectric coefficient ten times higher than PVDF [2]. But, ceramics are generally brittle, which hinders their possible use for flexible energy harvesting.
Therefore, ceramic piezoelectric elements must be integrated in the form of fibers, ribbons or wires onto a flexible substrate using a microelectromechanical system. This results in low profile piezoelectric structures having both flexibility and a high electromechanical conversion capability. PZT ribbons [6], PZT nanofibers [7] and piezoelectric fine wires [8] are some of the new materials technologies that are based on piezoelectric long elements with nanoscale cross-sections. Yet, their output power is in nanowatt range and they appear to be limited to powering nanosystems.
Composites with thicker piezoelectric fibers such as macro fiber composites (MFC) [9–12] and piezoelectric fiber composites (PFC) [5, 13] have been developed over the past years and are now commercially available. They are similar because both consist of the same three main components: unidirectional piezoceramic fibers, interdigitated electrodes and an adhesive polymer matrix. However, the methods used to form their fibers are different. MFC have rectangular cross-section fibers machined from low cost piezoelectric wafers using a computer-controlled dicing saw, whereas the fibers of PFC are formed through a particular injection molding process called viscose suspension spinning process and are typically circular in cross-section. The rectangular shape of MFC fibers gives the maximum contact area between the PZT fibers and the interdigitated electrodes due to the larger surface area when compared to the circular fibers of PFC, that results in more efficient transfer of electric field to the PZT fibers.
PFC which is also called active fiber composite has high degree of structural flexibility and is used in this research as a piezoelectric converter. The multilayer structure of PFC is shown in figure 1. Its core layer comprises of uniaxially aligned piezoceramic fibers of 250 μm in diameter. The fibers are surrounded by a polymer matrix of epoxy resin. This layer is encapsulated by a network of copper electrodes called interdigitated electrodes. The interdigital pattern of the electrodes allows the electric potential to form along the length of the fiber (which is called direction 3), therefore taking advantage of the greater d33 piezoelectric coupling coefficient. On the outside layer there are two thin Kapton® sheets that provide good mechanical protection and electrical insulation.

Figure 1. Structure of the piezoelectric fiber composite (a) microscopic image, horizontal lines: piezoelectric fibers, vertical lines: interdigitated electrodes. (b) Exploded view of layers, from core to exterior (symmetrical): PZT ceramic fibers in epoxy, copper interdigitated electrodes and Kapton film.
Download figure:
Standard image High-resolution imageA relatively small amount of applications has been reported as using PFC in a wearable energy harvesting platform. Fitting piezoelectric fibers into a shoe sole was among the very first attempts to harvest parasitic power from heel striking [14]. Different piezoelectric materials including PFC have been investigated for energy recovery in glove structures [5]. This investigation proves the superiority of PFC over PVDF for the flexible energy harvesting. The performance of PFC and PVDF has also been compared for energy harvesting from renewable sources [15]. In addition, an experimental comparison between several composite piezoelectric materials for power generation has been reported [16]. More recently, hollow PZT fibers that could be directly woven into fabrics have been developed [17]. The majority of researches in this field mainly focus on incorporating PFC in inertia driven mechanisms [13, 18]. To the best knowledge of the authors, none of these applications address the challenge of integrating PFC in a real stretchable and wearable mechanism and none of the published papers presents a theoretical energy conversion model.
The main objective of this paper is to demonstrate, in principle, the potential of using PFC in the chin strap of head-mounted devices to form a flexible wearable mechanism for energy harvesting from jaw movements. Furthermore, this paper presents an energy conversion model of the entire system based on the bond graph method. In this method, the governing differential equations are systematically derived by the graphical representation of the energy flow from mechanical to electrical domains. The bond graph analytical model was used to predict the performance of the system for different stretch levels in the strap. It was also used to find the optimal stretch level and determine the resistive load at which maximum power is harnessed.
The rest of the paper is organized as follows. Section 2 presents the jaw movement energy harvester device. The system model is developed in section 3. The experimental setup and procedure is elaborated in section 4 and the results are discussed in section 5. Finally, conclusions and future research needs are presented in section 6.
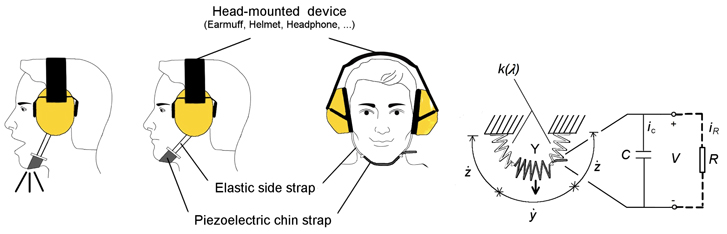
Figure 2. Jaw movement energy harvester and its schematic representation.
Download figure:
Standard image High-resolution image2. Jaw movement energy harvester
The energy harvesting device consists of a flexible piezoelectric element made of PFC that fits below the chin and is attached to a head-mounted device by two elastic rubber straps as shown in figure 2. The head-mounted device is a pair of earmuffs in our case. Other types of head-mounted devices could also have been used, such as tactical helmets, sports helmets or headphones.
Accordingly, the person wearing the device must adjust the strap assembly to a snug fit to keep the strap under tension. Opening the mouth further stretches the side straps and causes: (a) distributed force stress in the PFC contact surface (direction 1) and (b) tensile stress in the PFC cross-section (direction 3). Since the PFC cross-section is much smaller than the PFC contact area below the chin and as the longitudinal piezoelectric coefficient (d33) is usually larger than the transverse piezoelectric coefficient (d31), one can assume that the most electric charge accumulated in the PFC electrodes are from the tensile stress (direction 3). Finally, the electric charge flows through the resistive load and generates the electric current in the circuit. By closing the mouth, the system returns to its initial position and a reverse current of same magnitude is generated.
3. Analytical system modeling
This section gives insight into the energy conversions and transformations taking place as the proposed jaw movement energy harvesting device is in operation. Also, the bond graph model of the system based on these physical energy exchanges is developed.
3.1. Energy chain
The chain of energy conversions and transformations is illustrated in figure 3. The two moments when energy conversions occur are in muscles and the piezoelectric chin strap. Energy conversion implies that energy is converted from one type of energy to another. Thus, chemical energy available in the bonds of molecules in food is the starting point. Motor proteins of the muscles are powered by the hydrolysis of adenosine tri-phosphate which converts chemical energy into mechanical work. The work is done when the force exerted by a muscle results in movement. The movement leads to a mechanical strain in the elastic side straps. The piezoelectric chin strap can convert kinetic energy of the strain into electric power. In addition to these energy conversions, figure 3 also illustrates the energy transformations. These are solely chemical, mechanical or electrical. For instance, metabolism is the set of chemical transformations within the cells that allows organisms to live. In the mechanical segment, the elastic side straps transform the jaw movements into strain. Finally, the conditioning circuit transforms the electric charge produced in the piezoelectric element to the electric current that suits the load.
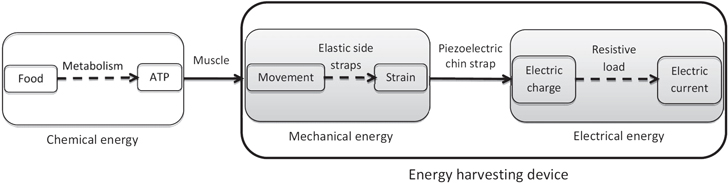
Figure 3. Energy chain in jaw movement energy harvesting.
Download figure:
Standard image High-resolution image3.2. Bond graph
The bond graph model of the energy harvesting device is presented in figure 4. It is composed of three junctions, two transformers and several branches. In this figure,  is the spring constant of the elastic side straps, m, b, Y, and C are respectively the mass, damping ratio, Youngʼs modulus and capacitance of the piezoelectric strap, and R is the load resistance.

Figure 4. Bond graph representation of the energy harvesting system.
Download figure:
Standard image High-resolution image
Figure 5. Experimental setup.
Download figure:
Standard image High-resolution image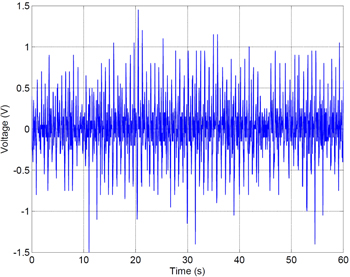
Figure 6. Voltage generation of the jaw movement energy harvester measured by 10X oscilloscope probe for the normal gum chewing when  = 900 kΩ and
  .
.
Download figure:
Standard image High-resolution imageAt the far left branch, the source element (S) is located. It represents the jaw movement as a general source of power that, depending on the subject, can present any relationship between the force (f) that it applies and the velocity at which it excites the energy harvesting device ( ). The left 0-junction models the strap assembly and splits
  between the piezoelectric chin strap (
 ) and the elastic side straps (
 ). The elastic material of the side straps becomes progressively stiffer as it deflects and hence is modeled by a nonlinear stiffness element,
  , where λ is the side strap stretch ratio and is defined as the ratio between the strapʼs final length (Zf
) after putting on the device and its initial (free) length (Z0) before putting on the device:
, where λ is the side strap stretch ratio and is defined as the ratio between the strapʼs final length (Zf
) after putting on the device and its initial (free) length (Z0) before putting on the device:

TF1 transforms the piezoelectric element deformation to the strain. Therefore, the modulus of the first transformer is  and satisfies the following relations

in which l, w and t are respectively length, width and thickness of the piezoelectric element. The mechanical part of the piezoelectric system is modeled by the middle 1-junction, where the input stress (α) is distributed among piezoelectric transformer (σ) and elements that represent inertial (σm
), damping (σb
) and elastic ( ) properties of the piezoelectric material. Also, TF2 models the piezoelectric transducer whose constitutive equations are given by

where δ is the strain, d is the piezoelectric strain constant, E is the electric field, D is the electrical displacement, and ε is the permittivity of the piezoelectric material. In the right-hand side of equation (3), the terms containing d indicate the energy conversion from one energy domain to another. Therefore, the modulus of TF2 is defined as  , and gives the following relationships between mechanical and electrical variables

where v is the voltage and  is the derivative of strain. Finally, the right 0-junction represents the electrical part of the system and divides the produced current (i) between the piezoelectric capacitance (iC
) and the load resistance (iR
).
is the derivative of strain. Finally, the right 0-junction represents the electrical part of the system and divides the produced current (i) between the piezoelectric capacitance (iC
) and the load resistance (iR
).
In each bond graph junction, flow and effort are expressed in terms of different variables: f and  are the pair of power variables for the left 0-junction. σ and
  are the state variables in the piezoelectric 1-junction. However, the multiplication of these two variables is equal to the power of the unit volume and hence the total power needs to be corrected by multiplying with the volume of the piezoelectric material [19]. The electric power in the right 0-junction is considered as the product of v and i.
Considering the direction of power arrows and the property of junctions, the three following equations are derived

Considering the properties of the bond graph elements, integrating the first equation and substituting the transformer relations (equations (2) and (4)) into set of equation (5), the dynamic model of the system can be expressed as
Taking the Laplace transform of equation (6) and using X, Δ, F and V as the respective transformed variables of x, δ, f and v yields
where s is the Laplace variable. Combining the relations in equation (7) and rearranging certain terms yields the relationship between the jaw movement input and output voltage as
The output voltage can be calculated for a given input vibration frequency. The Laplace variable is substituted by  and
and  is the square of the natural frequency of the converter. The system damping ratio is defined by
  . The square of the piezoelectric coupling coefficient is expressed as
  . Making these substitutions and solutions for V yields

where the frequency dependent terms of A, B and G are defined by
4. Experimental study
4.1. Description of the experimental setup used
The experimental test setup is shown in figure 5 and consists of a  digit multimeter (Agilent Technologies, CA, USA), and a breadboard with the required electric components for the test. The energy harvesting device is composed of a pair of earmuffs (Headguard, France) and a strap assembly. The core of the strap is a rectangular piezoelectric element, PFC-W14 (Advanced Cerametrics, NJ, USA) for which the engineering properties are presented in table 1
. Two side straps, made of a braided polyester elastic, are attached to the flexible piezoelectric chin strap by two clips.
digit multimeter (Agilent Technologies, CA, USA), and a breadboard with the required electric components for the test. The energy harvesting device is composed of a pair of earmuffs (Headguard, France) and a strap assembly. The core of the strap is a rectangular piezoelectric element, PFC-W14 (Advanced Cerametrics, NJ, USA) for which the engineering properties are presented in table 1
. Two side straps, made of a braided polyester elastic, are attached to the flexible piezoelectric chin strap by two clips.
Table 1. Properties of PFC-W14
| Property | Symbol | Unit | Value |
|---|---|---|---|
| Dimensions |

|
mm | 132×14×0.3 |
| Charge coefficient | d | pC/N | 550 |
| Youngʼs modulus | Y | GPa | 24.4 |
| Capacitance | C | nF | 10 |
| Mass | m | kg | 0.11 |
| Damping ratio | ζ | — | 0.1 |
4.2. Experimental procedure
Given the properties of the piezoelectric material, the tension in the piezoelectric strap can be controlled by regulating its initial stretch in the side straps by adjusting the length of the side straps before putting on the device (Z0). Since the prescribed strap tension influences the chewing pattern and rhythm, it is quite reasonable to assume that the jaw movement cycle frequency (ω) and the maximum deformation amplitude of the strap (X) are functions of the stretch in the strap (λ). These two variables as well as  are needed to solve equation (9) and should be measured before or during the test.
To measure X, a simple mechanism was designed: it is composed of a sufficiently long unstretchable cord that is attached to the earmuffs just like the main strap is. A plastic nut allows the cord length to fit around the chin. When the subject starts moving his jaw, similar deformations are applied to both elastic strap and non-elastic cord. The elastic strap stretches, and the nut allows the cord to lengthen by sliding through the plastic nut. Hence, knowing the final and initial length of the cord, one can measure the maximum stretch in the strap assembly. Also, ω can be simply calculated by counting the number of chews during the period of measurement.  can be measured before the test as a function of the stretch in the strap by applying a force through a dynamometer and measuring the resulting elongation.
The following experiments were designed to test the performance of the energy harvesting device and validate the effectiveness of the developed bond graph model.
4.2.1. Determining the optimal load resistance
The first experiment was designed to find the optimum load resistance where the power output is maximized. The side straps were adjusted to maintain sufficient tension to secure the device in its normal position below the chin ( ). The test subject was asked to chew gum for 60 s and the maximum output voltage was measured for a given resistor. This test was repeated for an assortment of resistors between 1 kΩ and 20 MΩ in value. The maximum harvested power was then calculated for a given λ and the corresponding resistance value was consequently chosen to represent the load for all λ values, because ω is assumed to slightly vary with λ.
4.2.2. Assessment of the overall performance
Once the optimum load resistance value was found, the main experiment focused on calculating the power delivered to this load for different stretch levels in the side straps. For each stretch level the subject chewed gum for 60 s adapting his chewing manner with the prescribed tension. The voltage of the load corresponding to each stretch level was then measured using the digital multimeter and the harnessed effective power was calculated using

5. Results and discussions
The voltage output of the piezoelectric energy harvester device during 60 s of the normal gum chewing was measured using 10X oscilloscope probe and the results are shown in figure 6. These results were obtained for  = 900 kΩ and
  .
.
Also, the power output of the energy harvesting device is illustrated in figure 7 as a function of the resistance values when  . To plot the bond graph predictions curve, equation (9) was first solved for the voltage and then the power was calculated by using equation (11). The experimental measurements show that the maximum power transfer happened at
  = 900 kΩ. According to figure 7, although the bond graph model predicts a slightly lower resistance value for the power transfer peak, its curve was sufficiently close to the experimentally measured power. It validates the developed bond graph model for optimization of the load resistance in the piezoelectric energy harvesting applications.
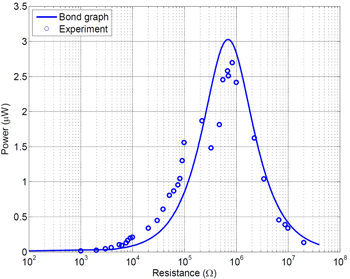
Figure 7. Comparison between the bond graph predictions and the experimentally measured generated power (P) as a function of the load resistance (R) for  .
.
Download figure:
Standard image High-resolution imageThe performance analyses were subsequently carried out and ω and X are presented in figure 8. In this figure, the horizontal axis is the side strap stretch ratio (λ) that is a measure of the tension in the strap. According to figure 8 and considering the fact that the test subject was free to adapt his chewing pattern with the level of stretch in the strap, one can observe that ω slightly decreases as λ increases. However, the trend for X is mixed. It first increases, then remains nearly constant and finally decreases. Therefore, three distinct levels of strap stretch can be identified based on X: low stretch  , medium stretch
  and high stretch
  .
.
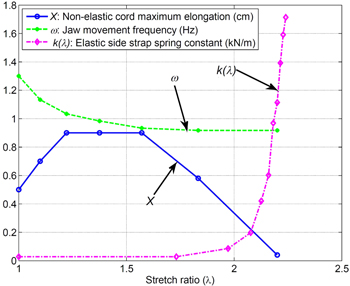
Figure 8. Experimental parameters required to solve equation (9): non-elastic cord maximum elongation (X), jaw movement frequency (ω), and elastic side strap spring constant ( ) as a function of the side strap stretch ratio (λ).
Download figure:
Standard image High-resolution imageFigure 8 also includes the plot of  . This curve exhibits an exponential increase at the higher stretch ratios, because rubber, as the main component of the elastic side strap, has an intrinsic nonlinear hardening characteristic. The increase in
  at high stretches (when the strap is tight) results in the remarkable reduction in X because of the extra effort needed in order to open the jaw against the higher strap tension. On the other hand, X increases at low stretches (when the strap is looser) mainly due to the insufficient tension that causes the strap to be displaced instead of being stretched. The test subject could confirm this type of strap displacement during the test. In addition, no important changes in X can be observed at medium stretches.
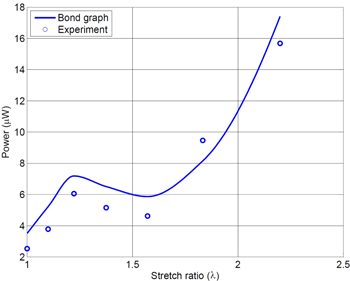
The variation of power generation versus stretch ratio is represented in figure 9 for both bond graph model predictions and experimental measurements. To plot the bond graph curve, the experimental results presented in figure 8 were employed to solve equations (9) and (11). As shown in this figure, the power curve increased at both low and high stretch levels, while it decreased at medium stretch ratios. For low stretches, the effect of increase in X is larger than the amount of decrease in ω and hence the generated power increases in proportion to the stretch ratio. At medium stretches, power generation decreases mostly because of the decrease in ω while X is mostly constant. Finally, despite the substantial reduction in X at high stretches, power generation still increased by λ due to the remarkable increase in  .
.
Figure 9. Comparison between the bond graph predictions and the experimentally measured power (P) delivered to the load of R = 900 kΩ (optimum resistive load for  ) as a function of the side strap stretch ratio (λ).
Download figure:
Standard image High-resolution image
According to figure 9, the experimental results match the curve predicted by the bond graph model. Therefore, it can be successfully used for modeling other flexible piezoelectric energy harvesting mechanisms. It predicts a local power peak of 7 μW at  for the low and medium λ. Although this value is lower than the power harnessed for the high λ, it guarantees the comfort of the wearer at all times.
6. Conclusions and future research needs
This research opens the possibility of harvesting energy from jaw movements to sustainably power small-scale electronic devices. An energy harvester device containing the piezoelectric chin strap was designed, a bond graph model was developed and a prototype was fabricated and tested. The results show that the optimum resistance value of the electrical load is about 900 kΩ for  . The maximum generated power for the optimum resistive load was theoretically and experimentally investigated and the strap stretch is found to be the most significant design parameter. According to the experimental findings, although increasing the strap stretch can increase power generation, the increased effort required to chew might negatively affect power generation. Therefore, the need for energy recovery from the jaw movements should remain within reasonable boundaries so as to give precedence to the comfort of the wearer. It appears that the best results can be achieved when the strap stretch ratio is about 1.2. For this ratio, the maximum power transfer is about 7 μW. The developed bond graph model presents a satisfactory match with the experimental measurements and this emphasizes the effectiveness of the proposed approach for modeling the human power energy harvesting system.
Future research needs
The quantity of power generated by the designed jaw movement energy harvester device is still too little to be directly adopted in practical applications. Future designs may focus on increasing the number of piezoelectric elements to supply the demanded power of small-scale and wearable electronic devices. Moreover, an appropriate power management circuit would be required to charge a tiny rechargeable battery integrated into the device. Finally the entire strap assembly should be encased in such a way that would make it totally biocompatible.
Acknowledgements
The authors would like to thank Sonomax Technologies Inc. and its 'Industrial Research Chair in In-ear Technologies' for its financial support and for providing specific equipment required for the experimental setups.