
Abstract
A probabilistic framework for location and size determination for delamination in carbon–carbon composites is proposed in this paper. A probability image of delaminated area using Lamb wave-based damage detection features is constructed with the Bayesian updating technique. First, the algorithm for the probabilistic delamination detection framework using the proposed Bayesian imaging method (BIM) is presented. Next, a fatigue testing setup for carbon–carbon composite coupons is described. The Lamb wave-based diagnostic signal is then interpreted and processed. Next, the obtained signal features are incorporated in the Bayesian imaging method for delamination size and location detection, as well as the corresponding uncertainty bounds prediction. The damage detection results using the proposed methodology are compared with x-ray images for verification and validation. Finally, some conclusions are drawn and suggestions made for future works based on the study presented in this paper.
Export citation and abstract BibTeX RIS
1. Introduction
Composite materials are increasingly being used in many applications, such as rotorcraft, aerospace, automobiles, and civil engineering structures, because of their low weight and high strength properties. However, there are certain limitations that make them difficult to be used in safety critical applications. Specifically, fatigue failure in composites is not easily detected and is poorly understood compared to that in metallic materials. For example, delamination damage may appear within a composite plate due to impact or cyclic loadings. Due to the embedded nature of delamination damage, it is always required to use expensive (time and labor) nondestructive evaluation (NDE) techniques. Currently, there are several deterministic nondestructive techniques (NDT) available for the delamination diagnosis, such as thermography [1, 2], ultrasonics [3], x-ray [4], and eddy currents [5, 6]. A comprehensive review of these methods for delamination location and size detection is presented in [7]. Most NDE methods require that the specimens should be maintained under certain strict experimental conditions for a reliable ex situ damage detection. Alternatively, because of the low cost and high frequency properties, Lamb wave-based damage detection methods have been widely used for structural health monitoring in metallic plates [8–12]. Lamb waves can propagate in thin plates without significant dispersion in certain modes [13]. Using proper mode selection, piezoelectric sensor networks can be used for damage inspection of delamination in composite structures [14, 15]. The advantage of these methods lies in that they allow for in situ monitoring of a structure's health conditions through embedded or surface mounted sensors. In these techniques, damage features are extracted from the received Lamb wave signal using signal processing algorithms. These features are generally based on observations of several characteristics of the received signal (e.g., the attenuation, phase shift, energy) which indicate changes from baseline data [16].
For Lamb wave-based detection methods, there are two common approaches [16]: (a) pulse-echo and (b) pitch-catch. Using the pulse-echo based approach, damage location can be estimated by methods like triangulation [17, 18] or cumulative coefficient change [19]. The pulse-echo based approach is also able to detect damage intensity if the damage location is known [20]. However, most existing damage detection techniques based on Lamb waves are deterministic and cannot systematically include uncertainties, such as measurement uncertainty, and model parameter uncertainty in the damage diagnosis. Therefore, a probabilistic damage detection method for in situ applications is proposed in this study. A novel method is presented here to simultaneously estimate damage location and size, as well as the corresponding uncertainty bounds. To the best knowledge of the authors, there are very few studies that can achieve this goal concurrently. Another important new feature is the use of Bayesian inference for the construction of a damage imaging (i.e., Bayesian imaging), which directly relates the most probable point of damage with sensor signals. This is a probabilistic description for the damage location identification, which is fundamentally different from most triangulation-based damage detection algorithms.
This paper is organized as follows. First, the Bayesian theorem is briefly introduced and a probabilistic delamination localization and size detection framework is developed using the proposed Bayesian imaging method. Following this, a Lamb wave-based test and signal analysis setup is presented for diagnostic feature extraction. Next, experimental measurement is presented to validate the proposed Bayesian imaging method for delamination size and location detection. Damage diagnosis uncertainty bounds are simultaneously generated. Finally, some conclusions are drawn and suggestions made for future works based on the study presented in this paper.
2. Damage diagnosis algorithm using Bayesian imaging method
Bayes' theorem is widely used in image processing applications, where it combines the prior distribution of a realistic image with new measurement data to improve image resolution or segmentation [21, 22]. It is also used to compress the information needed to reconstruct the image by optimizing the basis-function weights, which is a powerful tool to deal with the problem of limited measurements [23]. These methods are briefly explained below.
2.1. Bayes' theorem
Bayes' theorem is commonly used for probabilistic inference or a learning process. It combines a prior belief about system/process parameters and current system response to provide a reasonable estimate of current parameter distribution. Let p(θ) denote the prior distribution of parameters θ in a model M(θ). According to the Bayes' theorem, the posterior distribution of θ is given as

where p(x'|θ) is the likelihood function, which reflects the observed current system response x' given parameters θ, and q(θ) is the posterior distribution of updated parameters. In practice, it is necessary to introduce an error term to account for measurement noise  and model uncertainties τ in the estimation. In our formulation, the relationship between in situ measurements x' and physics M(θ) is expressed as

Assume that the error term e is a zero mean normal variable [24, 25], which can be expressed as e ∼ N(0,σe). Therefore, the likelihood function p(x'|θ) can be expressed as
where n is the number of available measurements. Substituting equation (3) into equation (1), the posterior distribution of parameter θ can be expressed as
Then the posterior distribution of the parameter θ can be approximated by the samples drawn by the Markov chain Monte Carlo (MCMC) simulation.
2.2. Damage diagnosis and Bayesian imaging development
In damage detection, the available sensor signal can be periodically accessed during servicing operations for the structures and can be used to extract signal features using appropriate signal processing techniques. To estimate damage size and location, a model M(θ) describing the relationship between the signal features and damage information is needed, which can be developed using information extracted from available experimental datasets. Furthermore, a likelihood function for the updated parameters, i.e., delamination size and location, is constructed considering both measurement and model uncertainties. The posterior belief about damage is then estimated from the posterior distribution of the updated parameters. To simplify the problem, the delamination area is approximated with a semi-elliptical shape based on observations from x-ray images of the delaminated coupons. In this case, the parameter vector θ includes the delamination geometric center coordinate (x0,y0) and the delamination size a. It should be noted that, theoretically, two parameters are required to fully describe the shape of elliptical delamination. In the current study, a fixed aspect ratio is assumed based on x-ray images and only one parameter a is used to describe the size of the delamination. Since no prior belief is available for any of these three parameters, the prior distributions of x0,y0 are assumed to be of uniform distribution over the entire target region where the delamination may appear. The delamination size distribution is uniformly distributed from zero to a large size (e.g., the physical length of the specimen as the largest possible delamination size). A very small quantity (i.e., 0.001 mm) for the delamination distribution lower bound is used to avoid numerical difficulties. The overall diagnostic framework proposed here is shown in figure 1.

Figure 1. Flowchart for the damage diagnosis method.
Download figure:
Standard image High-resolution imageIt must be noted that for Bayesian updating, it is nontrivial to derive an analytical solution if the posterior distribution is non-parametric or very complex, which is the case in this problem. Therefore, the MCMC method is used to draw samples. Detailed discussion on MCMC method can be found in for example [26–29] and is not discussed here.
The key idea of the proposed BIM is that the entire specimen is discretized into many small cells (e.g., with size 1 mm × 1 mm for the current study) and each cell is assigned an associated probability of damage. The model M(θ), i.e. the regression model, is used to build the likelihood function by using the differences between the model predictions and true observations. Next, the overall posterior distribution of the parameters (i.e. x0,y0,a) can be obtained by combining the prior information about the parameters. The marginal posterior distribution of each parameter is estimated by the samples generated using the MCMC. Given the parameter samples, the probability of damage in each cell is computed using the ratio of the number of samples falling into each cell to the total number of samples. Following this, the damage probability distribution can be used to construct an image that directly represents the damage location and size.
3. Delamination diagnosis experiment using piezoelectric sensor
The proposed BIM methodology is demonstrated using fatigue cycling data from an experimental testing. Experimental datasets are used to train the model M(θ) to get the likelihood function. Bayesian updating results are then compared with x-ray images for model verification and validation.
3.1. Fatigue testing experiment setup
Fatigue experiments were conducted using composite coupons with 12 plies. Torayca T700G uni-directional carbon prepreg material was used for 15.24 cm × 15.24 cm dog bone geometry coupons and an edge notch (5.08 mm × 19.3 mm) is introduced to induce stress concentration, as shown in figure 2.
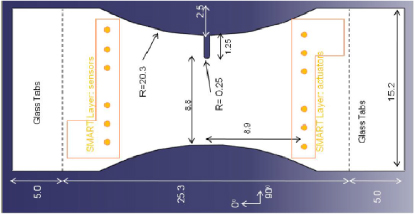
Figure 2. The geometry of the dog bone shaped coupon (unit: cm).
Download figure:
Standard image High-resolution imageThese experiments served several objectives: (i) collection of run-to-failure data with periodic system health data using PZT sensors, (ii) collection of ground-truth data (x-ray imaging) for the delamination to validate the sensor measurement analysis, (iii) accounting for variations between samples of the same internal structure (layup), and (iv) characterizing variations between samples of different internal structure. Three symmetric layup configurations were chosen to account for the effect of the ply orientation: Layup 1: [02/904]2 Layup 2: [0/902/45/−45/90]2, and Layup 3: [902/45/−45]2. Two six-PZT sensor SMART Layers from Acellent Technologies, Inc. (figure 3(a)) were attached to the surface of each sample. In figure 3(a), actuators 1–6 were used to actuate the PZT signal and sensors 7–12 were used to collect the corresponding signal propagation through the plate. Every actuator and sensor combination acted as a diagnosis path to interrogate the target area. Optimization of sensor numbers and locations is an important component for SHM in practical applications. In the current study, the location and number of sensors is pre-determined and fixed for all experimental testing. Six actuators and receivers will provide different sensor paths and information if the delamination front propagates far away from the notch. No optimization is performed for the number of sensors in this case. A more detailed description about these experiments is given in [30]. Figure 3(a) shows such a path from actuator 5 to sensor 8, which is represented as path 5⟶8. The other paths follow the same rule as above in what follows.
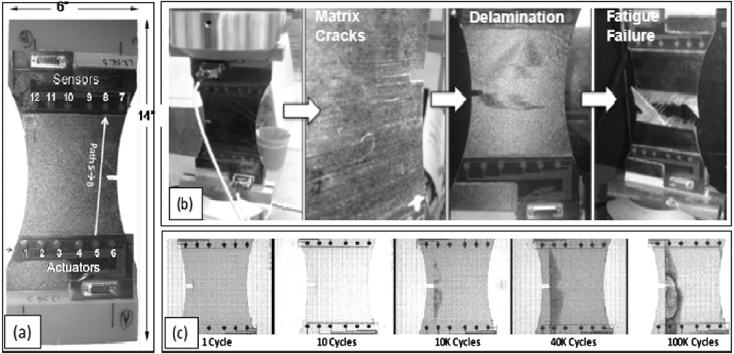
Figure 3. (a) Coupon specimen, SMART layers location and diagnostic path from actuator 5 to sensor 8. (b) Development of matrix cracks and delamination leading to fatigue failure. (c) Growth in delamination area with increasing load cycles.
Download figure:
Standard image High-resolution imageUsing this configuration of sensor network, all actuators are used to actuate the Lamb wave, which is received by other PZTs acting as sensors. It was expected that the growth in delamination size would be captured in the received signals from a particular diagnosis path that covered the delamination area (e.g. path 5⟶8), and this was validated by comparison of features and delamination size with those in the literature [30]. For diagnosis path 5⟶8, the signal received by sensor 8 at different loading cycles is plotted in figure 4. As can be seen in figure 4, an increase in delamination size is captured by monotonic trends in some signal features such as amplitude, correlation coefficient, and phase change between sensed signals for pristine and damaged conditions. Conceptually, a change (decrease) in normalized amplitude reflects the energy dissipation due to the damage. The phase angle change is attributed to the increased wave traveling distance induced by the damage. The correlation coefficient change reflects the signal perturbation due to the new waves generated at the damage surfaces due to reflections [16]. All of these features are computed by comparing the received signal from a pristine coupon, called the baseline, and the signals from damaged coupons.

Figure 4. Signal received at sensor 8.
Download figure:
Standard image High-resolution image3.2. Data processing
Observations from x-ray images of the damaged coupons reveal that damage tends to originate and grow from the notch tip on the dog bone coupon and approximately conforms to semi-elliptical shapes for Layup type 2. Therefore, to simplify the geometry, damage shapes are modeled as half-elliptical lobes in this paper. For the PZT sensor network and the signal analysis described above, two parameters are used to describe these half-elliptical shapes that would possibly affect the received signal according to our hypothesis in this paper. These parameters are pictorially depicted in figure 5. The green ellipse is the delamination area as observed from the x-rays and the red ellipse envelope is our approximation to cover the entire area, whose semi-minor axis a is used as a damage parameter for delamination size. The aspect ratio for the ellipse area is around 2.5 based on the experimental x-ray image. The distance from the delamination center to the diagnosis path (direct path for wave propagation between a sensor and an actuator) is denoted by d. For a given layup specimen (e.g., L2S11_F in this case), features can be extracted from the collected PZT datasets. Corresponding features (normalized amplitude, correlation coefficient, and phase change) are extracted from Lamb wave data from actuator 5 to sensors 8–12.

Figure 5. X-ray image and schematic representation delamination.
Download figure:
Standard image High-resolution imageIt is found that the correlation coefficient and phase change features are more sensitive to the distance compared to the normalized amplitude. For example at a fixed distance, these two features have a monotonic relationship with the delamination size, which is consistent with the trend in figure 4. In order to use these two features in the proposed BIM, a regression model is introduced to express the relationship between these features and delamination size and position. A generic expression can be written as

where a is the delamination size, and d is the distance from the delamination center to the direct diagnosis path. It should be noted that equation (5) is a generic expression and not limited to a specific function type. In this study, a polynomial regression model is used. Using the trend in the datasets, the model used for these two features is given as

where fi(d) = βi1 × ln(d) + βi2 for the correlation coefficient. βij are regression coefficients, which can be obtained by learning from the training datasets. After tuning these coefficients, the experimental and curve fitting results are shown as the solid curve in figure 6. The yellow circular dots are the validation data points and the rest are used for the training. It can be seen that the simple regression model gives satisfactory results except for the regions where the delamination is far away from the diagnostic path.
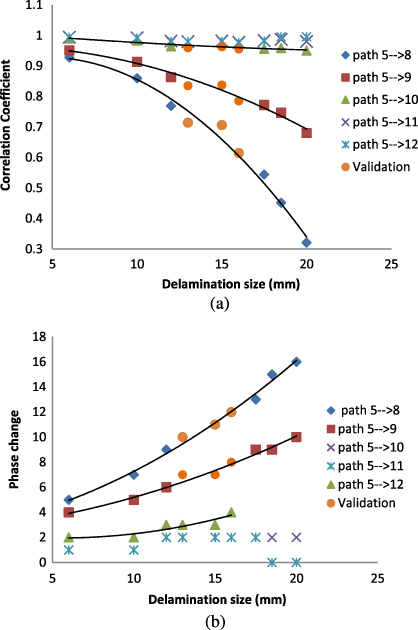
Figure 6. The experiment data and curve fitting result. (a) Correlation coefficient. (b) Phase change.
Download figure:
Standard image High-resolution imageThe data analysis presented above is from a single actuator (actuator 5). Similar trends are observed for datasets from other actuators. For a given delamination defect, damage information from different actuators and wave paths can be combined to provide a better estimation of the delamination size and location. The following section presents an example of the BIM demonstration and validation.
4. Demonstration example
As described in section 2, model M(θ) is needed to show the relationship between damage information and signal features, which can be described by the fitting model shown in equation (6). The posterior belief about the damage is estimated by the posterior distribution of the updated parameters. Parameter θ represents the delamination center coordinate (x0,y0) and delamination size a. Since no prior belief is available for these three parameters, the prior distribution of location is assumed to be x0 ∼ U(93.5,259.5), y0 ∼ U(25,125), which covers all the possible locations where delamination may appear. The coordinate definition of this specimen is provided in figure 7. The distribution for initial delamination size parameter a is assumed to be a ∼ U(0.001,18), where U means uniform distribution. The likelihood function is developed based on the difference between the fitting model and real experimental data. Measurements between actuators 5, 6 and sensors 8, 9, and 10 are used for Bayesian updating since the corresponding paths are likely to cover the delamination hot spot in this case (see table 1). The detailed connection between this experiment and the derivation is given in table 2. It should be noted that each updating iteration incorporates one measurement in the BIM framework. For a fixed number of fatigue cycles, signals can be collected for multiple actuator–sensor paths. Each sensor path will provide a measurement of the damage and can be used to update the damage location and size. The aspect ratio for the delamination area is assumed to be 2.5 based on the experimental x-ray image.

Figure 7. Definition of the sample reference coordinates. The rectangular dashed area is used to show the Bayesian image in the following figures.
Download figure:
Standard image High-resolution imageTable 1. The sensor measurements for given delamination.
| Sensor | Actuator | |||
|---|---|---|---|---|
| 5 | 6 | |||
| Correlation coefficient | Phase change | Correlation coefficient | Phase change | |
| 8 | 0.7142 | 10 | 0.6858 | 10 |
| 9 | 0.8351 | 7 | 0.8279 | 7 |
| 10 | 0.9595 | 3 | 0.9476 | 4 |
Table 2. The explanation of theoretical symbols using experimental quantities.
| Theory symbols | Experiment |
|---|---|
| θ | [x0,y0,a] or [d,a] |
| M(θ) | feature = f(d,a) |
| x' | Features (e.g. phase change or correlation coefficient) |
The posterior distributions of parameters (x0,y0,a) can be estimated by the samples drawn using the MCMC, which updates the belief about the delamination location and delamination size at each updating iteration. At the same time, corresponding median and uncertainty bound predictions are computed to describe the accuracy of each updating result. Delamination location estimates after each updating iteration are shown in figure 8.
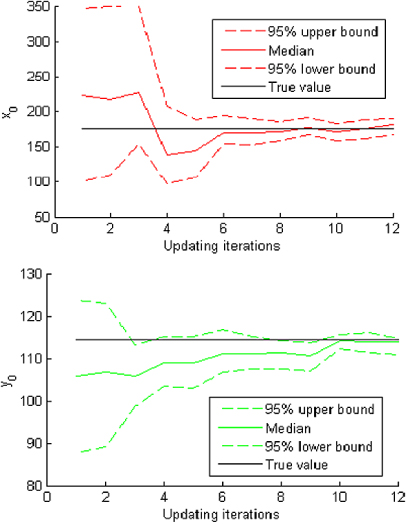
Figure 8. The delamination location updating.
Download figure:
Standard image High-resolution imageAs shown in figure 8, the estimated delamination location becomes closer to the true location as more data are used for the Bayesian updating. Additionally, the uncertainty bounds narrow down as more measurements become available. Figure 9 illustrates the Bayesian imaging of the damage probability at each cell of the specimen. In the proposed method, the probability of damage of each cell is used to represent the most probable point of damage location. The relative difference between cells, rather than the absolute value, is more related to this measure. Thus, the cells with relative high damage probability in the last updating represent the most probable points/regions with damage, which is very close to the true location as shown in figure 9(d).
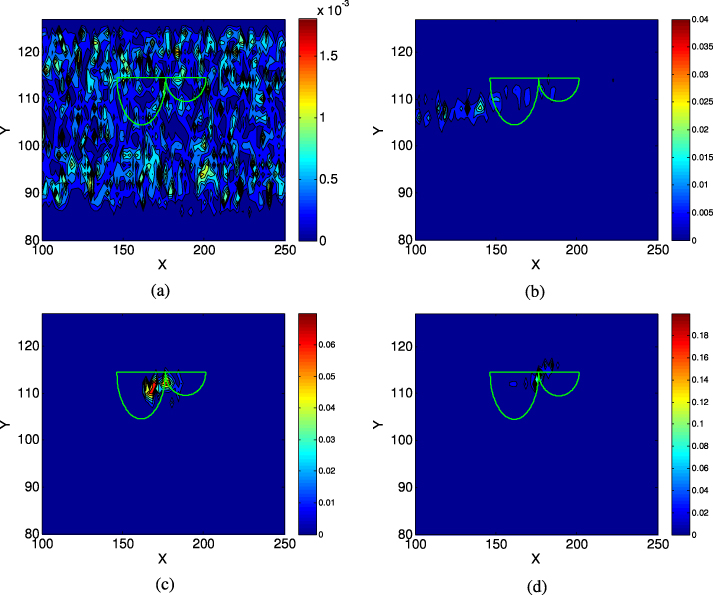
Figure 9. Bayesian images of the damage probability at each cell of the specimen. (a) One updating iteration. (b) Four updating iterations. (c) Eight updating iterations. (d) Twelve updating iterations.
Download figure:
Standard image High-resolution imageSimultaneously, delamination size is also updated, as shown in figure 10. By incorporating the location and size information, the estimated delamination area can be constructed. Figure 11 gives the comparison between the true delamination from the x-ray images and the updated results using the proposed BIM.

Figure 10. The delamination size updating.
Download figure:
Standard image High-resolution image
Figure 11. The comparison between the true value and updating result. (a) One updating iteration. (b) Four updating iterations. (c) Eight updating iterations. (d) Twelve updating iterations.
Download figure:
Standard image High-resolution image
As shown in figure 11, the predicted delamination is reconstructed based on the location and size prediction after each updating iteration. It can be observed that after 12 updating iterations the estimated damage area and size completely cover the true delamination observed from x-rays. It can also be noticed that the uncertainty bounds become narrower as more observations become available, which is consistent with the results shown in figures 8 and 10.
It should be noted that the generality of this proposed framework is validated by the fatigue testing data for two other specimens of the same layup plates. The final delamination location and size updating results show good agreement with the true experimental x-ray image. The detailed updating procedures for these two specimens are omitted here for brevity and clarity.
5. Conclusions
A new probabilistic damage size and location estimation algorithm based on in situ measurements is proposed, which incorporates the Lamb wave-based signal features into the Bayesian updating framework. The results of the proposed method are validated from experimental measurements from x-ray images. Based on the results from the current study, several conclusions are drawn:
- (1)The Lamb wave propagation based SHM method is able to capture the delamination size and location information by using appropriate signal features.
- (2)The correlation coefficient and the phase change features in the received signal change as the damage size and location change. The change is very small if the sensor path is far away from the damage locations.
- (3)The proposed BIM can simultaneously estimate the damage size and location information with corresponding uncertainty bounds. These uncertainty bounds shrink down after about 6–8 updating iterations in the current study.
- (4)The proposed BIM framework is flexible and is shown to be applicable to multiple specimens with very different feature trends.
Only two features were used in the proposed BIM to demonstrate the methodology. Further efforts are required to incorporate more and/or better features to give a better detection performance. The damage shape was approximated with a semi-elliptical shape for a simpler model. For the general damage detection for arbitrary shape delamination, it is better to have the sensor paths cover both horizontal and vertical directions. Thus, features from different direction sensor paths will show different sensitivities to different dimension size parameters. Large uncertainties due to different specimen layups, experimental procedures, testing environments, and manufacturing variations need further investigation before this technique can be utilized for practical applications.
Acknowledgments
The research reported in this paper was partially supported by the NASA through Global Engineering and Materials, Inc. (GEM) under the project NNX12CA86C. The support is gratefully acknowledged.