

Abstract
Pulsed cavity ring-down spectroscopy (CRDS) is a direct absorption, highly sensitive, versatile technique suitable for the analysis of a wide range of plasmas. CRDS belongs to a wide class of cavity-enhanced spectroscopies. This work briefly describes the basic principles of CRDS and summarizes the main literature specifically related to applications for atmospheric pressure plasma jets (APPJ). Emphasis is given to the temporal resolution and pulsed character of the plasma sources. As an example we present in more detail the determination of metastable helium density in the  state produced in a single-electrode atmospheric pressure plasma jet driven by a pulsed high-voltage waveform. Measured He(
 ) number densities ranged from
  near the capillary orifice to
  at a distance 3.5 mm downstream.
Export citation and abstract BibTeX RIS
1. Introduction
Atmospheric pressure plasma jets (APPJ) are attracting more and more interest as their technological applications spread into diverse areas from biomedicine [1–5] and the food industry [6–10] to material processing [11–16]. Each particular application poses unique demands on plasma source design by which the plasma content is tailored. During plasma source development and treatment processes, an analysis of APPJ is needed to obtain information about plasma content and feedback on plasma-target interaction [17]. It should be noted that the interaction of non-thermal, cold APPJs with various target materials can be very weak, adding additional atoms and molecules to the plasma jets at trace level [18]. Low-temperature atmospheric pressure plasma jets present a surface treatment tool characterized by low energy input and mild thermochemical impact, making it useful in the processing of sensitive (bio)materials.
Detection methods applied to APPJs include classical optical emission spectroscopy (OES) [19–23], laser-induced fluorescence (LIF) [24, 25], laser absorption spectroscopy (LAS) [26], two-photon absorption laser-induced fluorescence (TALIF) [27, 28], ICCD fast imaging [29, 30], mass spectrometry [31–33], quantum cascade laser absorption spectroscopy in the mid-infrared [34], Fourier-transform infrared spectroscopy (FTIR) [35] and Thomson scattering [36, 37]. Recently, the determination status of the concentrations of active species in atmospheric pressure non-equilibrium plasma jets by various optical methods has been reviewed by Lu and Wu [38].
There is a clear need for diagnostics of the main plasma content, as well as of the trace elements which appear as a result of plasma interaction with various materials. Due to the character and low excitation energy of cold plasma, those elements might not often be detectable using emission techniques since only a small fraction of the overall population reside in excited states [18]. Therefore, highly sensitive absorption techniques are preferable to emission spectroscopies. Cavity ring-down spectroscopy (CRDS) is an absorption technique which is fundamentally different from other conventional optical techniques such as LIF or TALIF. CRDS has been reviewed in several papers so far [39–41], and many variants of cavity-enhanced spectroscopies (CES) have been proposed [42–54].
In the present paper we provide an overview of the principles of CRDS and existing applications of CRDS for atmospheric pressure plasma jets. We also demonstrate its usage in the case of mapping helium metastable density within a single-end electrode APPJ in more detail.
2. Principles of cavity ring-down spectroscopy
Classical absorption techniques are based on the measurements of the decrease in light beam intensity as the beam passes through an absorbing medium. In the case of weak and spatially homogenous absorption, the intensity of light after it has passed through an absorbing region is given by the Beer–Lambert law:

Here,  is the input light intensity,
  is the absorption coefficient (related to the absorbing medium concentration) and
  is the absorption path length. Thus, by measuring the input and output of light intensities, the absorption coefficient
  can be obtained. However, in the case of small
  and/or very weak absorption, the difference between
  and
and  will be of the order of the fluctuations in these two intensities and the calculated value of the absorption coefficient
  will be almost completely unreliable. Sensitivity and minimum detectable atomic density are therefore limited by light source stability. One possible solution for measuring in such unfavourable conditions is to place the absorbing medium between two parallel and highly (>0.999) reflective mirrors (forming an optical resonator cavity). Thus, due to multi-reflections of the light beam within the cavity, the effective optical path
  will be increased by a factor of several hundred and the difference between
  and
and  will be amplified leading to higher signal-to-noise ratio. This kind of approach forms the basis for a broad class of direct absorption techniques known as cavity-enhanced spectroscopies (CES) [55], one of which is CRDS.
2.1. Measuring lifetimes
The CRDS introduces one additional feature: as opposed to measuring the ratio of input and multi-pass output light intensities ( and
and  ), it is focused on measuring the decay time of photons traversing the optical cavity [56]. More precisely, let us imagine a situation where a single laser pulse of frequency
  and intensity
  enters the cavity through the front mirror, as shown in figure 1. If the propagation vector of the pulse is perpendicular to the mirrors' surfaces, the pulse will bounce back and forth across the cavity. Since mirrors are not completely reflective (e.g. R
  0.9995), they will absorb (negligibly) and transmit small amounts of light. On each subsequent reflection the bouncing pulse will therefore lose some of its energy. After the incident pulse (of intensity
  ) passes through the resonator for the first time, the outgoing intensity will be equal to
  . With each subsequent transmission, due to reflections light intensity leaking through the rear mirror will be reduced by a factor of
  thus yielding the following expression for the intensity
  after n round trips:

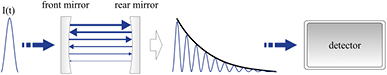
Figure 1. Schematic of laser pulse ringing inside the cavity resonator and the corresponding outgoing train of pulses together with the detected CRDS waveform (envelope).
Download figure:
Standard image High-resolution imageAs can be seen from expression (2.1.1), due to many consecutive transmissions, light will leave the cavity in the form of a train of pulses, which will exponentially decrease with the number of reflections. Furthermore, the number of round trips n can be expressed by means of the cavity length L and the total round trip time  as
as  . Expression (2.1.1) then becomes:
and for a large n it can be described by a continuous function:

Parameter  is the lifetime of the laser pulse within the empty cavity, or in other words, it is equal to the slope of the envelope shown in figure 1. As can be seen from expression (2.1.2),
  depends on mirror reflectivity R. Moreover, the use of a continuous function (2.1.2) is also justified when the length
  of the input pulse (
 ) is larger than the double length 2L of the cavity (
 1 m); under this condition outgoing transmitted pulses will overlap in time and by placing an appropriate light detector behind the rear mirror, one will measure only their envelope (CRDS waveform).
Until now, we have only discussed the case of an empty resonator in which light is lost solely due to transmission through mirrors. When the resonator is filled with some kind of absorbing medium, the lifetime of a laser pulse will obviously decrease. Namely, the expression (2.1.2) for time dependence of outgoing intensity will change to:
where  is the wavelength dependent absorption coefficient,
  is the absorption length and
  is the total wavelength dependent lifetime which now includes both transmission and absorption losses (for simplicity, scattering losses are neglected). It should be noted that in the case of an absorbing medium filling the entire resonator cavity,
  is equal to L. From (2.1.3) it follows that the absorption coefficient
  is given by:
This last expression shows that in order to obtain  one only needs to measure two lifetimes: the one corresponding to the empty cavity (
 ) and the other corresponding to the cavity filled with an absorbing medium (
 ). The two lifetimes define the corresponding absorption losses,
  and
and  , while the total absorption loss is defined as their difference. The measurement thus consists of scanning the input laser pulse over the wavelength and recording the corresponding absorption coefficients (or losses).
However, in real measurements, the number density of absorbing particles is often a function of time and the absorption coefficient is consequently time dependent. The time-dependent absorption coefficient is then given by:
In the case of time-dependent absorption, the ring-down waveform follows multi-exponential decay and cannot be associated with a single absorption coefficient  . A simple solution is to divide the waveform into several time-windows where the absorption coefficient in each particular time-window can be considered as constant and calculated using expression (2.1.4).
Finally, we need to give a relationship between the absorption coefficient  and the number density (concentration) N of the absorbing species. Without going into details, it turns out that the integral of the absorption coefficient in a frequency domain is proportional (strictly in atomic cases) to concentration N:
where  is the angular frequency of resonant absorption from the absorbing species' lower energy state 1 to upper energy state 2,
  is the corresponding Einstein coefficient of induced absorption and N is the concentration of absorbing species in the lower state. Transforming the left-hand side of (2.1.6) into a wavelength domain and rearranging factors, we arrive at the following simple and convenient expression for absorber concentration N, which is independent of broadening mechanisms [57]:
Here,  stands for the lifetime of the upper state 2,
  the wavelength corresponding to resonant transition
  , and
, and  and
and  are the statistical weights of the lower and upper state respectively. Most constants outside the integral are usually available, either as experimental parameters, or from atomic and molecular databases. In order to obtain the concentration N, one is only required to measure the empty cavity (or non-resonant) lifetime
  and the wavelength dependent lifetime
  . This fact demonstrates the unique advantages of CRDS compared with other CES and classical absorption techniques.
2.2. Designing an optical resonator
From the previous discussion it may seem that CRDS is easily implemented. However, there are certain considerations regarding the parameters of the optical resonator cavity and incident light, which need to be taken into account [58–60].
As mentioned in section 2.1, the optical resonator cavity consists of two parallel mirrors at the distance L, each having reflectivity R and a radius of curvature  and
and  . There are many possible choices regarding L,
  and
and  but not all of them lead to a stable resonator. In fact, there is a stability criterion which must be satisfied in order for the resonator to be stable:

where parameters  and
and  are:
are:
In figure 2 regions of stability and instability are plotted for various  and
and  .
.

Figure 2. The stability diagram of an optical resonator.
Download figure:
Standard image High-resolution imageIt should be noted that for the confocal resonator ( and
and  ) one can still satisfy stability criterion. However, in stability diagrams this case corresponds to the centre of the coordinate system, which means that small disturbances can push the resonator into the unstable region. For this reason, this kind of resonator is called a metastable resonator and should be avoided. Therefore, for practical implementations of CRDS one can use the following rule to choose L and
  :
:

Nevertheless, later on it will be discussed that when applying CRDS to atmospheric pressure plasma jets, the stability of the resonator can also depend on the index of refraction of the plasma jet.
The second consideration that has to be taken into account when designing optical resonator cavities, is the relationship between the spectral widths of incident light (laser pulse)  , the absorption line of interest
  and the distance of neighbouring resonator longitudinal modes
  which has to obey the following rule, shown in figure 3:

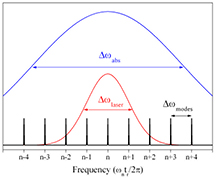
Figure 3. The spectral profiles of an absorption line, laser pulse and longitudinal resonator modes with designated corresponding spectral widths  ,
,  and
and  .
.
Download figure:
Standard image High-resolution imageThe required relationship between the spectral widths of an incident laser pulse and an absorption line can be explained as follows: if  is much wider than
  and
and  , only a small fraction of the pulse (around central frequency) will be absorbed. The lifetime of photons at these central frequencies will be reduced compared to the lifetimes of those photons that comprise other spectral parts of a pulse. This means that the light transmitted through the rear mirror will not be described by a single decay time
  , i.e. by a single exponential, and the slope of the signal envelope will yield an underestimated absorption coefficient
  . It should be noted that this somewhat unwanted behaviour can still be put to good use since it allows for the simultaneous measurement of multiple absorption lines. In particular, if the incident laser pulse is produced by a broadband source and has a very broad spectral width
  , such that it covers frequencies of multiple m absorption lines, the intensity of light exiting the cavity will be approximately described by a sum of m + 1 exponential waveforms. If this light is then incident to a spectrally dispersing element (such as a diffraction grating) and detected using a fast ICCD camera, each component in the sum can be detected separately. As each component corresponds to an absorption coefficient at different frequencies (or wavelengths), one will obtain the absorption spectrum in the entire range defined by
  .
.
The second condition ( ) is straightforward from figure 3 if we consider that an optical resonator can only sustain light of a discrete set of frequencies
  which are defined by the resonator round trip time
  or length L. In the case of light being injected into the resonator, it is described solely by a
  transverse mode (Gaussian mode), and the frequencies of sustained longitudinal modes will be
  (or in wavelength domain,
  ), while spacing between them will be
  . If the spectral width of the laser pulse
  is much smaller than
  it is unlikely that the spectral profile of the pulse
  will overlap with one of the narrow sustained modes
  . Therefore, inside an optical resonator a spectrally short pulse will tend to be suppressed.
The cross-sectional distribution of intensity in a  mode follows Gaussian distribution (hence the name Gaussian mode) and the width of such a beam at the centre of the resonator cavity is approximately given by:
in which  is often called the 'beam waist' and it defines the spatial resolution of the CRDS. Typically it is around 1 mm [61]. Several practical features of
  laser beams are given in [62] but should be taken into account since they also apply to CRDS; 'Gaussian beams are...easy to manipulate, have circular symmetry, usually have the greatest overall intensity of all transverse modes and retain their shape as they propagate'. Since pure
  is hardly achievable, a real beam waist is usually somewhat larger than the value given by (2.2.3).
One last comment should be made regarding the relationship between the spectral width of the absorbing line  and the spacing between two longitudinal modes
  . Although it may seem that condition
  is trivially satisfied, its validity depends on the ratio of the upper state lifetime
  and round trip time
  [59, 60]. Upper state lifetime decreases with pressure since particles are more likely to be perturbed due to collisions. Large lifetimes are therefore more pronounced at lower pressures and in the case of metastable upper states. However, if
  and
and  is the only transverse mode present in the resonator, spacing between longitudinal modes
  will necessarily be larger than the absorption line width
  leading to the possible omission of certain lines in the measured absorption spectrum. To be able to measure multiple absorption lines (without omissions) with large upper state lifetimes, several transverse modes should be present inside the cavity. In CRDS one tends to isolate and inject into the cavity only the
  since, as previously mentioned, it ensures the smallest waist of the pulse at the centre of the resonator (i.e. best spatial resolution) and a single-exponential form of transmitted light. Thus, in order to measure absorption corresponding to transitions to upper states with large lifetimes, the length of the optical resonator L has to be adjusted so that
  .
.
In addition, laser pulse energy entering the resonator cavity has to be sufficiently smaller than the corresponding saturation intensity of the absorption line under investigation (i.e. linear regime) [58] since high incident intensity will cause the whole population of the species in the lower state to be raised into the upper state (saturation) during the very first few round trips. If the lifetime of the upper state is longer than the round trip time, the pulse oscillating inside the cavity will not 'see' the absorbing medium, which will lead to an underestimated absorption coefficient.
Saturation intensity is generally inversely proportional to upper state lifetime, the incident pulse duration and the cube of the resonant absorption wavelength. This means that for absorbing systems with long lived (or metastable) upper states, saturation intensity will be significantly reduced thus requiring a lower laser intensity. For example, in their study of CRDS saturation effects in Lithium vapours, Labazan et al [58] used incident energies in the range from very low (1  ) to very high (600
  ) which were further decreased by passing through the front mirror of the cavity. However, when conducting measurements at atmospheric pressure, frequent collisions between absorbing species lead to decreased lifetimes and consequently to an increased saturation intensity. Therefore, saturation effects of this kind are less pronounced when CRDS is applied to APPJs. The simplest way of checking the linear regime of absorption is to measure the CRDS signal at different incident intensities. If those measurements yield equal (or almost equal) absorption coefficients
  , it means that saturation effects are negligible.
As the measured signal of CRDS is in absolute units ( ), it allows for the direct determination of the number density of particles in a particular quantum state. The CRDS sensitivity, i.e. the lowest detectable absorption coefficient, is given by:
Sensitivity is mainly limited by mirror reflectivity and the precision by which lifetimes can be measured. In some cases, depending on cavity length (L  1 m) and mirror reflectivity (R
  0.9999), effective absorption path-length may reach tens of kilometres. Large effective absorption path-lengths not only allow for the detection of atoms or molecules in gaseous samples at very low concentrations but also measurements of atomic or molecular transitions with very low absorption coefficients. Moreover, CRDS allows the detection of particles in ground and metastable states which cannot be detected by classical emission spectroscopy.
2.3. Setting up the experiment
Figure 4 shows the general experimental setup for the CRDS diagnostics of pulsed plasmas, either pulsed APPJs or laser-produced plasmas. As an absorption laser source, a pulsed nanosecond wavelength-tuneable laser system can be used, but one may also want to employ broadband super-continuum sources or LEDs. Along the optical path between the laser output and the resonator's front mirror, the laser beam should be aligned, shaped and filtered in order to obtain a pure  mode. If necessary, the laser beam can be attenuated using beam splitters or polarizers. The shaping can be achieved, for example, by using pinholes and a simple Keplerian telescope, while alignment can be carried out by prisms guiding the beam along the path. Particular care has to be taken to inject the laser pulse nearly on-axis into the resonator, to limit the number of transverse modes, and preferably select the
  . As described in section 2.2, this transversal mode allows the higher spatial resolution of the method (width of pulse waist at the centre of the resonator cavity) and better coupling to the resonator cavity thus increasing the lifetime of the photons within it. For example, an incident laser pulse carrying an energy of 600
  and transmitted through a mirror having a transmission of 0.001 (0.1%) will give an energy flux of 150
  at the mirror surface and of 4
  in the centre of the cavity for
  with a calculated waist equal to 0.05 cm.

Figure 4. The general experimental setup for a CRDS diagnostic of pulsed plasma, either laser produced plasma or pulsed APPJ.
Download figure:
Standard image High-resolution imageOptical cavities are available nowadays covering a spectral range from UV, through visible, to IR with a mirror reflectivity up to 0.999 999. Such high reflectivity provides ring-down waveforms (defined by the lifetimes of photons within the cavity) lasting from a few microseconds to a few tens of microseconds. The output signal at the rear cavity mirror is typically detected using fast detectors such as classical photomultipliers (PMT) with nanosecond rise times, designed for pulsed operation, or fast ICCD cameras. Since one can always expect pulse-to-pulse fluctuations in CRDS waveforms, averaging (several tens of samples) is a simple way to reduce noise and enhance sensitivity. In order to reduce noise coming from stray light inside the cavity, one can filter the CRDS signal before it reaches the detector by using narrow band-pass filters. For the digitalization of the acquired waveform, digital oscilloscopes or time acquisition waveform PC boards with a minimum 8-bit conversion and time resolution of 1 ns may be used.
Figure 5 schematically shows three typical ring-down waveforms in a lin-log plot. When the incident laser pulse is set at a non-resonant wavelength, or the cavity axis is empty, the ring-down waveform is described by a single exponential (the black curve in figure 5) with a slope corresponding to the minimal obtainable extinction coefficient (baseline). When scattering losses are neglected, the extinction coefficient can be replaced by the absorption coefficient k as given by (2.2.4). When the laser wavelength is tuned to an atomic or molecular transition, the slope of the ring-down waveform will decrease due to the absorption of particles present in the cavity axis (schematically presented by the red curve in figure 5). A constant slope implies that the absorption is constant in time as is the case when the cavity is filled with gas (like within heat-pipe ovens [58]). In cases where absorption is time dependent, the ring-down waveform changes according to the change of the concentration of absorbing particles during ringing time (the blue curve in figure 5, corresponding to absorption from an Fe ground state at 388.8648 nm in laser produced plasma). Time dependent absorption can be expected when the object of observation is, for example, a molecular beam, a laser produced plasma or an atmospheric pressure plasma jet. In those cases, the amount of absorbers traversing the cavity axis is generally changing in time, either due to momentum or for chemical reactions. If the source of the absorbing species (LPP or APPJ) is far from the cavity axis one can define the 'absorber arrival time' as the time in which the fastest absorbers reach the axis and the signal slope starts to decline from the value corresponding to the empty cavity signal. The arrival time is marked with an arrow in figure 5. By combining it with the distance between the absorber source and cavity axis, the velocity of absorbers can be determined [61].

Figure 5. Typical ring-down waveforms—the fitting technique with time-windows for time dependent absorption. The black line represents a non-resonant case when there is no absorption inside the cavity since the CRDS wavelength is off resonance. In this specific case, the blue line corresponds to the time dependent absorption of an Fe ground state at 388.8648 nm in a laser plasma produced in a vacuum ( ). The red line is a schematic representation of time independent resonant absorption and it was not achieved by measurements.
Download figure:
Standard image High-resolution imageFigure 5 also shows how time-dependent CRDS waveforms can be divided into several parts, or time-windows, with each part having a unique slope (sequential exponentials [61]). By fitting these slopes to pure exponentials one obtains the time evolution of a particle's concentration in the plasma pulse. Therefore, in time-window A the particles are still not present in the cavity, while time-windows B, C and D represent the evolution of the number density of absorbing particles (different slopes of the ring-down waveforms). Finally, time-window E represents the case in which all particles have left the cavity axis (the slope of the waveform in this window coincides with the one in an empty cavity).
The time resolution of CRDS is generally defined by the width of the time-window in which a reasonable fit to exponential dependence can be obtained. Usually, the least-square fitting method is applied and an  parameter is used as a measure of fit confidence [63]. In order to improve the signal-to-noise ratio, measured ring-down waveforms are to be averaged, usually using from 10 to 100 samples. In practice, time resolution can easily be 100 ns or even lower [64–66]. To obtain a good fit it is important to have not only a good time resolution of a digital oscilloscope but also vertical resolution (>8-bit).
Figure 6 is an example of the time-resolved spectra obtained by CRDS. Each spectrum is obtained by fitting CRDS waveforms in different time-windows thus showing the time-evolution of absorber concentrations; in this case, lithium atoms and dimers upon the laser ablation of a lithium target in a vacuum. Time-windows corresponding to labels A, B, C and D are defined within the time intervals (0–3.2)  , (3.2–7.7)
  , (7.7–15.15)
  and (15.15–22.75)
  respectively. One can observe how light Li atoms appear first in time (they are the first to reach the resonator axis) while heavier
  dimers appear in later time-windows. Therefore, besides determining concentrations, CRDS can be used for time-of-flight measurements.

Figure 6. The time-resolved CRDS spectra of laser-produced lithium plasma adopted from reference [67]. Spectra A, B, C and D are obtained by fitting a CRDS waveform within time-windows defined with (0–3.2)  , (3.2–7.7)
  , (7.7–15.15)
  and (15.15–22.75)
  respectively.
Download figure:
Standard image High-resolution imageIn addition to the determination of velocity, CRDS allows an indirect measurement of velocity distribution and an angular distribution of plasma particles when applied to pulsed plasma sources [65, 68]. Recently, Sahay and Wang [69] performed absolute measurements of electron impact excitation cross-sections on metastable levels of Hg ( ) and Ne (
 ) which demonstrate new possibilities for determining important plasma parameters using CRDS.
3. CRDS applied to plasma diagnostics
The first CRDS applications on atmospheric plasmas were reported for the case of  plasma concentrations produced by a dc discharge. This has been achieved both with spatially (0.2 mm) [60] and temporally (1
  ) resolved CRDS [70] with a lower detection limit equal to
  . The optical cavity parameters used in these experiments are given in table 1. A temporal resolution of 1
  was achieved by fitting CRDS waveforms into time-windows with a width of 1
  . As the authors noted, this resulted in a good compromise between time resolution and acceptable signal-to-noise (S/N) ratio; signal-to-noise ratio generally increases with the shortening of the time-window. Noise was also reduced by averaging either 16 or 32 CRDS waveforms prior to the fitting procedure and only the portion of the waveform between 90% and 10% of peak amplitude was used. The authors stated that the maximal achievable S/N was around 56, suggesting an absorbance-per-pass sensitivity of around 1 ppm, which in their experimental conditions corresponded to a detection limit of
  for
for  . Regarding spectral resolution, the laser wavelength was changed by a step size of 0.001 nm. In combination with a laser linewidth of 0.14
  this setup enabled the resolving doublet structure of
  spaced by 0.005 nm. Regarding spatial resolution, it is generally defined by both the spatial step-size by which plasma is moved over the resonator cavity axis and by the beam waist at the centre of the cavity resonator given by (2.2.3). Under conditions used in the cited work (table 1), 'the expected beam waist was approximately 160–320
  , depending on the level of mode matching achieved' [60] which is the same order of magnitude as the spatial step-size of 0.2 mm. However, the authors report that such a beam waist only contributed to the measured profiles by about 1% [60]. Therefore, by the appropriate choice of resonator cavity parameters, one can obtain both excellent spatial and temporal resolution. Moreover, similar to optical emission techniques, cavity enhanced absorption spectroscopy enables one to estimate the concentration of electrons in the plasma using the collisional–radiative model. Full width at half maximum (FWHM) of ionic absorption lines (when other possible broadening mechanisms are excluded) is directly related to the concentration of electrons. Yalin et al [60] found that this kind of spectroscopic measurement yields results in good agreement with spatially integrated electrical measurements. One important fact provided by this research is that the stability of a resonator is strongly affected by the presence of atmospheric pressure discharge. Namely, it was found that the original version of the resonator (
 ), which was stable according to criterion (2.2.1), was actually unstable when a plasma jet was present due to 'beam steering from the index of refraction gradients'. This indicates that when the laser pulse traverses the atmospheric pressure plasma, it can be shifted from its path with each successive pass. Yalin et al [60] solved this issue by changing the resonator parameters to
  . This new geometry helped to re-centre deviated pulses and bring the ring-down time to approximately 12
  .
.
Table 1. A Summary of the main CRDS applications for various types of atmospheric plasma sources. Listed parameters are the wavelength range, the length of the resonator, calculated (using equation (2.2.3)) and the reported beam waists, reflectivity and radius of CRDS mirrors, laser pulse width, energy per pulse (laser output, incident energy and coupled to the cavity), and the main parameters which define the plasma source.
| CRDS properties | Discharge parameters | Measured particles/Density ( ) ) |
Ref. |
|---|---|---|---|
| 387–392 nm | RF torch, local thermal equilibrium (LTE) plasma 4 MHz, air/Ar/H |  |
[71] |
 , , |
|||
 |
|||
 |
|||
 , , |
|||
 , , |
|||
 , , |
|||
 |
|||
| 770 nm, | Nanosecond repetitive pulsed (NRP) discharge, air, 5–8 kV, 10 kHz, 10 ns pulse width, 1000 K preheated |  |
[66] |
| L = 67 cm | |||
w  not available not available |
|||
 |
|||
| r = 50 cm | |||
| R > 0.9997, | |||
 , ,  |
|||
 |
|||
308 nm,
R = 0.9985
L = 66 cm,
r = 6 m

 w
w  1 mm 1 mm |
MW cavity 2.45 GHz, He 0.38–0.78 slm, 38–78 W,
MW cavity 2.45 GHz,  /Ar mixture, 1.7 slm, 104 W
MW cavity 2.45 GHz Ar, Ar/ /Ar mixture, 1.7 slm, 104 W
MW cavity 2.45 GHz Ar, Ar/ mixture, Ar/ mixture, Ar/ mixture
Ar + air/methane mixture mixture
Ar + air/methane mixture |


 OH(x) / 0.12–3.13
  |
[73] [74] [72] [75] |
387–392 nm
L = 75 cm,
 0.3 mm
w = 0.16 − 0.32 mm,
r = 0.5 m,
R = 0.9998, 0.3 mm
w = 0.16 − 0.32 mm,
r = 0.5 m,
R = 0.9998,
 = 7 ns, = 7 ns,
 = 3 mJ, = 3 mJ,
 , ,
 = 0.14 = 0.14  |
DC discharge, 100 mA,  (atmospheric pressure) (atmospheric pressure) |
 |
[60, 70] |
Later on,  measurements have been extended to the case of RF torches in air/Ar/H plasma [71]. In the work, CRDS was employed for the determination of air/nitrogen plasma temperatures and concentrations both in thermochemical equilibrium and non-equilibrium with sub-millimetre spatial and sub-microsecond temporal resolution. In order to obtain spatially resolved concentrations, a plasma torch was scanned perpendicularly to its axis with a spatial step of 2 mm while the beam waist at the centre of the cavity amounted to 0.5 mm. This yielded correct values even without deconvolution. Since the plasma torch was axially symmetric, radial concentration distribution was calculated by using Abel inversion.
The plasma torch used in the cited research [71] also presented one specific difficulty worth mentioning. Namely, the researchers reported on a huge change of empty cavity lifetime τ0 with respect to the plasma being on or off. The lifetime  decreased from an initial value of 10
  (plasma off) to a very low value of 0.65
  (plasma on) even with the absorption laser set to a non-resonant wavelength and with the cavity axis being translated 2.5 cm away from the plasma torch orifice. This effect was attributed to two mechanisms. The first one included absorption on long-lived particles, such as
  and
and  , which do exhibit absorption transitions in the wavelength range of interest. Since concentration of these species fluctuates due to air turbulence around the plasma torch, the measured lifetime
  fluctuates as well. This problem was partially solved by purging the turbulent region with dry nitrogen. The second mechanism was connected to a reduction of mirror reflectivity caused by UV-radiation coming from the plasma torch. More particularly, photons carrying the energy of several eV can cause the deformation of a mirror's top dielectric layer thus decreasing the reflectivity. Researchers have reported an increase of 50% in the lifetime
  in the case of cavity mirrors being shielded from plasma radiation. In comparison to the two aforementioned mechanisms, the thermal lensing (due to gradients in the index of refraction) of the laser beam passing through the plasma was found to be negligible.
One note should be provided regarding the single-exponential form of ring-down signals. As described in section 2.2,  is the preferred transversal mode to be injected and sustained inside the cavity resonator. Other modes should be rejected by filtering the laser beam on its path to the resonator (using pinholes and telescopes) and by assuring that the laser beam is perpendicularly incident to the front mirror surface. However, pure
  is difficult, if not impossible, to achieve. Interference between the various transverse modes oscillating inside the resonator cavity can be noticed as oscillations in CRDS waveform. Therefore, by fine-tuning the mirror and beam alignment, one should strive to reduce these oscillations to a minimal value (several % of the overall waveform amplitude). Moreover, since these oscillations change from pulse to pulse, they can be effectively reduced by simple averaging; in [71] 25 waveforms were averaged to give the absorption coefficient
  and this procedure was repeated ten times, yielding 250 waveforms for a single
  .
.
Moreover, it has been shown that by using CRDS one can move the detection limit of electron concentration to even lower values than that which can be obtained from Stark broadening [71]. In the aforementioned case, a Stark-broadened lineshape of  was used to estimate electron concentrations above approximately
  , while concentrations lower than this could only be probed by measuring the concentration of ions (using CRDS) and subsequent ion-chemistry modelling.
Concerning neutral nitrogen molecules  , these have been detected in nanosecond repetitively pulsed (NRP) discharges [66] for the purpose of studying plasma-assisted combustion. The discharge was created in atmospheric air and nitrogen preheated to 1000 K between two pin electrodes by applying 10 ns wide pulses at a voltage of 5 − 8 kV and a frequency of 10 kHz. Here, comparison of OES, CRDS and TALIF has been performed and the absorption techniques yielded absolute concentrations of both O atoms (by two-photon absorption, TALIF, from ground state triplet
  ) and
) and  molecules residing in a metastable state
  by probing the vibrational band (2,0) of the
  first positive system
  with a temporal resolution of 50 ns. The absorption measurements were made using a wavelength-tuneable, pulsed dye laser at a repetition rate of 10 Hz. In order to avoid a pulse of too great an intensity being injected into the cavity resonator, the energy of the laser beam was reduced from 40 mJ (at laser output) to a few hundred
  (inside the cavity). Energy reduction also resulted from isolating only the
  mode using a 100
  pinhole and system of lenses. Due to severe temperature gradients inside the discharge, beam-steering was expected. Accordingly, the researchers designed their resonator cavity by positioning the mirrors at a distance of 67 cm, with the mirror radii of curvatures being 50 cm. As was mentioned earlier, in connection with work by Yalin et al [60], reducing the g-parameter (see expression (2.2.1)) helps with re-centring the walking beam.
In this case [65], NRP discharge was probed in both diffuse and filamentary mode, and it was found that  and O concentrations were, after applying Abel inversion, an order of magnitude higher in filamentary regime. The authors attributed this effect to the dissociation of
  in collisions with electronically excited
  . The general advantage of CRDS is that it does not require a calibration as laser-induced fluorescence methods do, for example.
Moreover, it should be noted that this kind of powerful discharge can easily induce electromagnetic noise in the surrounding experimental apparatus. This especially applies to sensitive photomultiplier tubes (PMT) and their wiring to other equipment. In order to reduce the influence of the discharge, PMTs should be enclosed in a Faraday cage.
The next most studied case is detection of OH radicals produced in an atmospheric pressure argon microwave plasma jet [72 − 74] by utilizing OH(A–X) transition for measuring absorption. Generally, when the mixture (Ar/ and Ar/
 ) of gases is used to create an atmospheric discharge, the OH concentration depends on the ratio of gases. A resonator cavity was assembled by using high reflectivity mirrors with a radius of curvature equal to 66 cm and separated by 6 m yielding a beam waist of around 0.8 mm. Spatial measurements were conducted at spatial steps of 1 mm which is very close to the aforementioned ideal beam waist. In such cases one should deconvolute the measured concentration profiles with the laser beam profile. The detection baseline used for the resonator cavity was calculated to be
  'which corresponded to a detection limit of the OH number density of
  molecules
  at 308 nm for a laser beam path length in the plasma of 11.0 mm and a plasma temperature of 480 K'. With the aim of increasing the signal-to-noise ratio, an absorption coefficient at each wavelength was obtained by averaging 60 CRDS waveforms.
It should be noted that since the OH concentration was calculated on the basis of measuring only a few rotational transitions, knowing the gas temperature is of critical importance. For example, when utilizing absorption measurements of OH(A–X) transition, a change of 50 K in the plasma gas temperature changes the calculated number density of OH by 5%. Usually, the gas temperature can be determined from the ratio of line intensities within a rotational structure by assuming Maxwell–Boltzmann distribution among rotational states. However, CRDS discloses a rather narrow portion of the spectrum so the temperature is usually determined from broadband emission measurements (OES). In the present case [73], a knowledge of the temperature was required for the area of plasma jet where optical emission was too weak to be measured. Therefore, instead of OES, the researchers employed thermocouples. Unfortunately, since thermocouples are based on measuring small changes of voltage, they are prone to interference effects from plasma jets. These interferences are more pronounced when the thermocouple is in the vicinity of the plasma jet. Nevertheless, it was reported that the values obtained by thermocouples were in approximate agreement with the values (480–600 K) inferred from OES and CRDS in the visible part of the plasma jet.
Moreover, by measuring OH in its ground state it was possible to detect these radicals far away from the jet orifice, in this case even at distances about 6 times longer (16 mm) than the visible part of the jet. It was also found that by adding a small amount ( 1%) of water vapour to the gas mixture, overall OH generation increases, while along the jet-length OH concentration exhibits steeper exponential decay. The authors attributed these effects to an increased quenching rate of OH radicals in the presence of excess water vapour.
Recently, Wang et al [75] used CRDS and OES in their study of microwave plasma jet-assisted combustion of methane/air mixtures using a similar CRDS setup as in [74]. Usage of complementary methods (absorption and emission) to measure ground and excited states of OH, enabled the authors to discuss the roles of OH in both plasma-assisted ignition and flame stabilization. They found CRDS especially suitable for the detection of OH in the region a long way downstream (43 mm) since optical emission was too weak to be detected even at distances > 28 mm. The absorption path length  was estimated from photographs of the plasma jet. This estimation was the main source of uncertainty of the measured OH number density amounting up to 20%. The authors also note that in order to evaluate total OH concentration from measurements involving only certain ro-vibronic transitions, one should be careful not to use the strongest lines since they are prone to saturation effects. Saturation effects lead to an underestimation of intensity and consequently of molecular abundance. Moreover, the saturation makes the Boltzmann plot method unreliable when applied to several rotational lines in a single rotational branch.
Besides the obvious advantages which cavity-enhanced techniques, particularly CRDS, have over emission measurements, there are several problems that have to be taken into consideration when designing the experiment. Firstly, as CRDS generally offers very high sensitivity due to an extremely long absorption path, it should be noted that carrying it out in an atmospheric environment can reduce this sensitivity significantly (owing to non-resonant dispersion on air particles). On the other hand, conducting measurements at sub-atmospheric pressures is usually not an option since by lowering the pressure, discharge parameters can change significantly. Other issues plaguing cavity-enhanced techniques are caused by large particle concentrations inside the flowing gas. This can effectively change the index of refraction as discussed by Yalin et al [60] and in the case of resonant absorption can lead to saturation effects. Together, these two issues define the lower and upper limit of detection sensitivity. Care should be taken to choose appropriate absorption transitions; if possible, those which do not overlap with transitions corresponding to environmental gas and do not suffer from a decay of ring-down signal which is too fast due to exceedingly high concentrations. For the latter case, one solution is to probe metastable or excited states, which despite being generally less populated than ground states, still provide a sufficient estimation of overall concentrations through excitation dynamics modelling.
In addition to the characterization of atmospheric pressure plasmas, CRDS has been applied to various low-pressure discharge plasmas [76–79]. Time-resolved CRDS has been employed in several experiments to determine surface reaction probability during the plasma deposition of a-Si : H [80], or to study nanoparticle generation in a  VHF plasma [81, 82]. A study of the densities and kinetics of Si and SiH in remote
  plasma has been carried out by Kessels et al [83–85].
Besides APPJs, various laser-produced plasmas (LPPs) have been studied in our laboratory. Electron density in lithium plasma was determined from the lineshapes of atomic transitions [86]. Molecules were also detected within the plasma plume [87, 88], as were atoms within the dark region of the plasma plume [89]. A spatially and temporally resolved study of single- and double-pulsed plasma was carried out [64, 90, 91] and helium metastable density determined upon helium excitation by electrons ejected from various target materials [92]. The latter case of LPP shows similarities with APPJ due to pulsed plasma nature and time-dependent absorptions.
4. Detection of He metastable density in a single electrode APPJ by CRDS
To demonstrate the application of CRDS for analyses of APPJ, we show and discuss the case of metastable He( ) atom detection in more detail. The specific experimental arrangement is shown in figure 7.
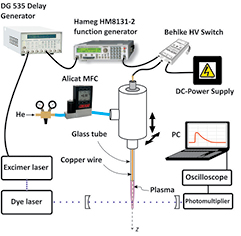
Figure 7. The experimental setup for the CRDS detection of helium metastable atoms generated within a single − electrode APPJ driven by HV pulses.
Download figure:
Standard image High-resolution imageThe APPJ electrode was a copper wire with a diameter of 0.1 mm inserted inside a borosilicate glass capillary tube 50 mm long and with an outer diameter of 1.5 mm [93]. A single electrode APPJ was connected to a direct current (dc) power supply (Power Designs 3K10B) through a high voltage (HV) switch (Behlke HTS 31-03-GSM). The HV switch was triggered with a function generator (Hameg HM8131-2) with a 50% duty cycle square signal at a repetition rate of 10 kHz. The helium flow of 2 l min−1 was controlled with an Alicat MC-5SLPM-D mass flow controller. The helium purity used in the present experiment was 99.996%. In order to measure the spatial distribution of metastable He in the plasma plume, the APPJ was movable in the directions illustrated in figure 7.
The CRDS measurements were performed with an APPJ placed in the centre of an 83 cm-long cavity with cavity mirrors of 99.95% reflectivity and a mirror radius with a curvature of 1 m. The dye laser (LPD 3002E Lambda Physik, pulse length 15 ns,  = 0.0026 nm, central wavelength 388 nm) used for CRDS was operating with BiBuQ (LC 3860) laser dye and was pumped with an excimer laser (LPX 105E Lambda Physik, 308 nm). In front of the resonator cavity, the energy of the laser pulse was around 80
  . The expected laser beam waist (from equation (2.2.3) was around 0.3 mm while the one measured was around 1 mm. A photomultiplier tube (RCA C31034) was used to detect the ring-down signal, which was sent over an 8-bit digital oscilloscope to a computer.
The HV pulses used for an APPJ discharge have to be synchronized with the laser pulses used for CRDS. In order to achieve this, the delay between the trigger signals for an excimer laser and for a function generator was controlled with a delay generator (DG 535 Stanford Research Systems).
Figure 8 shows the comparison of voltage and current waveforms with a typical ring-down waveform. The rise-time of HV pulse is around 50 ns and the current pulse (the second peak) lasts for about 150 ns. The ringing of laser photons lasts over 2 μs, which is enough time to observe the signal evolution during the recombination period of the plasma pulse. As a general rule, when CRDS is applied to APPJ or LPP, absorption signals change during the ring-down time.

Figure 8. A comparison of a voltage and current waveform with a CRDS signal for a pulsed APPJ.
Download figure:
Standard image High-resolution imageWe note that such pulsed operation, with well-defined timing of the voltage and current waveforms, is essential for achieving synchronization with the probing pulses of the CRDS laser. Our attempts to apply CRDS to the plasma source with a sinusoidal drive, e.g. as described by Zaplotnik et al [93] failed due to significant random variations in the timing of the current waveform with respect to the voltage waveform. Similar fluctuations have recently been observed with ac excitation [94].
Typical absorption lineshapes (dots) are shown in figure 9. This figure presents a comparison of helium transition from a metastable singlet state  to excited triplet state
  in two cases: (a) APPJ and (b) LPP. Green curves represent the fitted fine-structure components (Voigt profiles) of the measured transition while the red curve represents the sum of these components. The measured data (black dots) was fitted to a sum of three Voigt peaks under the following constraints: the centres of the peaks were fixed at wavelengths obtained from an atomic transition database; all peaks had equal Lorentz half-width and equal Gaussian half-width. Areas under the line profiles were also related according to corresponding weighting factors given by 2J + 1:
  . There are several features worth discussing, and the most prominent one is the width of the absorption lineshape. Laser produced plasma is a relatively hot medium and metastable helium atoms are therefore generally subjected to electron concentrations an order of magnitude higher than in atmospheric, especially low-temperature, plasma jets leading to greater Stark broadening [95]. The fact that the metastable helium lineshapes measured in APPJ are actually wider than the ones measured in LPP (as shown in figure 9) leads to the conclusion that the dominant broadening mechanism in APPJ is collisional broadening. This was confirmed in experiments done on helium dielectric barrier discharge by Horvatic et al [22, 23]. By examining the wings of Lorentzian lineshapes the authors found that the upper limit for electron concentration is at
  , well below the value required for significant Stark broadening. On the other hand, the lineshapes exhibited linear dependence on pressure, which is a clear sign of collisional broadening.

Figure 9. A comparison of He lineshapes at atmospheric pressure (top) and almost vacuum (0.5 mbar He) condition (bottom). The fine structure is due to absorption from a metastable singlet lower state  to the upper triplet state
  . The widths of time-windows used for fitting were 150 ns and 500 ns respectively.
Download figure:
Standard image High-resolution imageThe other feature visible in figure 9 is the ratio of absorption losses. Helium pressure in the case of APPJ is 1 bar, while in the case of LPP it is 0.05 mbar. Regardless of this huge difference, measured metastable concentrations (inferred from absorption loss) do not differ by much. This points to the fact that in APPJ, excitation processes are significantly weaker and that those helium atoms which do get excited to metastable state are quickly quenched by surrounding air ( ).
).
We note that the FWHM of 0.025 nm in the present experiment is similar to the result of capillary DBD for soft ionization under similar conditions,  GHz (0.02 nm), obtained through detailed OES measurements [22].
Figure 10 shows the measured lateral absorption distribution of He metastables at a distance of 10 mm from the capillary tube orifice: red squares correspond to an absorption coefficient  integrated over the absorption line profile. This integral is a dimensionless quantity proportional to a concentration of metastable He. The absorption distribution was measured by the lateral displacement of the jet in steps of 0.2 mm with respect to the cavity axis. Because the laser beam waist was wider than this step size, a deconvolution of laser Gaussian beam and Gaussian fit of the measured lateral distribution was carried out. From the deconvoluted signal (FWHM = 0.54 mm) shown in figure 10 one can assess the length (
 ) of the absorbing medium required for density calculation.
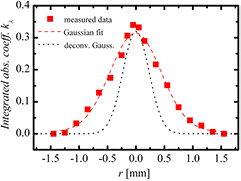
Figure 10. The integrated absorption coefficient (red squares) of He metastables at a distance of 10 mm from the capillary tube orifice perpendicular to the jet axis together with the deconvoluted APPJ lateral profile. The effective absorption path  equals 1 mm.
Download figure:
Standard image High-resolution imageFigure 11 shows the distribution of helium metastable atom density along the APPJ at a helium flow of 2 l min−1. An exponential decay along the jet axis (r = 0 mm) is observed with the decay constant of the fitted curve being around 1.4 mm. It should be noted that this decay constant does not have a direct physical interpretation; it is merely a means to parameterizing observed data. Metastable He densities of up to  were measured near the capillary orifice. The detection limit of the presented CRDS system for metastable He atoms was around
  , which made it possible to detect metastable He atoms 3.5 mm from the capillary tube orifice.

Figure 11. The distribution of He( ) metastables along the APP jet at a helium flow 2 l min−1. The measurements were made approximately 40 ns after the beginning of the APPJ voltage pulse within a 100 ns wide time-window.
Download figure:
Standard image High-resolution image
Measurements below 0.3 mm are precluded due to the vicinity of the capillary tube exit. From measured data we conclude that He metastables are mainly created in the vicinity of a copper wire end (which is just at the orifice of the capillary tube) during a well-defined current peak, which lasts for about 150 ns. The main excitation mechanisms are collisions with electrons, while the main de-excitation goes through collisions with surrounding  molecules and Penning ionization. Our values for the
  density may be compared to similar ac and dc measurements in DBD
  and
and  [94] and about
  within the capillary tube of the DBD source [23] taking into account differences in discharge design but also absolute voltage and current values, flow and purity of helium gas.
5. Conclusions
Recent applications of pulsed cavity ring-down spectroscopy have confirmed its potential as an analytical technique in the study of atmospheric pressure plasma jets. CRDS offers high sensitivity and relatively easy implementation in the direct determination of atomic and molecular number densities within plasma jets with both spatial and temporal resolution. So far,  ,
,  , OH and
  have been detected in atmospheric pressure plasma jets or torches, but numerous other applications in low pressure plasmas can be easily extended to many other atomic and molecular species. CRDS or other CES methods possess the potential for extended applications in APPJ diagnostics by using other types of light sources, incoherent broadband or frequency combs. This can be essential for obtaining in situ real time direct absorption methods for monitoring the complex interaction of APPJ with different materials ranging from solids and liquids to tissues, and simultaneously observing the various atoms and molecules, which may appear due to such interactions. Among the techniques used for determining the parameters of various plasmas, cavity ring-down spectroscopy (CRDS) offers highly sensitive, quantitative measurements of the concentrations of both atomic and molecular species.
Acknowledgments
This work has been supported in part by the Croatian Science Foundation under project #2753. RZ would like to acknowledge the support of NATO SfP project 984555 and the NEWFELPRO fellowship project grant agreement no. 1.