

Abstract
In this paper, a cold He atmospheric pressure plasma jet that is generated using a dielectric barrier discharge configuration device is presented. This device is equipped with double-grounded ring electrodes that are driven by a sinusoidal excitation voltage. The properties of the cloning of filamentous current are studied. The frequency of the collisions between the ion and the neutral particles is calculated by measuring the current phase difference between the filamentous current and its corresponding clone. The frequency of the collisions between the ion and the neutral particles is of the order of 108 Hz.
Export citation and abstract BibTeX RIS
1. Introduction
Atmospheric non-equilibrium plasma has been extensively studied for its potential applications in many fields, such as film deposition, surface modification, sterilization, food treatment, and pollution control [1–5]. Several configurations of dielectric barrier discharge (DBD) at atmospheric pressure have been reported [6–8]. An atmospheric pressure plasma jet (APPJ), which is a DBD device, initially generates plasma in a dielectric tube. This plasma then expands in an open space because of gas flow. The length of the plasma plume may reach 10 cm or longer [9]. An outstanding advantage of APPJ is that no limitation is set on the size of materials to be treated because the reactive species, including charge particles, may reach the surfaces of the materials in an open space. Particle collision in plasma has an important role. Collective behavior is restricted when electron–neutral collision frequency γen is comparable with or greater than plasma frequency. In this condition, the plasma is called collisional plasma, which is crucial in military technology because it absorbs electromagnetic waves. Collisional plasma has become one of the most actively researched topics.
Although various plasma applications have been used for a long time in technology, the physics of low-temperature atmospheric pressure plasma remains only partially understood. Despite the high collisionality of plasma at atmospheric pressure, this substance exhibits non-equilibrium when present in APPJs. This behavior is exhibited not only because its ion temperature is different from that of electrons but also because each species shows complex kinetic energy distributions [10]. Most computational studies on atmospheric pressure microdischarge have used fluid-based models [11]. However, significant deviations occur when the plasma is not in equilibrium, and nonlocal effects are important [11]. Therefore, simulations based on kinetic models have been developed [12]. These properties also limit the applications of several common diagnostic methods in APPJs, such as a Langmuir probe, optical emission spectroscopy, and laser Thomson scattering [13–15].
In the current study, we have developed a technique that is based on current cloning to calculate the frequency of collision between ions and neutral particles γin. This method measures the phase shift of every frequency component using fast Fourier transform. The parameter γin can be derived from the measured phase shift; thus, ion energy distribution function, ion kinetic temperature, or ion energy-dependent cross-section need not be determined. Only ion flux can be captured because oscilloscope bandwidth is limited. Therefore, this method may be used to measure γen when the oscilloscope bandwidth permits.
2. Experimental setup
The schematic of the experimental device is shown in figure 1. A concentric cylinder-DBD device was installed in an acrylic plastic chamber. A stainless steel stick was used as a powered electrode. This stick, which has a diameter of 2 mm, was inserted into a glass tube with an inner diameter of 6 mm. Two copper (Cu) rings with the same size and length of 10 mm were placed around the outer side of the glass tube. These rings served as grounded electrodes. The distance between the two Cu rings was 5 mm, and the first grounded electrode ended at 3 mm after the end of the stainless steel stick. Helium (99.9% pure) was used as the working gas. The ac power supply that we used had a maximum peak voltage of 20 kV, with a frequency of 0.5 to 20 kHz. A high-voltage probe (Tektronix P6015A) was used to measure the applied voltage and two noninductive resistances of 100 Ω were used to measure the discharge currents through voltage probes (Tektronix P6139A). The applied voltage and discharge currents were applied to a storage oscilloscope (Tektronix DPO4014, 1 GHz, 5.0 Gs s−1).
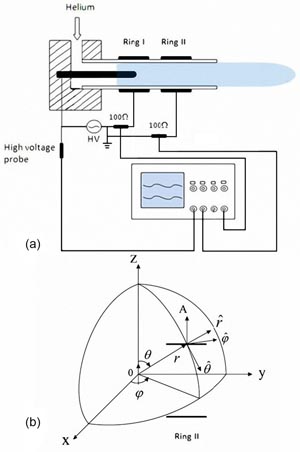
Figure 1. (a) Schematic of the experimental setup; (b) coordinate system used in calculating current element radiation and current element location on the z-axis.
Download figure:
Standard image High-resolution image3. Results and discussion
A DBD in atmospheric pressure He discharge usually has two discharge modes, namely: filamentary discharge and glow discharge modes. In filamentary discharge mode the filaments are irregularly distributed in space and time, with a lifetime of tenths of nanoseconds. The equivalent capacitance of the dielectric layer is small, and the charge and discharge current density of the filaments is high. Therefore, this condition results in a voltage drop in the gas, which corresponds to a rapid filament discharge that is immediately extinguished. However, glow discharge is controlled by a mechanism of slow electron avalanche that usually lasts for several microseconds. Figure 2(a) shows the waveforms of the applied voltage and discharge currents in the two rings. The full widths at half maximum (FWHM) of some discharge currents are in the order of microseconds, whereas others are in the order of nanoseconds. This finding indicates that the discharge modes contain not only glow discharge but also filamentary discharge. Figure 2(b) shows the time expansion of the highlighted region in figure 2(a). Six pairs of current signals exhibited phase differences Δ∅ of nearly 180°. The highlighted region in figure 2(b) is further expanded in the time scale (figure 2(c)). The current profiles of rings I and II completely correspond to each other. Table 1 lists the amplitude ratios. The amplitude ratios vary from 50% to 122%. However, one-to-one correspondence is not observed in the glow discharge currents.

Figure 2. (a) Wave forms of voltage and current in rings I and II with applied frequency of 8 kHz, applied peak–peak voltage of 8.2 kV and gas flow of 0.2 l min−1; (b) time expansion of (a); (c) time expansion of (b).
Download figure:
Standard image High-resolution imageTable 1. Amplitude ratios of current in rings I and II.
| Amplitude ratio (%) | Amplitude ratio (%) | ||
|---|---|---|---|
| a, a' | 87.50 | 1,1' | 106.87 |
| b, b' | 104.56 | 2,2' | 81.26 |
| c, c' | 88.03 | 3,3' | 101.45 |
| d, d' | 85.71 | 4,4' | 121.31 |
| e, e' | 102.24 | 5,5' | 122.50 |
| f, f' | 61.24 | 6,6' | 50.00 |
| 7,7' | 89.47 | ||
| 8,8' | 82.72 |
Rapid imaging techniques show that the plasma jet consists of 'plasma bullets' that move away from sources at speeds of 104 to 105 m s−1 [10]. Currently, 'plasma bullets' are considered to be ionization waves, which are similar to cathode-directed streamers [9]. The luminous front of a 'plasma bullet' is indeed connected to a powered electrode by a less luminous but conducting channel [9]. Different geometries of triggering electrodes exhibit little effect on plasma density and potential distributions in plasma jet, as well as streamer dynamics [9]. In this study, an induced electric field that is accompanied with filamentary current in ring I is observed. An electric field propagates at a speed equivalent to the velocity of light c, which is much faster than that of a plasma bullet. Therefore, the plasma bullet is stationary compared with an electric field. When oscillation frequencies of an electric field are lower than the oscillation frequency of an ion, the electric field propagates in the plasma rather than being shielded by the plasma [18]. The oscillation frequency of an ion is estimated at around 109 Hz, according to the equation fi = (nie2/4π2ε0Mi)1/2, where ni represents the ion density and ni is assumed to be in the order of 1020 m−3 [9], e is the elementary charge, ε0 is the dielectric constant in vacuum, and Mi is the mass of a He ion. From the fast Fourier transform spectra in figure 3, the main frequency components of the discharge current are distributed in the range of 4.3 × 10⁶ to 2.4 × 10⁸ Hz. This finding indicates that the electric field can propagate in plasma. The charged particles in ring II are driven by the electric field in its z direction component and they move toward the grounded electrode (ring II) to form a conduction current. The clone phenomenon occurs because of the relationship of the discharge currents in the two rings.
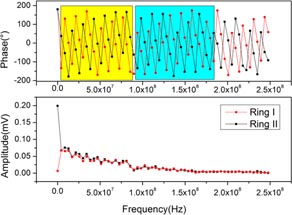
Figure 3. Fast Fourier transform spectra of figure 2(c) with (a) phase and (b) amplitude frequencies.
Download figure:
Standard image High-resolution imageThe phase difference between the filamentary current and its clone is nearly 180° in the experiments, as shown in figures 2(b) and (c). The theoretical analysis of the results is as follows. The electric field generated from the current element at point (r, θ, φ) in the spherical coordinates (figure 1(b)) is expressed as [16]:
where I0 = I0 mcos(ωt + ∅) is the current intensity of the filamentary discharge, I0 m is the amplitude of I0, ω is the angular frequency of I0, ∅ is the initial phase of I0, t is the time, Δl is the length of current element, k is the wave number, θ is the included angle between
 and the z-axis,
is the unit vector, r is the distance from the current element to ring II,
and the z-axis,
is the unit vector, r is the distance from the current element to ring II,
 is the angle of the unit vector, and j is the imaginary element.
To facilitate the calculations, the space around the current element is divided into three regions: the near-field (where kr ≪ 1), far-field (where kr ≫ 1), and intermediate regions. In this experiment, kr = 2πfr/c ≈ 5.0 × 10⁻² ≪ 1, where f is the current frequency. In figure 3, the main frequency components of the discharge current are distributed in the range of 4.3 × 10⁶ to 2.4 × 10⁸ Hz. Here, the maximum value of 2.4 × 10⁸ Hz is selected and the values for c and r are 3 × 10⁸ m s−1 and about 10 mm, respectively. Therefore, the near-field condition is satisfied. Equation (1) can then be simplified to:

The component of E(r) in the z direction is expressed as

From equation (3), the phase difference between the filamentary current and its induced electric field is 90°. The charged particles are driven by this field, and the particles migrate toward ring II to form the cloning current. γen is around the order of 1012 Hz when the electron temperature is tens of thousands of Kelvin [11], which is significantly higher than the frequency components of I0 using fast Fourier transform, as shown in figure 3(a). γen does not contribute to the phase shift between I0 and
 ; thus, only γin should be considered.
Table 1 shows that the amplitudes of I0 and
are almost in the same order. The magnitude order of
 is around 103 V m−1 (equation (3)), where I0 is about 10−2 A (figure 2(c)), Δl is about 2×10⁻³ m, ω is about 108 rad s−1 (figure 3(b)), ε0 = 8.854×10⁻¹² F m−1, r is in the order of 10−2 m, and cosθ is around 10−2. However, according to Paschen's law, the breakdown electric field intensity at one atmosphere of He is of the order of 105 V m−1 [18], which is two orders of magnitude higher than
in ring II. According to the discharge photographs and microdischarge characteristics [18], the radius of a filament in ring I is of the order of 10−4 m and; thus, the cross-section of filament A1 is of the order of 10−8 m2. The internal surface of ring II A2 = 2πr2l2 is of the order of 10−4 m2, which is about 104 times that of A1, where r2 = 3 mm is the inner radius of glass tube, l2 = 10 mm is the length of Cu electrode. Therefore, the current intensity is composed of a large A2, despite low electric field intensity.
is around 103 V m−1 (equation (3)), where I0 is about 10−2 A (figure 2(c)), Δl is about 2×10⁻³ m, ω is about 108 rad s−1 (figure 3(b)), ε0 = 8.854×10⁻¹² F m−1, r is in the order of 10−2 m, and cosθ is around 10−2. However, according to Paschen's law, the breakdown electric field intensity at one atmosphere of He is of the order of 105 V m−1 [18], which is two orders of magnitude higher than
in ring II. According to the discharge photographs and microdischarge characteristics [18], the radius of a filament in ring I is of the order of 10−4 m and; thus, the cross-section of filament A1 is of the order of 10−8 m2. The internal surface of ring II A2 = 2πr2l2 is of the order of 10−4 m2, which is about 104 times that of A1, where r2 = 3 mm is the inner radius of glass tube, l2 = 10 mm is the length of Cu electrode. Therefore, the current intensity is composed of a large A2, despite low electric field intensity.
According to the Langevin equation [17]

The solution can be expressed by:

Therefore, an ion current is expressed by:

where ni is the ion density, e is the electron charge, vi is the ion velocity, mi is the ion mass, ω is the angular frequency of the current, and S is the superficial area of the electrode. A 90° phase difference is observed between Ii and E(r) when γin = 0. Therefore, the phase difference between I0 and Ii is only 0° instead of 180° when γin = 0. This finding contradicts the phase difference observed in figure 2(c).
Take equation (3) to equation (6):

where
 .
.
Figure 3 shows the fast Fourier transform spectra of figure 2(c) with phase frequency and amplitude frequency. The currents in both rings are mainly composed of direct and low-frequency components. The phases in the blue and yellow regions in figure 3(a) correspond to each other, indicating similar interactions between the filamentary current and its clone. This correspondence gradually disappears when the frequency increases in the order of 109 Hz, as shown in figure 4. The phase shift increases the phase difference in the same frequencies, explaining the phase difference of 180° between
and I0. Phase shifting is caused by γin. The charged particles in ring II are driven by the induced electric field that originates from the filamentary current and move toward the electrode to generate the current. This process can be described by a forced vibration model. If γin is greater than the driving frequency and the system has insufficient time to reach its steady state, then the forced vibration frequency is lower than the driving frequency. In this experiment, the FWHM of the filamentary current is about several nanoseconds. Therefore, the forced vibration cannot reach its steady state in such a short time. As the driving frequency increases, the frequency of
becomes equal to I0 when γin is less than the driving frequency. Therefore, the frequency shift disappears at high frequencies. In addition, the same process occurs when the induced electric field provided by the current in ring II and its clone is present in ring I, explaining the shift of the high-frequency components of the current of ring II in the blue region to the low-frequency components in the yellow region.
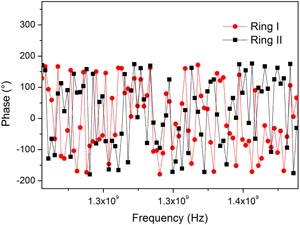
Figure 4. Phase-frequency plot with frequency components in the order of 109 Hz.
Download figure:
Standard image High-resolution imageIn equation (7), γin can be calculated using γin = −ω × tg(Δ∅), where Δ∅ is the phase difference between I0 and
in every frequency component and
 . Figures 5(a) and (b) show γin as a function of the driving frequency in rings I and II, respectively. Several values of γin exhibit negative values. In equation (3), the size and direction of E(r) in the z direction are determined by the degree of θ. The different θ values correspond to different E(r) in size and direction because I0 cannot be located in the axis of ring II. Furthermore, different frequency components may originate from the different positions of filaments, and the different θ values correspond to different E(r) in size and direction. In addition, the positive or negative value of
is determined by its radial direction of ring II. Therefore, the orientation difference in E(r) and
results in several negative ∅ values. The average value of γin in the ring I region is 4.6 × 10⁸ Hz, and that in the ring II region is 2.8 × 10⁸ Hz.
. Figures 5(a) and (b) show γin as a function of the driving frequency in rings I and II, respectively. Several values of γin exhibit negative values. In equation (3), the size and direction of E(r) in the z direction are determined by the degree of θ. The different θ values correspond to different E(r) in size and direction because I0 cannot be located in the axis of ring II. Furthermore, different frequency components may originate from the different positions of filaments, and the different θ values correspond to different E(r) in size and direction. In addition, the positive or negative value of
is determined by its radial direction of ring II. Therefore, the orientation difference in E(r) and
results in several negative ∅ values. The average value of γin in the ring I region is 4.6 × 10⁸ Hz, and that in the ring II region is 2.8 × 10⁸ Hz.

Figure 5. Frequency of collision between ion and neutral particles as a function of frequency component in (a) ring I and (b) ring II regions.
Download figure:
Standard image High-resolution image
γin can be estimated using the mobility of ions μi, which can be expressed by the empirical equation [18]

where μ0 = 0.920 m2 V−1 s−1 and α = 0.040 are constants [18], P = 1.01 × 10⁵ Pa is the atmospheric pressure, and
 is the superposition of the applied electric field Ea, the memory electric field Em, the space-charge electric field Ec and E(r). The appearance of cloning current indicates that
plays a major role in driving the charged particles; thus, Ea, Em and Ec should achieve equilibrium to some extent. Therefore, Es should be in the order of 103 V m−1.
is the superposition of the applied electric field Ea, the memory electric field Em, the space-charge electric field Ec and E(r). The appearance of cloning current indicates that
plays a major role in driving the charged particles; thus, Ea, Em and Ec should achieve equilibrium to some extent. Therefore, Es should be in the order of 103 V m−1.
 is very small compared with 1. Equation (8) can then be simplified to

γin can be calculated using [18]

where λi is the mean free path of the ion–atom, and vi is the migration velocity of the ion. Equation (10) is deduced by assuming that thermodynamic equilibrium occurs. In fact, the distribution of ion energy probably shifts to its high-energy tail when the ions do not fully exchange their energy with the neutral particles. Thus, the estimated value of γin may be lower than the true values.
4. Conclusion
The DBD plasma jet exhibited the clone phenomenon of a filamentary current. γin was measured based on the phase difference between I0 and
. The result of the fast Fourier transform shows that a frequency shift between I0 and
occurs when γin exceeds or is nearly of the same order as the frequency component of I0. This phenomenon leads to around 180° of phase difference between I0 and
. The average value of γin is in the order of 108 Hz.
Acknowledgments
This study is supported by the Natural Science Foundation of China (Grant No. 11105093), the Technological Project of Shenzhen (Grant No JC201005280485A), and the Planned S&T Program of Shenzhen (Grant No JC201105170703A).