

Abstract
The synthesis of graphene with controllable electronic and mechanical characteristics is of significant importance for its application in various fields ranging from drug delivery to energy storage. Electrochemical exfoliation of graphite has yielded graphene with widely varying behavior and could be a suitable approach. Currently, however the limited understanding of the exfoliation process obstructs targeted modification of graphene properties. We here investigate the process of electrochemical exfoliation and the impact of its parameters on the produced graphene. Using in situ optical and electrical measurements we determine that solvent intercalation is the required first step and the degree of intercalation controls the thickness of the exfoliated graphene. Electrochemical decomposition of water into gas bubbles causes the expansion of graphite and controls the functionalization and lateral size of the exfoliated graphene. Both process steps proceed at different time scales and can be individually addressed through application of pulsed voltages. The potential of the presented approach was demonstrated by improving the performance of graphene-based transparent conductors by 30times.
Export citation and abstract BibTeX RIS
1. Introduction
Graphene is a two-dimensional carbon allotrope that is regarded as an enabling material for a wide variety of research areas ranging from electrodes in supercapacitors and batteries to antibacterial coatings and drug delivery vessels [1]. The versatility of graphene applications originates from the vast tunability of properties of graphene-based materials. Pristine graphene's fundamental properties can be changed upon covalent bonding to other elements [2], size confinement [3], or mechanical deformation [4]. As one example, graphene's semi-metallic character can be converted to semiconducting [2], insulating [5], or even superconducting [6] upon functionalization. Furthermore, theoretical predictions for the character of functionalized graphene suggest novel and exciting properties such as morphology-tunable band gaps [7] and spin-selectivitiy [8].
To exploit this adaptability, a suitable production method is required that can generate graphene with widely controllable functionalization at application-relevant scales. Current synthesis techniques, such as chemical vapor deposition and reduction of graphene oxide can only produce graphene with a narrow range of characteristics which limit the usefulness of thus produced graphene to certain applications [1].
Electrochemical exfoliation of bulk graphite has yielded a remarkably diverse range of graphene materials. Some reports have demonstrated exfoliation of single layer graphene [9] while other results exhibited thickness of several hundred nanometers [10]. Furthermore, the flake size can vary by 3 orders of magnitude between several dozens of nanometers [11] and tens of micrometers [12]. Finally, oxygen contents between 7.3% wt. [12] and 30% wt. [13] have been reported. These results highlight the potential of using electrochemical exfoliation to produce graphene with widely tunable properties by controlling the exfoliation process.
Currently, however, no attempt is being undertaken to modify graphene by varying the process parameters, due to the limited understanding of the exfoliation procedure and its impact on graphene. This issue is illustrated by the inconsistency of current literature. No consensus exists on the required voltage, duration of exfoliation or even polarity. Exfoliation experiments have been conducted using less than 2 V [14] or as much as 15 V [15], using anodic oxidation [16] or cathodic reduction [17] or mixtures of both polarities [16]. Finally, process durations between 5 min [18] and 14 h [19] have been reported.
We here investigate the process of electrochemical exfoliation and the effect of exfoliation parameters on the size, thickness, and functionalization of produced graphene flakes. Two distinct steps occur during the exfoliation process that control different properties of the produced graphene. Intercalation of solvent in the graphite lattice affects the thickness of the graphene and can be enhanced through suitable co-intercalants. Expansion of the intercalated solvent into gas bubbles determines the lateral flake size and the onset of exfoliation. Both processes can be individually addressed by varying duration and magnitude of the applied voltage pulses and influence the efficiency of the exfoliation process. The choice of electrolyte can enhance the charge transfer and functionalization. The achievable large variability of thus produced graphene is demonstrated through their application to transparent optical conductors (TOCs) and a variation of performance by more than 30 times was shown. These findings not only enhance the understanding of the electrochemical exfoliation process but open new routes for the synthesis of graphene with controlled functionality.
2. Experiment
Exfoliation of graphene was carried out using natural graphite powder (Alfa-Aesar, 43319-A1) as a starting material. Large-scale electrodes were produced by combining the flakes with a binder (polyvinylidene fluoride, PVDF) and a solvent (1-methyl-2-pyrrolidone, NMP) in a weight ratio of graphite (38%): PVDF (2%): NMP (60%). The resulting paste was applied onto a conductive carrier (tungsten foil) to form electrodes of ∼0.2 g weight and ∼1 cm2 surface area.
After the electrochemical exfoliation, graphene flakes were sprayed onto substrates using an ultrasonic spray deposition system (Sono-tek ExactaCoat).
The thickness and dimension of individual graphene flakes was characterized by their color difference on SiO2/Si substrates using optical microscope images following Wang et al [20]. At least 100 flakes were investigated for every fabrication condition employing automated optical recognition routines using MATLAB.
Sheet resistance measurements were conducted on graphene films on quartz substrates in van-der-Pauw geometry using a home-built four probe station. Transmittance was determined using a UV–visible Spectrophotometer (SV2100).
3. Results and discussion
Several previous reports have proposed a two stage process for graphene exfoliation from bulk graphite [10, 12, 16, 18]. First, an intercalation process takes place that incorporates ions between the graphite layers. Then, an expansion process converts these ions into gas and the resulting volume increase triggers graphite expansion. Despite this understanding, current optimization attempts are aiming at finding a condition that is ideal for both intercalation and expansion [12]. Instead, we address each process step, individually, by applying an electrochemical potential of time-varying duration and magnitude. Since intercalation is expected to proceed more slowly and at lower applied potentials [21] than the expansion of most commonly intercalated ions [12] we employed a double-pulse shape (figure 1(b)). A first voltage segment is applied for an extended duration to assist intercalation (termed intercalation pulse (IP)). The second voltage segment is aiming at initiating expansion and is applied for shorter time (termed expansion pulse (EP)).

Figure 1. (a) Schematic of the exfoliation setup, (inset) photograph of graphite electrode during exfoliation (b) depiction of pulse spectrum with indication of intercalation and expansion pulse, (c) representative time evolution of photodiode current showing an onset of exfoliation around 100 min (intercalation voltage = 2.5 V, expansion voltage = 5 V).
Download figure:
Standard image High-resolution imageThe time-resolved investigation of the exfoliation process was carried out by applying a train of the described double-pulses with a repetition period of 1 min where the IP was applied for 50 s and then the EP was applied for 10 s. The repeated application of intercalation and EPs measurements can reveal the characteristics of the slowest step in the exfoliation process. In order to achieve this goal, a characterization method is needed that can confirm exfoliation with high temporal resolution. Chronoamperometric measurements were found not to correlate with the process of exfoliation and instead show a monotonous increase in current (supplementary figure S1) which is indicative of a slowly varying change in electrode morphology as observed in many electrochemical oxidation processes [22].
We therefore employed a novel in situ absorption measurement to identify the onset and quantify the process of exfoliation. For this purpose, a white light source (3 W LED array) was mounted above the electrochemical cell. A photodiode was placed under the cell to measure the light transmission through the solvent as a function of time (figure 1(a)). Time resolved photocurrent measurements revealed an abrupt increase in absorption when graphene exfoliated from the graphite electrodes and blocked the light path (figure 1(c)).
A strong correlation of the measured onset of exfoliation t0 with EP magnitude (figure 2(a)) was found. We observe that—using identical intercalation conditions—a larger applied EP voltage causes an earlier onset of exfoliation (inset of figure 2(a)) and no such trend is observed for varying the intercalation procedure. This observation suggests that the expansion process is proceeding slower than the intercalation and the magnitude of the EP is a significant parameter in the exfoliation process.
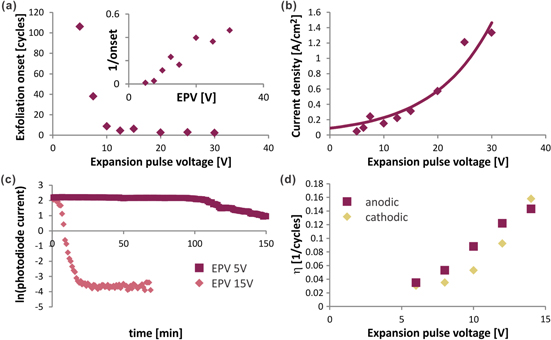
Figure 2. In situ investigation of exfoliation process: (a) onset of exfoliation versus expansion pulse voltage, (inset) plot of inverse value of y-axis indicating a clear proportionality, (b) average current during expansion pulse versus expansion pulse voltage with fit to Tafel equation, (c) time evolution of absorption as measured by the photodiode current on a logarithmic scale showing different onset of exfoliation and exfoliation efficiency for different Expansion pulse voltages, (d) exfoliation efficiency (η) as a function of expansion pulse voltage for both polarities indicating no preference to anodic or cathodic conditions.
Download figure:
Standard image High-resolution imageChronoamperometric measurements were conducted after the onset of exfoliation to identify why such large EP magnitudes are required. A monotonic increase of current can be seen (figure 2(c)). Such an increase in current density with voltage is common for electrochemical reactions and can be described by the Tafel equation

where ΔV is the overpotential, F is Faradays constant, R is the universal gas constant, and T is the temperature.
We can extract the charge transfer coefficient α from fitting the data to equation (1) and obtain α = 2.6 × 10⁻⁴. This value is several orders of magnitude smaller than expected for electrochemical reactions (common metal electrodes exhibit α = 0.5). The observed low electrochemical reactivity explains why most exfoliation experiments are carried out at high voltages compared to common electrochemical conditions.
Previously researchers had observed gas formation during exfoliation (inset of figure 1(a)) and suggested a connection between exfoliation and the formation of gas bubbles. Gas bubbles at the liquid/solid interface could explain the low observed charge transfer efficiency since they decrease the accessible surface area and therefore cause a large polarization resistance between the electrode interface and the electrolyte [23]. In such a scenario a large potential drop exists across the interface and the applied voltage is not closely correlated with the reaction voltage. Furthermore the parallel reaction that is causing bubble formation will obstruct meaningful electrochemical characterization of the exfoliation process.
To obtain a more direct measurement of the amount of graphene exfoliated over time we analyze the time evolution of our in situ absorption measurement in more detail. The current of the photodiode in figure 1(c) should decrease with time according to the time-varying change of the graphene concentration c(t) following Beer–Lambert's law

where I0 is the initial photocurrent (1 μA in our measurements), αA is the absorption coefficient of the graphene solution, and t0 denotes the onset of exfoliation.
Figure 2(c) shows the time-resolved photocurrent on a semi-logarithmic plot. After the onset of exfoliation, a linear dependence of the natural logarithm of the photocurrent with exfoliation time can be observed. This behavior indicates that the concentration c(t) increases linearly with time and that the parameter ∂c/∂t is a constant. We will subsequently refer to this increase in concentration per pulse cycle as 'exfoliation efficiency η' which can be extracted from the slope in figure 2(c). When comparing the photocurrent traces obtained at two different EP voltages, an obvious increase of η with expansion voltage magnitude can be seen. The described absorption measurement is found to be a very reliable method for quantifying the exfoliation yield with a repeatability error of less than 5% between experiments (see supplementary figure S2). We observe a clear trend between exfoliation yield η and the EP magnitude (figure 2(d)) that is similar to the chronoamperometric measurements in figure (2(b)). This similarity corroborates that gas bubbles, which increase the overpotential, are responsible for exfoliation.
To identify the origin of the gas bubbles we correlated η and the polarity of the EP. For this study, EPs with different magnitudes between −15 and 15 V were applied to samples and their exfoliation efficiency η was measured. We find that η does not depend on the polarity of the pulse and exfoliation proceeds at similar efficiency for positive and negative pulses (figure 2(d)). This behavior casts doubt on the previous explanation that intercalated ions, such as sulfate or chlorine ions, are electrochemically expanded and responsible for exfoliation [12]. Intercalated charged ions would instead have a preference towards either cathodic or anodic expansion conditions and would not produce the observed polarization independence. Instead, our results suggest that co-intercalated water is the source of gas bubbles since water electrolysis would proceed under both anodic and cathodic conditions. Since (co-)intercalation occurs on time-scales that are long compared to the EP duration, we now focus on the role of the long-duration IP in the exfoliation process. We find that the IP magnitude has a significant effect on the exfoliation yield η (figure 3(a)) and no exfoliation occurs if only EPs are applied (i.e. the IP magnitude is zero). The observation that EPs as high as 10 V being applied for several hundred cycles is not sufficient for exfoliation to occur, proves that the chosen EP duration is sufficiently small to not cause significant intercalation and that intercalation is indeed a significant step in the exfoliation process.

Figure 3. Effect of intercalation voltage on graphene properties: (a) exfoliation efficiency versus intercalation pulse voltage for three different electrolytes, (inset) photograph of separated half-cells indicating preferential exfoliation at the anode, (b) histogram of flake thickness for different intercalation pulse voltages, (inset) average flake thickness versus intercalation pulse voltage.
Download figure:
Standard image High-resolution imageBy inserting a porous separator between the electrodes, we can identify the polarization dependence of the intercalation process. We find that in a solution with K2+ and SO42− ions only the anode will exfoliate (figure 3(b)). Previous results demonstrated the efficient intercalation of SO42− which can explain the observed preferential reaction of the anode [24]. This result demonstrates that the intercalation of ions has an influence on the exfoliation. The comparison of three different electrolytes, however, demonstrates the independence of the exfoliation mechanism from the choice of intercalating ions: Concentrated sulfuric acid with a high concentration of HSO4− ions was compared to K2SO4 solution that exhibits mainly SO42− ions and to KOH which only contains hydroxide ions. Figure 3(c) shows strong similarities in the trends of η with intercalation voltage irrespective of the species and concentration of ions. This observation is surprising considering the large differences in electrochemical behavior [12] and intercalation efficiency [25, 26]. It is interesting to note that KOH, despite showing a similar trend, shows 100 times lower exfoliation efficiency that other electrolytes.
We conclude that the enhanced intercalation of ions will increase the exfoliation yield, even though these ions are not necessarily taking part in the formation of gas bubbles. The effect of electrolytes seems to go beyond enhanced water co-intercalation as indicated by the virtual identity in η of HSO4− and SO42− ions which should differ significantly in intercalation efficiency and solvation radius [27]. One reason for this behavior could be differences in the interaction between graphene edges and the solvated ions as suggested by Yamada et al [28]. Furthermore, we suggest that future studies consider the differences in diffusivity of solvated-ions within the graphite lattice in order to quantitatively compare the intercalation efficiency of different electrolytes.
In order to identify the effect of enhanced intercalation on graphene properties we investigated the effect of varying the intercalation conditions for one electrolyte. We carried out thickness measurements of graphene flakes produced in K2SO4 solution at increasing intercalation voltages. An increased potential is expected to result in lower intercalation stages, i.e. decreased distance between neighboring intercalant layers,. Figure 3(c) indeed shows that flakes produced at higher IP magnitudes will be thinner.
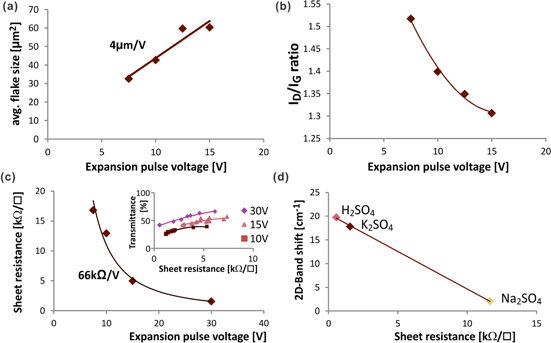
We found no trend of the flake size with intercalation voltage which corroborates our initial finding from time-resolved measurements that intercalation is completed before expansion occurs. Instead, a strong influence of EP magnitude on flake size was observed (figure 4(a)). This trend can be explained when analyzing the defectiveness of graphene for varying EP voltages. As specified by the intensity ratio of Raman D-Band and G-Band, the defectiveness decreases for higher expansion voltages (figure 4(b)). We believe that the efficient formation of gas bubbles at higher expansion voltages can protect graphene from electrochemical oxidation during the exfoliation process and thus reduce the amount of defects that would cause breakage of the graphene flakes.
Figure 4. Performance of graphene TOCs prepared in K2SO4 solution at varying expansion pulse voltages (intercalation pulse voltage 2.5 V): (a) flake size, (b) Raman ID/IG ratio (c) sheet resistance at 50% transparency, (inset) transparency versus sheet resistance for three representative samples, (d) Raman 2D-band shift versus sheet resistance for films exfoliated (intercalation pulse voltage 2.5 V, expansion pulse voltage 30 V) in different electrolytes.
Download figure:
Standard image High-resolution image
The presented results show the variation of graphene's fundamental properties such as thickness, size, and functionalization which were changed by 50, 80, and 20%, respectively, within our experimental condutions.
To illustrate the potential of this control over fundamental properties we exfoliated graphene at different exfoliation pulse magnitudes (using a constant intercalation voltage of 2.5 V) and then spray-deposited it onto quartz substrates where their sheet resistance and transmittance were characterized for varying deposition densities (figure 4(a)). The larger flake size that can be achieved by using larger EP magnitudes is expected to decrease the graphene film resistance by shortening the percolation path length [29]. Indeed we observe that the resistance at 50% transmittance is significantly affected by the EP magnitude. This variability can be even more increased by choosing electrolytes, which increase the functionalization of graphene and thus enhance its carrier density through doping. Figure 4(c) shows a 3000% variation of the resistance at 50% transparency of graphene films exfoliated under identical conditions in different electrolytes that correlates well with the doping induced shift of the Raman 2D-Band position (figure 4(d)). This observed variability in graphene properties under similar process conditions shows the potential for finely controlling the functionalization of graphene by tuning the exfoliation parameters.
4. Conclusion
In conclusion, we have characterized the effect of process parameters on the properties of graphene generated by electrochemical exfoliation. We show that two steps, intercalation and expansion, can be individually controlled by varying magnitude and duration of the applied potential. The co-intercalation of water is required for exfoliation to occur and the efficiency and degree of intercalation determines exfoliation yield and graphene flake thickness. Gas assisted expansion of graphene was found to be the main exfoliation route that determined the size and functionalization of produced graphene. Based on this understanding, large variability in the functionalization of graphene could be achieved which opens up new routes for the synthesis and application of functionalized graphene.
Acknowledgments
MH acknowledges support under NSC-101-2112-M-006-017-MY3. Y P Hsieh acknowledges support under NSC-100-2112-M-194-006-MY3.