

Abstract
This article details the surface-enhanced Raman scattering (SERS) performance of plasmonic substrates fabricated by a physical metal evaporation technique that uses no precursor or intermediate coating. We outline a cost-effective nanofabrication protocol that uses common laboratory equipment to produce homogeneously covered crystalline nanoparticle substrates. Our fabrication yields a homogeneous SERS response over the whole surface. The platform is tested with methylene blue diluted at various concentrations to estimate the sensitivity, homogeneity, and reproducibility of the process. The capacity of the substrates is also confirmed with spectroscopic investigations of human microsomal cytochrome b5.
Export citation and abstract BibTeX RIS

Content from this work may be used under the terms of the Creative Commons Attribution 3.0 licence. Any further distribution of this work must maintain attribution to the author(s) and the title of the work, journal citation and DOI.
1. Introduction
Substrates comprised of arrangements of metal nanoparticles are crucial to the development of chemical and biological sensors [1–6] based on surface plasmon resonance or surface-enhanced Raman scattering (SERS) [7, 8]. Surface roughness on the nanometer length scale is a key element for a Raman signal exaltation [9, 10], and consequently, nanoparticle-covered surfaces have captured much attention for producing reliable sensing platforms. The intensity of the Raman signal depends highly on the optical properties of the metal surfaces and the localized surface plasmon resonances (LSPR), which are important parameters to consider when trying to achieve large enhancements [11–14]. The LSPR wavelength depends on the size, shape, coupling distance, and constitutive material of the nanoparticles [13–16]. Therefore, it is crucial to control the nanoparticle geometry and the surface coverage for optimum sensing capabilities.
The aim of this work is to present a new protocol for designing a homogeneous plasmonic substrate made of crystalline nanoparticles. The added value of our fabrication procedure is that it produces crystalline gold nanoparticles separated by a short interparticle distance (1–3 nm) over the entire substrate surface. These morphological advantages produce a homogeneous SERS response, and hence position-independent spectroscopic measurements.
We calibrate our sensing platform with a well-known molecular reporter, methylene blue (MB), as a reference sample [17–21] to confirm the capacity of our substrates to provide reliable SERS signatures at concentrations ranging from 10−6 to 10−15 M. The sensing capacity of our approach is also tested with a complex human protein. Human microsomal cytochrome b5 is a ubiquitous hemoprotein that plays a role in a number of reduction, oxidative, and elongase reactions as an obligate component or modifier [22]. The protein can be found in a reduced or oxidized form depending on its redox state [23]. The absorption band of cytochrome b5 is centered at 510–560 nm [24, 25]. Our experiments are carried out using an excitation light of 785 nm to evaluate the ability of our substrate to detect vibrational fingerprints of nonresonant proteins at nanomolar concentrations.
2. Experimental details
2.1. Materials
We use N.1 glass cover slips as a substrate (Corning, USA). Trichloroethylene is supplied from VWR. MB and dithiothreitol (DTT) are purchased from Sigma-Aldrich. MB is prepared at four concentrations (10−6 M to 10−15 M) by diluting it with deionized pure water (PURELAB UHQ II, ELGA). The cytochrome b5 is derived from the human microsomal cytochrome b5 [26]. The cytochrome b5 at a 4.8 × 10⁻⁹ M concentration is diluted with 104 × 10−9 M of DTT.
2.2. Nanoparticle-covered substrate fabrication
Glass substrates are thoroughly cleaned with trichloroethylene. The gold crystalline nanoparticles are fabricated by the following two protocols.
2.2.1. Conventional physical vapor deposition method
To compare the advantage of our approach described below, we fabricate a substrate covered by Au nanoparticles using a conventional thermal annealing method. Typically, an amorphous gold film is deposited on a cleaned cover slip by a physical vapor deposition method (PLASSYS MEP300). All thermal depositions are carried out with a base pressure below 2 × 10⁻⁷ Torr in the chamber. Gold is evaporated at a constant rate of 0.05 nm s−1 from a heated tungsten boat. The substrate is rotated during the evaporation to achieve homogeneous deposition. The thicknesses of the evaporated films range from 2 to 10 nm. After the deposition of the Au film, the substrates are annealed in a furnace at 450 °C for 1 h to form crystalline nanoparticles.
2.2.2. Physical vapor deposition method with a glow-discharge cleaning
This fabrication process involves a preparation step that is applied just after the chemical cleaning of the substrate. This preparation step consists of a glow-discharge cleaning (GDC) at 2.8 × 10⁻² Torr for one h. After the GDC, an Au film is evaporated using the same parameters outlined above, with the important difference that the substrates are heated in situ to 450 °C during the entire evaporation. Scanning electron microscopy (SEM, JEOL 6500 and JEOL 7500) is used to investigate the morphology of the prepared substrates. Unless otherwise specified, the instruments are operated with an accelerating voltage of 20 kV.
2.3. Crystallinity of nanoparticles
X-ray diffraction (XRD) measurements are performed to investigate the crystallinity of the nanoparticles. The XRD 2θ patterns are obtained using an x-ray position-sensitive detector (CPS 120, Inel) with Cu Kα radiation from a fixed anode at 40 kV, 40 mA. Data are collected within the range 0 < 2θ < 115° with a 0.03° step size and a 1 s step time.
2.4. Absorbance and SERS setup
The absorbance and SERS spectra are obtained from a home-built configuration. An inverted confocal microscope (Nikon Eclipse Ti-U) is associated with a spectrograph (Shamrock 303, Andor Technology) and a charge-coupled device (CCD) camera (Newton 920, Andor Technology) to procure both absorbance and SERS spectra. The absorbance spectra are recorded under the excitation of a halogen lamp. SERS spectra are obtained via laser excitation at 785 nm (Micro Laser Systems Inc., France). In both measurements, the light is collected by an X 60 objective (Plan Apo VC, N.A:1.2, Nikon).
We post-process all SERS data with a Matlab script to subtract the fluorescent baseline of each spectrum. The parameters for baseline subtraction are chosen after processing all spectra of each sample in order to take into account the baseline variations. The peak positions are estimated for each SERS spectrum for statistical analyses.
3. Results and discussion
3.1. Nanoparticle-covered substrates
In this section, we present the main characteristics of the two Au nanoparticle substrates. The substrates fabricated by standard physical vapor deposition method are referred as 'non-GDC'. The second set of substrates, where the glass cover slips are exposed to GDC in the vacuum chamber prior to Au evaporation, are labeled 'GDC'. The fabrication details for both substrates are listed in table 1.
Table 1. The fabrication details of non-GDC and GDC substrates.
| Non-GDC substrate | GDC substrate | |
|---|---|---|
| Substrate | Glass | Glass |
| Pretreatment | No pretreatment | GDC at 2.8 × 10⁻² Torr for 1 h |
| Au deposition | Physical vapor deposition | Heating of substrate at 450 °C during physical vapor deposition |
| Annealing | 450 °C for 1 h | No annealing |
The originality of our manufacturing method is not related to the annealing of a gold film, which is a conventionally used method, but rather to the surface preparation (see supplementary data, figure 1). Post-annealing an evaporated gold film usually results in a wide distribution of nanoparticle geometry. The poor affinity between the glass surface and the gold causes low adhesion of the film, which recesses inhomogeneously during the heat treatment. Figure 1(a) shows a characteristic scanning electron micrograph of the large variety of shapes produced, including spherical forms, nanorods, and pentagon-like geometries. We performed a statistical analysis on the SEM images to determine the size distribution of the nanoparticles. For this purpose, a Matlab script using the Otsu method [27] was implemented to identify the nanoparticles on the surface. The average radius (R) of the nanoparticles was found at R = 29 ± 8 nm for the non-GDC substrate, as shown by the histogram of figure 1(a).
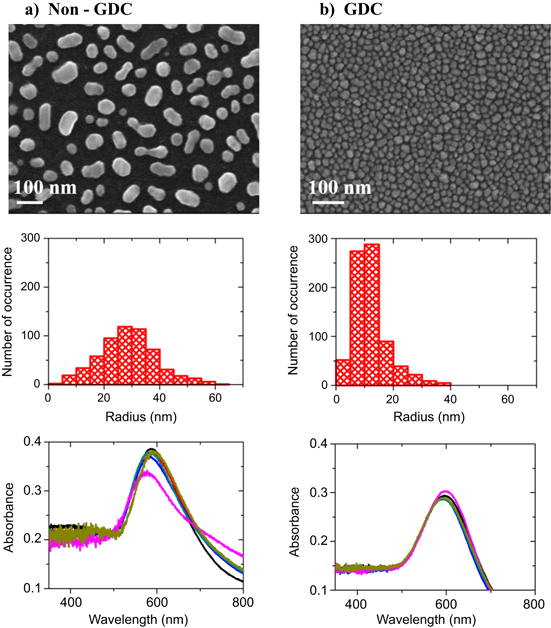
Figure 1. SEM images of (a) a substrate obtained without a GDC, and (b) with a GDC pretreatment. The corresponding radius histograms and absorbance spectra are shown below the SEM images. The absorbance spectra were taken at six different locations on the substrate surface. The spectra were normalized to the same baseline.
Download figure:
Standard image High-resolution imageTo improve the surface wettability, we developed an in situ pretreatment using a GDC that was performed at a pressure of 2.8 × 10⁻² Torr for 1 h. This cleaning step dissociates water molecules, forming OH radicals and H atoms [28, 29]. The OH radicals remain on the surface in a strongly bound state, and only the hydrogen molecules are desorbed to the gas phase and pumped out of the chamber. The uniform presence of OH radicals confers a better adhesion of the gold film on the surface (see supplementary data, figure 2) and yields a homogeneous distribution of nanoparticles during the evaporation step. Figure 1(b) displays a micrograph of the resulting surface morphology after the GDC process. There is a clear improvement in the nanoparticle homogeneity, with almost uniform sizes and forms. The radius histogram features a narrower distribution compared to the non-GDC substrate, with R = 12 ± 7 nm. We finally note that the interparticle distance for the GDC substrate ranges between 1 nm to 3 nm on the entire substrate, thus enabling optimum near-field coupling.
In the following, we investigate the plasmonic response of the substrates by measuring their absorbance spectra at six different locations in order to analyze their homogeneity and reproducibility. The measurements for the respective substrates are reported at the bottom of figure 1. A marked resonance is visible for both types of substrates. Despite the smaller nanoparticle size of the GDC substrate, we observe a residual redshift compared to the non-GDC substrate. This shift probably originates from the small interparticle distance and the associated increased coupling. The six spectral resonances for the GDC substrate are constant to about 3 nm, regardless of the observation position. These results confirm the high homogeneity of the GDC substrates over the entire surface, which is in agreement with the SEM images.
Finally, we investigate the nature of the Au nanoparticles with an x-ray diffractometer. The resulting spectra are displayed in figure 2 for the GDC substrate. Characteristic 2θ values, indicated by the arrows, occur at 38°, 44°, 64°, and 77°. The edge lengths (a = b = c) and interaxial angles (α = β = ϒ = 90°) of the crystalline structure are found to be equivalent. According to these results, we assume that the substrates are comprised of crystalline gold nanoparticles with a face-centered cubic lattice. The space group of the crystalline is Fm3m, known as the rock-salt structure.

Figure 2. XRD pattern of the GDC substrate. The arrows indicate the corresponding Au peaks at 38°, 44°, 64°, and 77°, confirming that the Au nanoparticles have a crystalline signature.
Download figure:
Standard image High-resolution image3.2. Methylene blue
The SERS performance of both non-GDC and GDC substrates is evaluated by detecting the Raman spectra of MB at a 10−6 M concentration. All the experiments are carried out in an aqueous medium at a constant temperature of 20 °C. The vibrational spectra are reported in figures 3(a) and (b) for the non-GDC and GDC substrates, respectively. We record a SERS intensity that is approximately 100 times stronger with the GDC substrate. This is linked to the unique surface geometry (homogeneous size and very short interparticle distances) of this substrate, which evidently produces stronger signal enhancement. Hence, for the remainder of this paper, only results obtained with a GDC substrate are discussed.

Figure 3. SERS spectra of MB at a concentration of 10−6 M on non-GDC substrates (red line) and GDC substrates (blue line).
Download figure:
Standard image High-resolution imageWe then investigated the SERS response of the molecules exposed to the GDC substrates at four different concentrations: 10−6 M, 10−9 M, 10−12 M, and 10−15 M. Figure 4 displays the corresponding Raman spectra acquired with the same experimental parameters. Seven characteristic Raman bands of MB [18] are labeled by lines on the spectra and given with the corresponding band assignments in table 2. Fluctuations of the Raman line intensities and spectral wanderings are observed for concentrations lower than 10−6 M. These effects are subject to intense discussion in the literature [30–32] and are usually explained by the nature of the enhancement processes [33, 34], the diffusion of the specimens [35, 36], and measurements at the single-molecule level [37, 38]. Among the four spectra, the largest number of peaks detected are unsurprisingly observed for the highest concentration, since the Raman intensity is concentration dependent [39, 40].
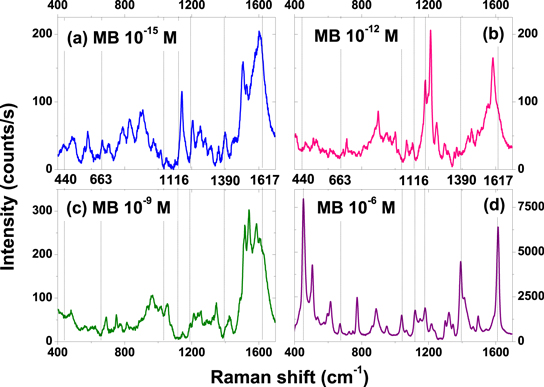
Figure 4. SERS spectra of MB at various concentrations on a GDC Au nanoparticle substrate. The known peaks are indicated by the vertical lines.
Download figure:
Standard image High-resolution imageTable 2. The Raman shifts, peak occurrence, and band assignments of MB are taken from Xiao et al [18]. Abbreviations: ʋ, stretching; α, in-plane ring deformation; β, in-plane bending; ϒ, out-of-plane bending; and δ, skeletal deformation.
| Peak N° | Raman shift (cm−1) | Occurrence (%) | Band assignments |
|---|---|---|---|
| 1 | 440 | 33 | δ(C-N-C) |
| 2 | 663 | 14 | ϒ(C-H) |
| 3 | 1032 | 24 | β(C-H) |
| 4 | 1116 | 23 | ϒ(C-H) |
| 5 | 1177 | 25 | ʋ(C-N) |
| 6 | 1390 | 31 | α(C-H) |
| 7 | 1617 | 30 | ʋ(C-C) ring |
We used a Matlab script to determine the peak position for each spectrum. A total of 392 SERS spectra were archived for each concentration, and all of them were statistically analyzed. Thirty-eight peaks were observed on the spectra and among them, 25 coincide with the literature [18, 21, 41]. We calculated the observed peak occurrence for all the Raman shifts in figure 5. The maximum occurrence value is 55%. This number results from the inclusion of the SERS data for the lowest concentration (10−15 M) in the calculation. If only the SERS spectra obtained at 10−6 M were taken into account, the lines at 440 cm−1, 605 cm−1, 767 cm−1, 881 cm−1, 1032 cm−1, 1116 cm−1, 1213 cm−1, 1319 cm−1, 1412 cm−1, and 1617 cm−1 occurred in more than 80% of the recorded spectra. Table 2 presents seven Raman bands with vibrational assignments.

Figure 5. SERS spectrum of MB and the occurrence histogram of peak positions obtained from all SERS spectra at different concentrations (392 SERS spectra analyzed for each concentration).
Download figure:
Standard image High-resolution imageTo assess the spatial reproducibility of the measurement, in figure 6(a) we show a confocal map of the spectrally integrated SERS response as a function of sample position with respect to the laser focus. The 60 × 60 μm scan is obtained from an MB solution concentrated at 10−6 M. We chose this concentration to insure homogeneous spatial coverage of the molecules on the substrate. The histogram of detected photon counts (inset of figure 6(a)) indicates a relatively narrow distribution centered at 2 kcnts/s. SERS spectra collected from three different positions labeled on the map are shown in figure 6(b). For such concentrations, the observation point has almost no impact on the peak position. This is linked to homogeneity of the interparticle distances and nanoparticle sizes already emphasized in figure 1(b), which yield to a homogeneous Raman response across the sample. A few pixels of the Raman intensity map generate a higher Raman intensity (bright spots) and probably result from residual structural defects of the substrate or a local aggregation of the molecules. Note that the amplitudes of the SERS signals in figures 6(a) and (b) differ because the confocal image represents an integrated signal measured with an avalanche photodiode, whereas the spectra are acquired with a CCD camera with a different quantum efficiency. Finally, we note that we detected seven specific Raman bands of MB even for attomolar concentrations (440 cm−1, 663 cm−1, 1032 cm−1, 1116 cm−1, 1177 cm−1, 1390 cm−1, and 1617 cm−1; see figure 4). Because of the high homogeneity of GDC substrates, the spatial reproductibility of the SERS spectrum is only a function of the molecular distribution on the substrate.
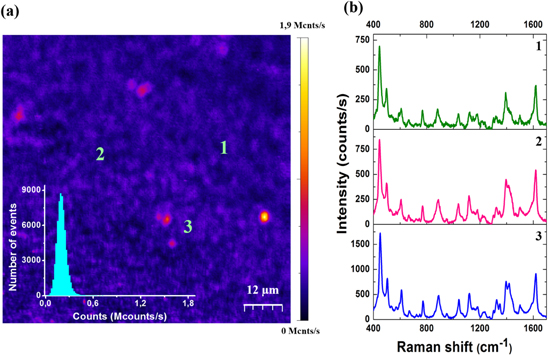
Figure 6. (a) Confocal integrated Raman intensity map obtained at 10−6 M of MB on a GDC Au nanoparticle substrate. Inset: Histogram of the count rate evaluated from the image. (b) SERS spectra collected from the positions indicated on the Raman confocal map.
Download figure:
Standard image High-resolution image3.3. Cytochrome b5
For the sake of completeness, we now present the SERS response of cytochrome b5, a nonresonant biologically relevant protein, detected with our GDC substrate. Cytochrome b5 is a hemoprotein involved in the transport of electrons, and its SERS response is relatively unknown. The protein is derived from human microsomal cytochrome b5 by genetic engineering, resulting in the substitution of (i) the 26 C- terminal amino-acid residues by the—NGHHHH{COOH sequence, and (ii) the serine 23 in Hb5(His)4 by a cysteine, as previously described [42]. Cytochrome b5 is reduced with DTT to form monomers and to immobilize the protein onto the Au nanoparticle substrate. Reduced cytochrome b5 is able to form gold-thiol bonds, leading to direct self-assembly onto the gold surface by chemisorption [43].
The SERS spectrum of cytochrome b5-DTT is presented in figure 7. We compared our data with those obtained with purified cytochrome b5 from rat liver or horse liver microsomes [24, 25]. We found that the peaks at 736 cm−1, 934 cm−1, 1141 cm−1, 1172 cm−1, 1223 cm−1, 1383 cm−1, and 1559 cm−1 are common to the protein, regardless of its origin. These bands in our SERS spectra are slightly shifted compared with those of the Raman spectrum; this can be linked to the presence of the metal substrate [18]. Similarly, we observe peak coincidences with the resonance Raman spectra of cytochrome b558 [44]. The occurrence of the peak positions is given at figure 7. The wavenumbers at 790 cm−1, 1006 cm−1, 1172 cm−1, 1265 cm−1, and 1383 cm−1 have more than a 50% occurrence.

Figure 7. SERS spectrum of cytochrome b5-DTT (4.8 × 10⁻⁹ M:104 × 10−9 M) solution and histogram of peak positions.
Download figure:
Standard image High-resolution image
4. Conclusions
While SERS permits a detailed analysis of molecular vibration, its usage as a large-scale analytical tool is contingent on the development of reliable enhancing substrates. In this paper, we provide a solution for delivering performant, low-cost SERS substrates characterized by structural homogeneity and relative ease of realization. Our approach is based on a simple GDC of a glass substrate and a subsequent heating of the surface during the thermal evaporation of a gold layer. The combination of these two basic steps leads to the formation of crystalline gold nanoparticles with a narrow size distribution and interparticle distance. The sensitivity of the SERS substrate is evaluated with MB detected at different concentrations (10−6 to 10−15 M). We have identified seven specific vibrational bands of the molecule even for an attomolar concentration, thus emphasizing the sensibility of our proposed substrates. Unlike other high-amplification SERS substrates based on specific arrangement of nanoparticles [45–49], here the signal is homogeneously distributed over the entire surface. We further tested our substrate's ability to detect the SERS signature of a human-derived microsomal cytochrome b5 protein. By measuring the SERS spectrum of the protein at a nanomolar concentration, we claim that our fabrication protocol has promising potential for biomolecule detection and identification at reduced cost and complexity. As a final note, we mention that we generalized our approach to forming crystalline nanoparticles with different metals (Ag, Al) and bimetals (Ag-Au) and controlling their size and distribution on glass or silicium substrates. We believe that this adaptable fabrication procedure will also contribute to increasing the range of applications of plasmonic sensing.
Acknowledgments
The research leading to these results has received funding from the regional council of Burgundy under the PARI Program. This project is in cooperation with the Labex. ACTION program (contract ANR-11-LABX-01-01).