
Abstract
The bioluminescence resonance energy transfer (BRET) between firefly luciferase enzymes and semiconductive quantum dots (QDs) with near infrared emission is described. The QD were phase transferred to aqueous buffers using a histidine mediated phase transfer route, and incubated with a hexahistidine tagged, green emitting variant of firefly luciferase from Photinus pyralis (PPyGRTS). The PPyGRTS were bound to the QD interface via the hexahistidine tag, which effectively displaces the histidine layer and binds directly to the QD interfaces, allowing for short donor–acceptor distances (∼5.5 nm). Due to this, high BRET efficiency ratios of ∼5 were obtained. These PPyGRTS-QD bio-nano conjugates were characterized by transmission electron microscopy, thermal gravimetric analysis, Fourier transform infrared spectroscopy and BRET emission studies. The final optimized conjugate was easily observable by night vision imaging, demonstrating the potential of these materials in imaging and signaling/sensing applications.
Export citation and abstract BibTeX RIS
1. Introduction
Semiconductor nanocrystals have been heavily utilized in resonance energy transfer (RET) schemes due to their absorption profile, size tunable emission, high photostability, and long excited-state lifetimes [1, 2]. The unique optical properties have made quantum dots (QDs) and rods (QRs) ideal energy donors, with successful RET to molecular fluorophores and fluorescent proteins [3–5]. Conversely, however, the large extinction coefficients and broad absorption spectrum that make these materials efficient donors limit their application as discrete energy acceptors due to co-excitation of donor and acceptor [6, 7]. The use of chemiluminescence, where the donor is activated chemically rather than radiatively, circumvents this problem. Specifically, the use of natural bioluminescence for energy resonance transfer (BRET) has been shown to be effective with proteins [8], dyes [9], QDs [6, 10–13], or QRs [14, 15] as acceptors. The first demonstration of a QD-based BRET utilized blue emitting R. reni-formis luciferase (rLuc) which contained exposed lysine groups for conjugation to carboxylate groups on polymer wrapped QDs [6]. Following this milestone, BRET has been shown for many different QD colors [6, 10, 11], including near infrared (nIR) emitters. The nIR emitters are fundamentally interesting for in vivo imaging [5, 16, 17], as light emitted in this region is both absorbed and scattered less by tissue [6, 10]. Several BRET nIR nanosystems have been shown based on the rLuc protein variant, with BRET efficiency ratios of 1.3 and 0.118 for CdSe/ZnS [6] and PbS QDs [18], respectively. Notably, the PbS QDs were synthesized in the presence of the protein and retained 86% of the bioluminescence after 1 h [18]. In addition, the use of horseradish peroxidase and QDs has been shown to result in nIR BRET when both components were polymer wrapped in nanocapsules [19].
In this study, we show that direct attachment of a bioluminescence protein, Photinus pyralis (PPy) [14], to the surface of a nIR emitting QD results in high BRET ratios (BRs). Using a green emitting variant of PPy (PPyGRTS) with emission at 547 nm in the presence of luciferin substrate (LH2), Mg-ATP, and oxygen, at pH of 7.8 [20], efficient BRET between the protein and the QD is demonstrated. Anchoring of PPyGRTS directly to the QD surface is accomplished with a N-terminus hexahistidine tag (6xHis), which coordinates to the cation rich QD interface [14, 21–24], and thus leads to greatly diminished donor–acceptor distances (∼5.5 nm). With high efficiencies that surpass previous implementations, these nIR QD-PPy conjugates show great promise for applications that utilize nIR light.
2. Experimental description
2.1. Chemicals and materials
The hydrophobic QD(800) stock was purchased from Invitrogen (Life Sciences), and used as received. L-histidine (His, >99.8%), sodium borohydride (NaBH4, >96%), sodium tetraborate (99.5%), boric acid (>99.5%), gly–gly (BioUltra, ≥99.5%), toluene (≥99.5%), chloroform (>99.8%), methanol (>99.8%), acetone (99.5%) were purchased from Sigma Aldrich. Ultrapure water (18.2 MΩ) was from a Sartorius Stedim Arium 61316 reverse osmosis unit combined with an Arium 611DI polishing unit. The Mg-ATP (bacterial source) was purchased from Sigma-Aldrich, and restriction endonucleases from New England Biolabs (Beverly, MA). Firefly luciferin (LH2) was a generous gift made to the Branchini lab from Promega (Madison, WI).
2.2. Experimental design
2.2.1. PPy expression
The PPy WT was expressed as a GST-fusion protein and purified by affinity chromatography and stored as described in detail previously [20, 25]. Briefly, the plasmid for 6xHis-PpyGRTS was constructed by excising the corresponding genes for PPyGRTS from the pGEX-6P-2 vector and ligating them into a modified pQE30 expression vector using previously described procedures [9]. Protein concentrations were determined with the Bio-Rad protein assay system using BSA as the standard. DNA sequencing to verify the ligations was performed at the W M Keck Biotechnology Laboratory at Yale University.
2.2.2. Histidine-mediated QD phase transfer and characterization
In order to phase transfer the as purchased QD(800)'s from toluene to borate buffers we employed a phase transfer technique we recently developed [21]. Briefly, the organic ligands of the QD(800) were directly exchanged with L-histidine (His), producing a His-capped QD(800) that was optically and colloidially stable. In a typical experiment, His was added to a chloroform solution of QD(800) at a ∼5000-fold [His]:[QD(800)] molar excess. Then excess His molecules were removed via precipitation with acetone. Finally the QDs were dispersed in 10 mM borate buffer and refrigerated before use. The QD(800) concentration was calculated using the size dependent molar extinction coefficient ( ) [26] from the supplier (Invitrogen), where = 2.0 × 10⁶ M−1 cm−1 at 550 nm. The UV–visible (UV–Vis) absorbance measurements were collected on a Varian Cary100 Bio UV–Vis spectrophotometer. The emission and bioluminescence spectra were collected on a Fluoromax-4 spectrofluorometer (Horiba Jobin Yvon). Quantum yield (QY) was determined using the standard calculations [27] (see SI for further details). Time correlated single photon counting (PL decay) measurements were performed at Brookhaven National Laboratory in the Center for Functional Nanomaterials USER facility. The PL decay were measured using a 420 nm pulsed laser excitation based on a frequency doubled diode-pumped Ti:Sapphire laser system (Newport Spectra Physics, 8 MHz repetition rate, 60 fs pulse width) and a Fluorotime 200 time-resolved fluorescence spectrometer (Picoquant GmbH).
2.2.3. PPyGRTS-QR conjugations and characterization
To construct the PPyGRTS-QD(800) conjugates, the His-functionalized QD(800) were incubated with the PPyGRTS in 10 mM borate buffer at loading ratios, L = [PPyGRTS]/[QD(800)] on ice. Incubation was allowed to proceed for at least 15 min before BRET analysis. The conjugates were characterized by transmission electron microscopy (TEM), thermal gravimetric analysis (TGA), and Fourier transformed infrared (FTIR) spectroscopy. TEM measurements were performed on a JEOL 2000EX instrument operated at 100 kV with a tungsten filament (SUNY-ESF, NC Brown Center for Ultrastructure Studies), with negative staining achieved using phosphotungstic acid. TGA experiments were performed on a PerkinElmer Pyris1 TGA with a thermal analysis gas station and under 20% O2 in N2 purge with a heating rate of 5 °C min−1 after drying the samples prior to analysis. FTIR measurements were collected on a Thermo Nicolet 6700 FTIR equipped with a diamond smart iTR attenuated internal reflectance accessory, and a liquid N2 cooled MCT-A detector. Samples were drop cast as neat solutions, or dried powders, and dried under N2.
2.2.4. BRET measurement and analysis
In a typical BRET experiment, a mixture of 100 μL of 91 μM LH2 (firefly luciferin) and 30 μL of 8.66 mM Mg-ATP in 25 mM gly–gly buffer (pH 7.8) is quickly added to the PPyGRTS-QR(800) conjugate solution in a 96-well plate and bioluminescence emission is immediately collected. The bioluminescence and BRET were collected on a Varian Cary-Eclipse spectrophotometer in bioluminescence/chemiluminescence mode using a 96-well plate reading accessory. The spectra are corrected for detector sensitivity by comparison of fluorescence standard emission intensities (450–950 nm) with the corrected detector on the Fluoromax-4 spectrophotometer. White 96-well plates were employed, with volumes ranging from 50–200 μL. Bioluminescence spectra were collected every 15 s for 7.5 min. The presented BRET results are the average of the first five spectra collected over 1.5 min after addition of LH2. Finally, the BRET efficiencies of the systems were calculated as BR, which is defined as the ratio of peak area of the acceptor and donor emission respectively. Peak area was calculated by spectral deconvolution of each spectrum using the data analysis package in Igor Pro (Wavemetrics).
Theoretical assessment of BRET efficiency was conducted in the identical manner to FRET. In FRET, the Förster distance (R0) is calculated using equation (1) [2]:

where η is the refractive index of the medium (ηD = 1.33), kp is the polarization parameter (κ = 2/3), QD is the donor quantum yield QY(GRTS)≈32%, and J is the spectral overlap integral. The J value can be calculated using equation (2):

where λ is the defined wavelengths of the donor–acceptor spectral overlap (λ = 450–650 nm), and fD(λ) is the integrated donor emission and A(λ) represents the integrated acceptor absorption using the acceptor extinction coefficient (A = 2.0 × 10⁶ M−1cm−1). The values of R0 = 10.6 nm, and 2.37 × 10⁻¹¹ M−1 cm3 were calculated using equations (1) and (2) as well as the software PhotoChemCAD for QD(800). Using the R0 values calculated above, the FRET efficiency, E, was calculated using equation (3) [2]:

where r is the distance between the active site of the PpyGRTS and the QR dipole.
3. Results and discussion
3.1. Synthesis and characterization of BRET nanoconjugates
The general QD functionalization strategy is outlined in scheme
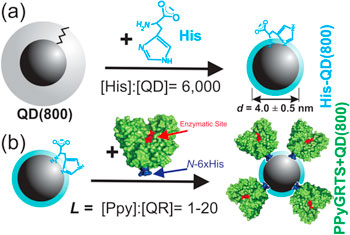
Scheme 1. (a),(b) An idealized schematic of the alkyl-capped QD(800) QDs that were phase transferred by ligand exchange with histidine (His), which rendered the QD(800)s hydrophilic and colloidially stable (a). Next the QDs are incubated with 6xHis tagged PPyGRTS at increasing loading ratios, L = [PPy]:[QD(800)], between 0.5–10 (b).
Download figure:
Standard image High-resolution image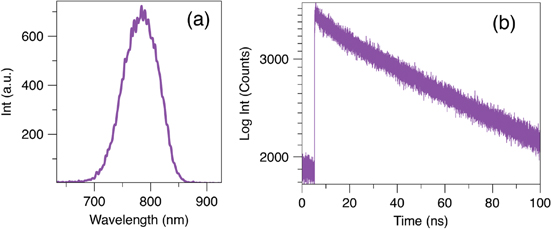
Figure 1. PL emission (a) and PL-decay (b) of QD(800). The excitations were 530 and 420 nm respectively. A single exponential was used to fit to PL-decay, yielding lifetime (τ) of 77.8 ± 1.3 ns.
Download figure:
Standard image High-resolution imageThe PPyGRTS + QD(800) conjugates were then characterized. Figure 2 shows a TEM micrograph of the conjugates at L = 5 after negative staining with phosphotungstic acid (a), and before staining controls (b). The bright halos corresponding to the PPyGRTS layer can be observed surrounding the QD. Further analysis of the TEM resulted in a calculated QD(800) diameter of d = 4.0 ± 0.5 nm.
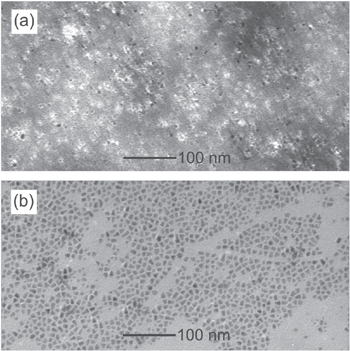
Figure 2. TEM micrograph of PPyGRTS-QD(800) conjugates at L = 5 after negative staining with phosphotungstic acid (a), and before staining (b). Statistical analysis of b shows a diameter of d = 4.0 ± 0.5 nm (c).
Download figure:
Standard image High-resolution imageNext, conjugation was characterized via TGA. Here, mass loss is directly related to the lightweight His monolayer, and the heavier PPyGRTS (MW ≈ 60 kDa). Figure 3 a shows a representative TGA profile for the QD(800) before (i), and after (ii) phase transfer, where a mass loss of 51% and 25% was measured, respectively. These results provide conformation of monolayer exchange and subsequent phase transfer, since the His has much lower MW compared to typical hydrophobic capping ligands like TOPO, etc. For the PPyGRTS + QD(800) conjugates, a mass loss increase was observed as a function of increased L. Specifically, as L increased from 11–43, a successive increase from 66 to 88% was observed (iii–v), indicating increased weight loss due to additional proteins residing on each QD.

Figure 3. (a) TGA results characterizing the original hydrophobic QD(800) (i), the His-QD(800) after phase transfer and purification (ii), and the PPyGRTS-QD(800) conjugates at L = 11 (iii), 22 (iv), 43 (v). (b), (c) FTIR characterizing the low and high energy vibration regions for His-QD(800) (i) and conjugates at L = 10 (ii).
Download figure:
Standard image High-resolution imageThe conjugates were also studied via FTIR (figures 3(b) and (c)). Compared to the His-QD(800) (i), the PpyGRTS + QD(800) conjugates show sharp vibrations at ≈ 1627, 1551 cm−1 for L = 10 (ii), which are characteristics of amide-I and amide-II modes originating from the protein [31, 32]. Amide-III modes are also present at ≈ 1290 cm−1. While the amide-I modes are due to C=O stretching, amide-II and III are attributed to CN stretch and NH bend within the protein. There are also sharp vibrations at 3177–3184 cm−1, indicating the presence of amide-A and B modes, which arise from NH stretching.
3.2. Quantifying BRET to NIR QDs
We next studied the emission properties of the PPyGRTS + QD(800) conjugates. Upon addition of the substrate luciferin (LH2) to a solution of the conjugates, we observed little visible light associated with the PPyGRTS bioluminescence, suggesting the efficient energy transfer into the nIR. Figure 4 quantifies this energy transfer, and shows a typical set of BRET emission results at L = 1 (a), 2 (b), 5 (c), and 10 (d). We chose this range to limit the potential for free PPyGRTS in solution, since each QD800 can ideally pack 11–13 proteins, based on geometric models. Features of this data are the donor emission red-shifted by ∼250 nm, the absence of other external excitation, and the substrate based activation. The BRET efficiency was quantified by calculating the so-called BR [6, 10], in which the integrated emission of the acceptor (QD(800)) is divided by the integrated emission of the donor (PPyGRTS). For example, at L = 1 a BR of 3.9 was calculated. Also shown is BRET for conjugates at L = 2.0 (b), 5.0 (c), and 10 (e), in which we observe that the BR slightly fluctuates between 4 ∼ 5 for each, as shown in the histogram plotting BR versus L in the inset of figure 4(e). The observation of high BR at low loading ratios, L = 1.0–2.0, has been reported before [6, 14], and is a unique phenomenon for BRET systems compared to FRET analogs. Another characteristic of these systems is the relatively high noise value at L = 1–2 (a) and (b) compared to L = 5–10 (c) and (d). We speculate that this is due to the possibility that at low L some QD(800) are unconjugated due to stochastic binding at those ratios, since any unbound QD(800) will remain dark, which is reflected in the low intensity of emission (figure 4(a)). At higher L, a more equal population of QD(800) will be conjugated, allowing for higher numbers of QD(800) emitting, and higher intensity values (vide infra). The exact mechanism for the decrease BR at higher L is still under investigation. Recently, researchers showed that increased coverage of cytochrome C on a gold nanoparticle decreased the particles ability to act as an plasmonic quencher, revealing that a energy transfer gating process may be occurring, in which the dielectric change provided by the protein layer disrupts energy transfer [33]. In our system, this increased coverage may screen the bound LH2 environment, which is the source of the bioluminescence.

Figure 4. Representative BRET emission spectra between PPyGRTS and QD(800) at L = [PPyGRTS]:[QD(800)] = 1.0 (a), 2.0 (b), 5.0 (c), and 10 (e). Insets: PPyGRTS emission in absence of QD(800) (a), bar graph summarizing measured BR dependence on L (d).
Download figure:
Standard image High-resolution imageThis phenomenon may also arise due to a small degree of uncertainty (∼20%) in regards to the molar concentrations of QD(800) that were estimated here based on supplier estimates of extinction coefficients (QD(800) ≈ 2.0 × 10⁶ M−1 cm−1). It is important to note that the presence of emission at 550 nm does not necessarily correspond to free PPyGRTS, but instead, incomplete energy transfer. Moreover, multiple repeat experiments resulted in similar BRET efficiencies (figure S1), and control experiments without 6xHis tagged PPyGRTS resulted in no BRET. Finally, the approximate excess loading ratio was found to be L > 10, above which free PPyGRTS remain unbound in solution. Figure S2 shows the BRET spectra at L = 20 before and after incubating with Ni-sepharose beads, which bind and remove the free His tagged PPyGRTS. A BR increase from 2 to 4 was observed after purification, suggesting the removal of free proteins at those L values.
To better understand these results, the spectroscopic properties and FRET parameters were compared, as shown in figure 5. Since the QD(800) has a first absorption maximum of ∼790 nm, it has a significantly broad absorption profile that covers the visible spectrum and has a high extinction coefficient near the PPyGRTS emission maximum ( ≈ 2.0 × 10⁶ M−1 cm−1 @ 550 nm). As a result, the calculated spectral overlap integral, J, is 2.37 × 10⁻¹¹ M−1 cm3, which in combination with the PPyGRTS donor [14], results in a Förster distance (R0) of 10.6 nm [2]. If the QD(800) are treated as spherical, the maximum distance between the QD(800) core, to the active site on the PPyGRTS, is r ∼ 5.5 nm, a value well below the R0 (figure 5(b)), and one that theoretically should result in a ≈97% efficiency under normal spherical dipole orientations. Compared to other BRET nanosystems [5, 6, 10, 11, 17–19], the present BR values are 2 ∼ 3x higher. This efficiency increase is attributed largely to the high QY of the PPyGRTS, and its direct attachment to the QD interface (i.e. r < R0). One likely limit to even higher BRET efficiency is that compared to traditional CdSe/ZnS QDs (τ ≈ 10–20 ns), the longer lifetimes of the QD(800) (τ ≈ 77 ns), may also be introducing a bottle-neck in the energy transfer process.

Figure 5. The QD(800) and PPyGRTS spectral properties (a), and the calculated BRET efficiency plot with idealized PPyGRTS-QD(800) distances (r) (b).
Download figure:
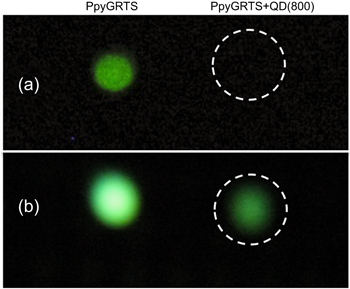
Standard image High-resolution imageBecause of the high BRs of ≈5.0, and emission at 788 nm, this BRET nanosystem is easily observed via modest nIR imaging. Shown in figure 6 are digital images collected from a home-built setup using commercially available night vision goggles. For example, figure 6(a) shows a digital image of a 96-well plate containing the PPyGRTS (left) and PPyGRTS + QD(800) (right) systems collected using a traditional digital camera. Only a faint PPyGRTS spot can be observed, and no light is detected from the PPyGRTS-QD(800) conjugate due to BRET. The identical system can be observed easily using night vision, however. Note that the false green colors observed are due to the goggles and are not the colors of the sample. Figure 6(b) is imaged using a nIR camera, and the PpyGRTS + QD800 is now clearly visible (right). This system is fully scalable, as is illustrated by figure S3, in which a large PDMS pattern is filled with PPyGRTS + QD(800) and imaged.
Figure 6. (a) Photograph comparing the bioluminescence of PPyGRTS (left), and PPyGRTS + QD800 BRET (right) taken with standard digital camera (a), and a digital camera attached to night vision goggles (b). Note that the green color is an artifact of imaging, and not the true color of the systems.
Download figure:
Standard image High-resolution image
4. Conclusions
In summary, we have shown that when directly attached to a nIR QD, firefly P. pyralis luciferase variants (PPyGRTS) can effectively transfer bioluminescence energy with high efficiency to nIR emitting QDs. The direct attachment of the PPyGRTS to the QD interface, and the high spectral overlap arising from the QD acceptor, resulted in high BRET efficiencies. The bio-nano conjugates were characterized by TEM, TGA, and FTIR, which confirmed conjugation of PPyGRTS to the QD(800), and optimum loading efficiency of 1–5 was determined, which results in BRs of 4–5. The resulting conjugate emission is largely invisible to the eye, but easily observed via night vision (i.e., nIR) detectors, thus allowing these materials to contribute to the fields of infrared signaling and sensing, and in vivo imaging, each of which take advantage of a chemical substrate fuel to produce light.
Acknowledgments
This work was supported by a PECASE grant from the Air Force Office of Scientific Research (AFOSR, FA9550-10-1-0033). Additional support was provided by the Syracuse University (SU) Syracuse Biomaterials Institute, and the SU Forensic & National Security Sciences Institute (FNSSI). MMM acknowledges a FNSSI faculty fellowship. BRB acknowledges financial support provided by the AFOSR (FA9550-14-1-0100), and the Hans & Ella McCollum'21 Vahlteich Endowment. We thank Dr Mircea Cotlet at Brookhaven National Laboratory for assistance with PL decay measurements, which were performed as users of the Department of Energy (DOE) Center for Functional Nanomaterials at Brookhaven National Laboratory (DE-AC02-98CH10886).