
Abstract
The controlled patterning of anisotropic gold nanoparticles is of crucial importance for many applications related to their optical properties. In this paper, we report that gold nanorods prepared by a seed-mediated synthesis protocol (without any further functionalization) can be selectively deposited on hydrophilic parts of hydrophobic–hydrophilic contrast patterned substrates. We have seen that, when nanorods with lengths much smaller than the width of the hydrophilic stripe are used, they disperse on these stripes with random orientation and tunable uniform particle separation. However, for nanorods having lengths comparable to the width of the hydrophilic stripes, confinement-induced alignment occurs. We observe that different interactions governing the assembly forces can be modulated by controlling the concentration of assembling nanorods and the width of the hydrophilic stripes, leading to markedly different degrees of alignment. Our strategy can be replicated for other anisotropic nanoparticles to produce well-controlled patterning of these nanoentities on surfaces.
Export citation and abstract BibTeX RIS

Content from this work may be used under the terms of the Creative Commons Attribution 3.0 licence. Any further distribution of this work must maintain attribution to the author(s) and the title of the work, journal citation and DOI.
1. Introduction
Gold nanoparticles have attracted enormous attention recently owing to their interesting optical properties which arise from localized surface plasmon bands [1–9]. For anisotropic nanoparticles such as nanorods (NRs), there are two plasmon resonances due to the plasmon bands along the length and along the width of the NRs, known as longitudinal and transverse plasmon bands, respectively [4]. Additionally, the longitudinal band of gold NRs can be tuned from the visible to the near-infrared region by varying the aspect ratio of the NRs, which makes gold NRs a potential candidate for many applications [4–7]. The orientation of particles with respect to the incident electromagnetic waves also influences the plasmon excitations, and the plasmon bands can be selectively excited by controlling the orientation of the NRs [10, 11]. Moreover, the plasmon bands of gold NRs are also very sensitive to the dielectric environment and interparticle distance [12]. When the NRs are separated by short distances, the plasmon bands are drastically modified owing to the interparticle plasmon coupling. Furthermore, the region between closely packed plasmonic NRs can serve as a hot-spot for surface-enhanced Raman spectroscopy [13, 14]. Therefore, depending upon the type of application, control over the dispersion, alignment, and placement of gold NRs over long distances is of great importance.
When dispersed in solution, colloidal NRs are usually separated from each other under the influence of electrostatic repulsion arising from their charged surface coating [15, 16]. However, during drying from aqueous solution onto a substrate, the capillary and van der Waals forces dominate, leading to agglomeration of the NRs with their long axis aligned parallel to maximize contact [17–19]. Different strategies have been devised to control the assembly of gold NRs on surfaces. Gold NRs have been coated by different molecules to assist ordering into one-, two-, and three-dimensional horizontal and vertical assemblies on surfaces [20–25]. Furthermore, it has been demonstrated that the agglomeration of gold NRs on surfaces can be prevented by modifying their surface with polymers and confining them into a polymer film [12, 26]. The interaction between polymer brushes controls the interparticle spacing and enables a uniform dispersion of gold NRs. It has also been shown that, by using chemically defined patterns on surfaces, alignment of surface-functionalized NRs can be achieved when the width of the striped regions attractive to the NRs becomes smaller than the length of the NRs [24]. However, all these assembly methods require surface functionalization of the NRs in order to modulate their chemical interactions to facilitate the assembly process. Although synthesis of gold NRs by seed-mediated surfactant-assisted methods is very well established [27–32, 9, 33], their surface functionalization can be rather difficult. Additionally, the surface coating may interfere with the targeted properties needed for different applications. Therefore, it is desirable to devise a simple method by which control over the dispersion and assembly of NRs can be achieved without any chemical alteration of the as-prepared gold NRs.
In this paper, we report on the deposition and assembly of gold NRs of two different lengths, prepared by seed-mediated growth, on hydrophilic–hydrophobic stripe-patterned surfaces. Gold NRs selectively assemble in the hydrophilic regions of the substrate. The dispersion, density, and alignment of the NRs on the surface was controlled by their concentration in solution and the hydrophilic stripe width.
2. Materials and methods
2.1. Synthesis of short Au NRs
Short Au NRs were synthesized using the silver-assisted seed-mediated protocol reported by Nikoobakht et al [28]. Briefly, for the preparation of the seeds, 25 μl of gold stock solution (HAuCl4, 0.1 M) was added to 10 ml of 0.1 M cetyltrimethylammonium bromide (CTAB). While stirring, 45 μl of 0.1 M ice cold NaBH4 was added, and stirring continued for 2 min. The solution turned light brown immediately after addition of NaBH4, indicating nanoparticle formation. The seed solution was left undisturbed for 1 h at 25 ° C before usage. The prepared gold seeds have a diameter of about 3 nm and are single crystalline [28].
For the growth solution, 10 ml of 0.1 M CTAB was mixed with 50 μl gold stock solution. After this, 100 μl of 0.01 M AgNO3 was added, followed by 70 μl of 0.1 M ascorbic acid, and the growth solution quickly turned from dark yellow to clear and colorless. To this colorless growth solution, 14 μl of CTAB-capped seeds were added, and the resulting solution was left overnight at 25 ° C. Purification of the rods was done by centrifugation twice at 10 000 rpm for 10 min. The resulting pallets were resuspended in equal volumes of water. The length of the NRs is 35 ± 7 nm and the width 13 ± 3 nm; the aspect ratio amounts to 2.7. The NRs have transverse and longitudinal plasmon peaks at 523 nm and 730 nm, respectively (inset, figure 1(a)).

Figure 1. SEM images of short NRs deposited on hydrophilic–hydrophobic patterned surfaces with hydrophilic stripe widths of 2 μm (a), magnified image of the lighter region (hydrophilic part) of (a) (b), similarly prepared 5 μm wide hydrophilic stripe (c), similarly prepared 20 μm wide hydrophilic stripe width (d), deposition on a homogeneous hydrophilic Si/SiO2 substrate (e), and deposition on hydrophilic–hydrophobic patterned surface with a hydrophilic stripe width of 5 μm and 10 times lower NR density (f). The inset in panel (a) shows a UV–vis spectrum of the aqueous suspension of short Au NRs. The insets in images (c), (d), and (e) are the magnified images of the respective figures, having a magnification similar to the magnification of image (b).
Download figure:
Standard image High-resolution image2.2. Synthesis of long Au NRs
Au NRs of high aspect ratio were prepared by a three-step seeded protocol [33]. Briefly, a seed solution was prepared by adding 50 μl of gold stock solution to 18 ml of water. To this solution 50 μl of freshly prepared sodium citrate (0.1 M) solution was added. Finally, 0.6 ml of freshly prepared sodium bromide solution (0.1 M) was added while stirring. The seed solution was used after 2 h.
For the preparation of growth solution, 125 μl of gold stock solution was added to 55 ml of 0.1 M CTAB solution. To this solution 250 μl of ascorbic acid (0.1 M) was added, and the solution was stirred for a few seconds until it became colorless. Three conical flasks were labeled A, B, and C, and were filled with 5 ml, 5 ml, and 45 ml of growth solution, respectively. From the previously prepared seed solution, 1 ml was added to flask A, and stirred for 10 s. From flask A, 1 ml of solution was added to flask B, and stirred for 15 s. 5 ml of solution from flask B was added to flask C, and stirred for 15 s. The resulting solution was left overnight at 25 ° C. The next day, the upper part of the solution was carefully but completely removed, until only pallets on the bottom of the flask were left. These pallets were redispersed in 15 ml water. Before using this suspension for the deposition of NRs, it was centrifuged twice at 6000 rpm for 10 min to remove excess CTAB, and the precipitates were redispersed in the same volume of water. The NRs have a length of 495 ± 20 nm and a width of 37 ± 8 nm; the actual aspect ratio amounts to 14. The transverse plasmon peak of the NRs lies at 510 nm while the longitudinal plasmon peak lies beyond the range of our spectrometer (inset, figure 5(a)).
2.3. Preparation of patterned substrates
Using clean-room facilities, silicon wafers with a natural oxide layer were coated with a positive photoresist. Optical lithography was used to define 1–20 μm wide stripes, with a separation of 150 μm. Self-assembled monolayers (SAMs) of 1H,1H,2H,2H-perfluorodecyltrichlorosilane (PFDTS) (ABCR, Germany) were formed on the patterned substrate by vapor deposition. Afterwards, the photoresist was washed off by acetone, leaving the hydrophilic and hydrophobic stripe regions consisting of Si/SiO2 and PFDTS monolayers, respectively.
The imaging of samples was done using a Nova NanoSEM 200 scanning electron microscope. The image analysis was done using Image J software.
3. Results and discussion
3.1. Short nanorods
In order to deposit gold NRs on the substrates, a drop of NR suspension was placed on the patterned substrate and left there for 10 min; subsequently, the solvent was drained. Figure 1(a) depicts the scanning electron microscopy (SEM) image of the deposited NRs on a substrate containing 2 μm wide hydrophilic stripes. The bright lines in the image represent the hydrophilic stripes partially coated with gold NRs. Figure 1(b) shows a magnified image of one of these bright lines. It is evident from figure 1(b) that the NRs are homogeneously dispersed in the hydrophilic region. Figures 1(c) and (d) show the deposited gold NRs on substrates with 5 and 50 μm wide hydrophilic stripes, respectively. In all cases the NRs seem to be deposited only on the hydrophilic regions of the substrates. Furthermore, as the width of the hydrophilic stripe is much larger than the length of the NRs, their orientation is completely random, as is evident from the SEM images in figures 1(b)–(d). Figure 1(e) depicts the NRs deposited by drying a drop of NR suspension on an unprepared homogeneous Si/SiO2 substrate. In this case, agglomeration of NRs is clearly visible.
Figures 2(a)–(c) represent histograms of the separation distance distribution of the NRs in the SEM images of figures 1(b)–(d), respectively. The mean distance between NRs for a 2 μm wide strip is 98 nm. Interestingly, when the hydrophilic stripe becomes wider, the mean separation distance between the NRs decreases. For a 5 μm wide stripe, the average inter-rod separation becomes 68 nm, and for 50 μm stripe width it further decreases to 57 nm. The smaller inter-rod separation implies a higher density of NRs on the striped surfaces.
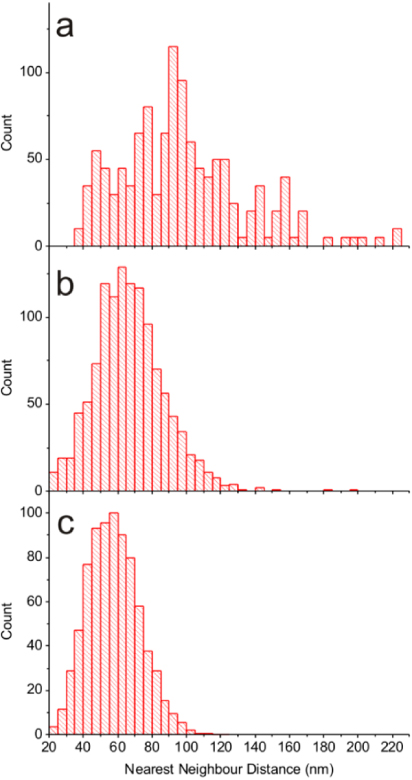
Figure 2. Histograms of the nearest-neighbor distance of short NRs for hydrophilic stripe widths of 2 μm (a), 5 μm (b), and 50 μm (c).
Download figure:
Standard image High-resolution imageThe density of NRs on the surface can also be controlled by controlling their concentration in the deposition droplet. Figure 1(f) depicts an SEM image of NRs deposited on a 5 μm stripe with a starting droplet having 10 times lower concentration of NRs. The density of NRs on the surface is markedly lower as compared to figure 1(c).
In figure 3, a schematic representation of the deposition process is shown. As the mass of short NRs is too small for them to be affected by gravity, they are uniformly distributed over the whole liquid volume. When the drop of suspension containing the NRs is drained from the substrate, the receding of water proceeds much slower from the hydrophilic region as compared to the hydrophobic areas. This leaves a film of water in the hydrophobic region. The NRs contained in this film can only deposit on the hydrophilic surface as the liquid film evaporates, leading to the decoration of gold NRs on the hydrophilic stripes. Furthermore, as the volume-to-surface ratio is larger for the films on wider stripes (assuming similar contact angles), and all NRs contained within the volume of the water film eventually have to deposit on the stripe area, the density of NRs should be higher on wider stripes. This explains the increase in the NR density seen as the stripe gets wider (figures 1(b)–(d)). However, the NR density does not seem to increase further for figure 1(e), where a macroscopic droplet was used on an unprepared Si substrate. This is due to the fact that most of the particles in this case are transported to the edge of the droplet to make the so-called 'coffee-ring'. As a consequence, the middle region of the dried droplet (as shown in figure 1(e)) is left with lower NR density. The coffee-ring effect is absent for faster drying times [34], which is the case for narrow stripes of liquid (this will be discussed later).
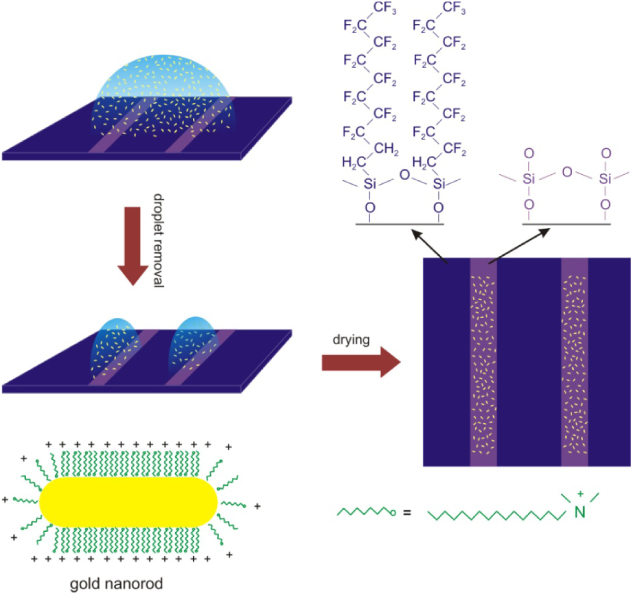
Figure 3. Schematics of the deposition process of short NRs.
Download figure:
Standard image High-resolution imageThe hydrophilic surface is simply the exposed silicon oxide surface, which is generally negatively charged (Si–O−), so one may suspect that the gold NRs, owing to their positive surface charge, are deposited via electrostatic attractions [24]. In order to verify this, a control experiment was done, in which a bare Si/SiO2 substrate was immersed in an NR suspension for 10 min. In this case, the particles can only deposit through electrostatic and van der Waals interactions with the substrate. The resulting SEM images (not shown) revealed a markedly lower density of NRs deposited on the substrate as compared with results of figures 1(b)–(d). This confirms the interpretation that the deposition on the patterned surfaces (figure 1) can be attributed to the deposition of all the NRs contained in the film of water left in the hydrophilic stripes, as illustrated in figure 3.
The capping agent used for Au NR synthesis, CTAB, is not only responsible for the anisotropic growth of gold nanoparticles. The bilayer of these molecules on the surface of the NR also prevents agglomeration of NRs in aqueous solutions, owing to its positive charge resulting in electrostatic repulsion [15, 16]. However, when the NR suspension is dried on a homogeneous substrate, the NRs deposited on the surface are generally found to agglomerate, preferentially side by side, under the influence of capillary forces, whereas the electrostatic repulsions are neutralized by the co-deposition of counter-ions. For rod-shaped particles, the capillary forces can be much stronger than the thermal energy [35]. Therefore, during drying when two rod-shaped particles come into contact with each other at the liquid–air interface, they form quasi-static arrested structures [35, 36], and eventually deposit on the substrate in this configuration when the solvent is completely evaporated, leading to the agglomerated deposition (as is the case for figure 1(e)). However, a finite time (tag) is required for the two particles to reach the liquid–air interface and come into contact under the influence of the capillary forces. This time should be compared to the time for evaporation of the liquid (tev). If tag > tev, the particles will not agglomerate, and vice versa.
For a spherical droplet, tev can be calculated by the method described in [34]. If the other conditions are kept the same, the evaporation time increases proportionally to the square of the droplet diameter. The evaporation times calculated for spherical water droplets of diameters 2, 5, and 50 μm at room temperature and a contact angle of 25° are 6 μs, 32 μs, and 0.032 s, respectively. In our case, the liquid has the shape of stripes instead of spherical droplets, which will modify these estimates. However, as the drying time of a solvent effectively depends on the surface to volume ratio of the solvent, keeping other conditions the same, we expect that the drying time of a stripe of width W is of the same order of magnitude as that of a sphere of diameter W. Therefore, for 2, 5, and 50 μm gaps (figures 1(b)–(d)), the solvent film dries in a timescale of less than a second. Using optical microscopy, we have seen that even on 100 μm wide stripes a liquid film dries within a second.
In order to calculate tag, it is necessary to have a precise model for calculating capillary forces for NRs. Previous studies have shown that for large inter-rod distances precise numerical solutions for parallel rods are possible. However, when the inter-rod spacing becomes smaller than or comparable to their size, the calculations become non-trivial [37–40]. Nonetheless, we believe that the drying time of liquid films on the hydrophilic stripes is too fast for the NRs to reach the air–water interface and agglomerate under the influence of capillary forces.
In addition to capillary forces, entropic interactions can also lead to the formation of aggregates [41]. For higher particle concentrations, excluded volume entropy may overpower the orientation entropy, leading to the side-by-side agglomeration of NRs to minimize the excluded volume [41]. Sufficiently high particle concentrations can lead to a phase transition from an isotropic phase to ordered nematic or smectic phases [42]. Hore et al carried out simulations for non-interacting NRs (assembly in this case will be dictated only by entropic interactions) with similar dimensions and concentration as used by us (figures 1(b)–(d)) [12]. They reported the formation of small random aggregates of NRs. The absence of aggregates in our case is due to the fact that electrostatic repulsions keep the NRs separate in solution just before deposition.
When a droplet of NR suspension was allowed to completely dry (no draining of liquid) on a stripe-patterned surface, highly ordered multilayers of Au NRs were deposited on the hydrophilic stripes, as shown in figure 4. While most of the NRs were taken away with the removal of the droplet in the previous experiments (results shown in figure 1), now all NRs contained in the droplet end up on the substrate and are assembled on the hydrophilic stripes, thereby leading to the formation of multilayered superstructures of densely packed NRs. Owing to the higher concentration and steered by capillary and van der Waals forces, the NRs preferably assemble side by side in this case to maximize the excluded volume entropy. However, this orientational ordering is short ranged; globally, the assembly is isotropic. As seen from the inset of figure 4(b), there is a monolayer of NRs close to the hydrophilic–hydrophobic interface, but it grows into multilayers as we move towards the center of the hydrophilic stripe. Similar multilayer structures were reported for spherical gold nanoparticles by Fustin et al [43].
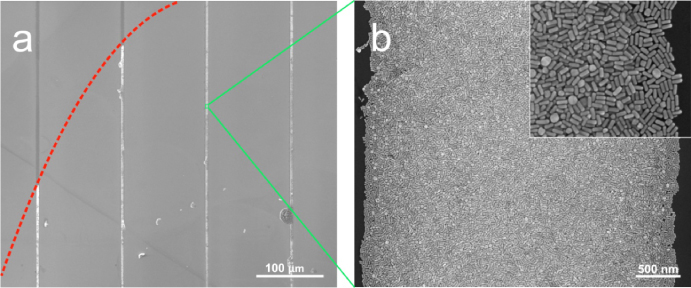
Figure 4. (a) SEM images of short NRs deposited on the hydrophilic–hydrophobic patterned surfaces (hydrophilic stripe widths of 5 μm) after complete drying of a droplet of NR suspension on the surface. The red dotted curve shows the starting point of the three-phase contact line before evaporation of solvent. (b) Magnified image of the green box region of (a). The inset in the figure is a 5 times magnified image of the hydrophobic–hydrophilic interface region.
Download figure:
Standard image High-resolution image3.2. Long nanorods
In order to study the deposition of NRs having lengths comparable to the hydrophilic stripe widths, we carried out the deposition of longer NRs (with a length of approximately 500 nm). Similar to the previous case, the deposition was carried out by placing a droplet of NR suspension on the stripe surface for 10 min. Figure 5(a) shows an SEM image of NRs deposited on the stripe-patterned surface, with 5 μm wide hydrophilic stripes. The stripes are seen as brighter in the images due to the NRs deposited on the hydrophilic regions. Figure 5(b) shows a magnified SEM image of NRs on the 5 μm wide hydrophilic stripe. The NRs close to the edge of the hydrophilic stripe show some alignment along the stripe length but overall the NRs inside the stripe seem to be randomly oriented. When the hydrophilic stripe width was reduced to 2 μm, the alignment of the NRs was markedly better, as is evident from figure 5(c). It is also interesting to note that, in both these cases, the NRs seem to prefer head-to-tail contact. However, when the hydrophilic stripe widths are approximately twice the length of the NRs, we observe side-by-side assembly of gold NRs, as is evident from figure 5(d), where an SEM image is shown of NRs assembled in 1 μm wide hydrophilic stripes. The alignment in this case is significantly better as compared to the case with wider stripes. This high degree of alignment can be seen over a long range, essentially over the entire length of the stripe.

Figure 5. Alignment of long Au NRs on PFDTS patterned Si substrates with hydrophilic stripe widths of 5 μm ((a), (b)), 2 μm (c), 1 μm (d), 2 μm with 5 times lower NR concentration (e), and 2 μm with 5 times higher NR concentration (f). The inset in panel (a) shows the UV–vis spectrum of the aqueous suspension of long NRs.
Download figure:
Standard image High-resolution imageIn order to see the influence of the NR concentration in the droplet, we carried out deposition experiments with lower and higher concentrations. In figure 5(e), an SEM image of NRs deposited on a 2 μm wide hydrophilic stripe is shown, where a 5 times lower concentration of NRs is used as compared to figure 5(c). As is evident from the images, the NRs are again predominantly assembled in a head-to-tail fashion. When a deposition with a 5 times higher NR concentration was done, the NR assembly was very different, as seen in the SEM image in figure 5(f). In this case there is a strong preference for the NRs to align in a side-by-side configuration.
As compared to their smaller counterparts, the assembly of longer NRs on the stripe-patterned surfaces is markedly different. In this case the NRs are more massive and, while the drop is on the surface, the NRs are subjected to gravity and sink to the bottom, leading to a relatively high density close to the surface, as schematically depicted by figure 6. Therefore, in this case, a difference in volume of the water film does not affect the density of NRs deposited on the surface as much as for short NRs, because they are not distributed uniformly over the whole film volume. However, as the NRs are hydrophilic, they will be repelled from the hydrophobic part of the surface. This leads to their migration towards the hydrophilic region, which results in an increase in the density of NRs close to the surface within hydrophilic stripes. The number of NRs driven into the hydrophilic region will depend of the width of the effective hydrophilic–hydrophobic interface. As the interface width is the same for different stripe widths, the increase in the NR density as a result of this migration will be more pronounced for smaller stripe widths. Our image analysis measurements show that, despite the fact that the same initial deposition concentration was used for 5 μm, 2 μm, and 1 μm stripes (figures 5(b)–(d)), the fractional area of the hydrophilic stripe covered by NRs differs markedly, and was determined as 0.29, 0.39, and 0.44, respectively (table 1). We attribute this increase in NR coverage for smaller hydrophilic stripe widths to the migration of NRs from hydrophobic to hydrophilic regions while the suspension droplet is still on the surface. It is important to note that short NRs will also be repelled from the hydrophobic surface, but, as they are not bound to stay close to the surface and can move over the whole droplet because of their smaller mass, the repulsion will not affect their final deposition density on hydrophilic stripes.
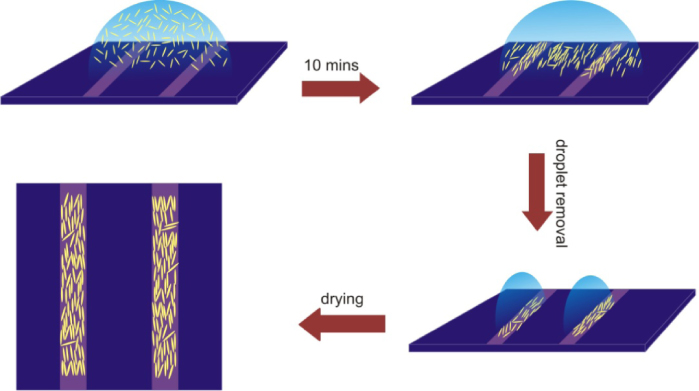
Figure 6. Schematics of the deposition process of long NRs.
Download figure:
Standard image High-resolution image
Table 1. Results of image analysis of images shown in figure 5.
| Corresponding figure | Stripe width (μm) | Fractionalcoverage ofstripe area | Order parameter S |
|---|---|---|---|
| 6(b) | 5 | 0.23 | 0.11 ± 0.06 |
| 6(c) | 2 | 0.39 | 0.53 ± 0.04 |
| 6(d) | 1 | 0.44 | 0.78 ± 0.02 |
| 6(e) | 2 | 0.10 | 0.41 ± 0.05 |
| 6(f) | 2 | >1 | 0.61 ± 0.04 |
A higher density close to the surface will also force long NRs to come into contact with each other in solution. The electrostatic repulsions due to the presence of the CTAB bilayer on the NR surface would tend to induce a head-to-tail arrangement of NRs, as the repulsive force is smaller in this configuration compared to the side-by-side arrangement. Moreover, it is known that the coating of the CTAB bilayer on the NR surface is not isotropic. The density of molecules is larger on the sides of the NR as compared to the tips [45]. This would further favor a head-to-tail arrangement of NRs in solution. This tendency of head-to-tail arrangement will change once the density of NRs is increased due to the fact that, for higher densities of NRs, the excluded volume entropy becomes more important. As mentioned before, for sufficiently large concentrations of NRs, the excluded volume entropy can lead to a nematic phase. Therefore, for higher NR densities (figure 5(f)), NRs assemble in a side-by-side configuration. Furthermore, due to the larger NR and small interparticle spacing (leading to a shorter value of tag), capillary forces can also play a considerable role in bringing the nanorods into a side-by-side configuration during drying.
Close examination of figures 5(b)–(d) reveals that the tendency of the side-by-side arrangement increases as the hydrophilic stripe widths become smaller. This trend may be due to two mechanisms. First, as the NR density is higher for smaller hydrophilic stripe widths, the side-by-side arrangement is more favorable owing to the fact that excluded volume entropy and capillary forces start to dominate. This agrees with a more pronounced side-by-side alignment of NRs (deposited from a concentrated NR solution) in figure 5(f), as compared to the NRs in figures 5(c) and (e), although the hydrophilic stripe width is the same (2 μm) in all cases. Secondly, it is known that confinement also increases the nematic ordering [44]. Due to the confinement of NRs on stripes having widths comparable to the length of the NRs, their rotational degree of freedom is compromised. The NRs close to the hydrophilic–hydrophobic interface region cannot cross over the hydrophobic/hydrophilic boundary, as they are restricted by the surface tension of the solvent; therefore they tend to align along the edge region, leading to alignment along the interface. These aligned NRs will further induce the alignment of neighboring NRs, consequently leading to a preferred side-by-side assembly and an overall net alignment along the stripe length for relatively narrow stripes. This steric alignment effect becomes more pronounced as the width of the stripe becomes smaller.
The alignment of NRs can be quantified by defining an order parameter, S:

where θ is the angle of the long axis of the NRs with respect to the length of the stripe [11]. When all rods are perfectly aligned parallel along the length of the stripe S = 1, and S = 0 when they have a completely random distribution. The orientation of more than 250 NRs was measured to calculate S in each case. Table 1 lists values of the order parameter for different stripe widths, and also the fractional coverage of NRs on the hydrophilic stripes. As expected, the alignment improves considerably as the width of the hydrophilic stripe decreases. For the 10 μm stripe width there is no alignment, and the value of the order parameter amounts to zero. Also for 5 μm wide stripes the overall alignment is poor. However, there is a small degree of alignment at the edge of the hydrophilic stripe, which contributes positively to the order parameter, resulting in an overall value of S larger than zero. As the stripe width decreases to 2 μm, the alignment becomes much better. For a hydrophilic stripe width of 1 μm, we have seen the highest degree of alignment, with values of S as high as 0.78.
The concentration of NRs also influences their alignment. When the fractional coverage of the hydrophilic stripes is decreased from 0.39 to 0.1 for a 2 μm stripe width, S decreases from 0.53 to 0.41. On the other hand, an increase in NR concentration (figure 5(f)) leads to an increase in the order parameter to 0.61 for a 2 μm wide stripe.
Trilett et al carried out two-dimensional Monte Carlo simulations of hard rectangles confined between two walls [44]. They noticed that, when the distance between the walls was comparable to the length of the rectangles, the rectangles aligned their long axis parallel to the walls. The alignment was seen to increase for increasing rod densities and decreasing confinement widths [44]. For rectangles of aspect ratio 13.3 and a fractional coverage of 0.4, they have reported order parameters of 0.84 and 0.75 for the spacing between the confining walls 2 and 5 times larger than the length of the rectangle, respectively. However, as Trilett et al considered a two-dimensional hard-rectangle model, these assemblies only account for the entropic interactions. In our case, energetic interactions (electrostatic interactions, capillary, and van der Waals forces) are also present, which will influence the assembly considerably. Our experimental results are comparable to those of Trilett et al for smaller stripe widths. For a 1 μm stripe width (twice the length of our NRs) and a fractional coverage of 0.44, we have observed an order parameter of 0.78. However, for a 2 μm wide stripe width (4 times the length of the NR) and a fractional coverage of 0.39, the experimental value of S was seen to decrease to 0.55, which is much less than the theoretically calculated value (0.75). This suggests that for more confined systems entropic forces play a considerable role.
4. Conclusion
In summary, we have explored the deposition of Au NRs of two different sizes on hydrophobic–hydrophilic contrast stripe-patterned surfaces. We have seen that in both cases the NRs are selectively deposited on the hydrophilic regions. For short NRs, fast evaporation of liquid from hydrophilic stripes prevents agglomeration of the NRs under the influence of capillary forces, leading to the deposition of NRs with uniform separation. The inter-rod separation can be tuned by tuning the hydrophilic stripe width and the concentration of NRs in the starting solution. For very high particle concentrations, the packing of the NRs becomes tight, and multilayers of NRs were formed on the hydrophilic stripes. For longer NRs, we observed alignment along the hydrophilic stripe length as a consequence of confinement. When the confining width (width of the hydrophilic stripe) decreases, the degree of alignment increases. For lower concentrations of long NRs, we have observed that the deposition is still dictated by electrostatic forces, resulting in a head-to-tail assembly of NRs. However, for larger particle concentrations and smaller hydrophilic stripe widths, side-by-side assembly results, as entropic interactions dominate in this regime. For similar confining widths, these two different modes of assembly lead to different degrees of alignment. Similarly, we expect that the presence of different ligands on the NR surface would lead to different degrees of alignment for similar particle concentrations and stripe widths, owing to the modification of electrostatic interactions. Furthermore, surface modification can also make NRs hydrophobic, and therefore would enable them to selectively deposit on hydrophobic regions. More work is needed to explore these possibilities.
Acknowledgments
This work is part of the Industrial Partnership Programme (IPP) Innovatie Physics for Oil and Gas (iPOG) of the Stichting voor Fundamenteel Onderzoek der Materie (FOM), which is supported financially by Nederlandse Organisatie voor Wetenschappelijk Onderzoek (NWO). The IPP iPOG is co-financed by Stichting Shell Research.