
Abstract
Among the enduring challenges in nanoscience, subsurface characterization of living cells holds major stakes. Developments in nanometrology for soft matter thriving on the sensitivity and high resolution benefits of atomic force microscopy have enabled detection of subsurface structures at the nanoscale. However, measurements in liquid environments remain complex, in particular in the subsurface domain. Here we introduce liquid-mode synthesizing atomic force microscopy (l-MSAFM) to study both the inner structures and the chemically induced intracellular impairments of living cells. Specifically, we visualize the intracellular stress effects of glyphosate on living keratinocytes skin cells. This new approach, l-MSAFM, for nanoscale imaging of living cell in their physiological environment or in presence of a chemical stress agent could resolve the loss of inner structures induced by glyphosate, the main component of a well-known pesticide (RoundUp™). This firsthand ability to monitor the cell's inner response to external stimuli non-destructively and in liquid, has the potential to unveil critical nanoscale mechanisms of life science.
Export citation and abstract BibTeX RIS
1. Introduction
Studying the intricate structures of a cell constitutes a major challenge of non-destructive label-free metrology in physiological medium. As recent reports shed light on the importance of the nanomechanical properties [1–3] of living cells in cancer or drug delivery, there is a rising urge to access the information below the surface [4–6] and resolve the inner features of cells in liquid environment [7–10]. The availability of such a nanometrology tool will likely impact the current understanding of cellular behavior. Characterizing the effects of the cytoskeleton dynamics on the cell elasticity and intra-cellular conformational changes represents a prime example of what liquid-mode synthesizing atomic force microscopy (l-MSAFM) can achieve, with direct applications in medicine. Due to the infancy of l-MSAFM, we use AFM and confocal imaging to get some insight of the mechanisms at play in the cell and establish a connection with the features observed in l-MSAFM.
While in-liquid imaging of biological systems is key to a better understanding of the cellular dynamics, high spatial and time resolution intracellular techniques capable of operating in buffer media for label-free characterization are non-existent [7–10]. Moreover, high resolution of HeLa cells is also achieved with the use of extended nanoneedle tip, which can counteract the hydrodynamic damping due to the liquid during AFM operations [11, 12]. Recent reports highlight the growing interest in such capabilities with the development of environmental scanning electron microscopes [8], nanowire based endoscopy [13], multi-harmonic atomic force microscopy (AFM) [14], scanning electrochemical microscopy [15]. The potential of scanning ion-conductance microscopy [16, 17] has also been illustrated by imaging fibroblasts without any damage of the sample observed. Besides advances in multi-dimensional mechanical characterization, the temporal resolution has recently been increased by High-Speed AFM and draws great interest to explore the dynamic mechanisms of biological systems such as bacteria [18]. Furthermore, multifrequency AFM-based techniques are emerging as a powerful platform for exploring material properties [19–22]. The l-MSAFM presents the unique advantage of overcoming the various problems of diffraction, and thus the loss of resolution in conventional acoustic microscopy, by taking advantage of the nanometer sized tip of the probe allowing measurements of the nanoscale response of the material [20, 22]. Importantly, the flexibility of the AFM also makes it possible to expose the sample to external stimuli [23] and study their effects on subsystems of interest. Here we mechanically excite the cells as required for l-MSAFM imaging and chemically expose the cells to stress (pesticide). Specifically, oxidative-stress on keratinocytes (HaCaT cells) was induced by exposure to glyphosate, a common herbicide and an accepted oxidative stress induction model [24]. Glyphosate is known to impair HaCaT cells by inducing an intracellular oxidative cascade, which diminishes the HaCaT cell integrity. Thus despite the natural resistance of epidermal cells to various external potential physical or chemical threats, glyphosate causes harmful effects to biochemical, morphological and histological properties of the HaCaT cells [25, 26].
l-MSAFM is introduced (figure 1) to non-destructively study the heterogeneities within living cells, specifically the intracellular changes induced by an oxidative-stress in keratinocytes skin cells in their physiological environment. The parameters of glyphosate exposure used (0.5 h exposure at 53 mM glyphosate) correspond to an early oxidative stress configuration for the keratinocytes skin cells [27]. In l-MSAFM, the sample is immersed in liquid as depicted in figure 1. A customized liquid cell was developed in order to host the piezoelectric components at the base of the cantilever and below the sample–substrate interface, while preserving the isolation features of the fluid cell. Liquid imaging implementation constitutes a major challenge in nanoscale metrology, especially in AFM-based techniques [28, 29]. Indeed, the dynamical attributes resulting from the liquid–cantilever interaction modify the frequency content of the tip–sample interaction. With a particular attention given to the design of the acoustic liquid cell, retrofitting additional PZTs, and modifying the probe tilt angle for optimum reflectometry of the probe's position, we have achieved in-liquid high resolution subsurface measurement capability. In l-MSAFM, two mechanical actuators (PZT) were used to generate elastic waves: (1) at the base of the cantilever probe at a frequency  (in the custom fluid cell) and (2) at the base of the sample at a frequency
  . Through this excitation scheme, a multi-harmonic forcing can be measured from the cantilever motion due to the forcing on the probe and at
  on the sample at
  . The liquid interaction increases the damping and spurious resonant modes and a reduced sensitivity. By monitoring the behavior of the acoustic response S(t) (figure 1) with respect to the amplitude and phase of the resulting frequency mixing components, l-MSAFM renders an imaging signal, which is independent of possible spurious signals. As the tip of the probe and the sample enter the contact regime, a difference and sum frequency generation takes place in the tip-sample system as a result of the nonlinear nature of their interaction. This process can be viewed as the mechanical counterpart of the parametric process of sum and difference frequency generation in nonlinear optics. The resulting dynamical signal S(t) is then analyzed by lock-in detection using the newly formed difference frequency mode
  as reference (see figure 1). Following the notation introduced in the case of tip–sample interaction in air [21], we denote each Fourier component of the mechanical oscillations of the coupled probe-sample system with
  . The effect of liquid interactions is bypassed here due to the lock-in amplifier measurements.

Figure 1. Experimental setup of l-MSAFM. Mechanical energy for the probe and the sample actuation are supplied via waveform generators connected to the piezoelectric (PZT) ceramics at the base of the cantilever and below the sample. The nonlinearly interacting tip-sample system is the host to frequency mixing, which can be analyzed via the signal S(t) obtained from the detector (PSD). The l-MSAFM phase maps are formed by lock-in detection referenced at the difference mode frequency  .
.
Download figure:
Standard image High-resolution image2. Experimental
2.1. Electronic apparatus
All measurements in liquid are performed with soft triangular silicon nitride cantilevers (type Olympus OMCL-TR400 PSA2) of spring constant k = 0.02 N m−1, resonant frequency in air of  and apex radius around 20 nm. The cantilever displacements are actuated via piezoelectric ceramics, and monitored by the reflection of a laser into a position sensitive detector (PSD). The sample is also attached to a piezoelectric crystal for mechanical actuation. The piezoelectric crystals used are made of plumbum-zirconate-titanate (PZT, Physik Instrumente).
We used a Multimode AFM equipped with a Nanoscope IIIa controller and a signal access module (Bruker) and a 150 μm scanner optimized for large samples such as large cells. The microscope was used in contact mode for the topography measurements, and l-MSAFM was implemented for the subsurface imaging. The mechanical forcing on the probe and the samples were controlled through two waveform generators (Agilent 33220A) with frequency  for the probe and
  for the sample. The driving frequencies
  and
and  were selected such that
  is in the kilohertz range. Typically, we used driving frequencies
  and
and  in the range 4.0 to 5.0 MHz and amplitude
  and
and  around 4.0 Vpp
. The l-MSAFM phase images result from a lockin detection (SRS 844 Amplifier, Stanford Research) by selecting the reference (at the frequency corresponding to the mixture of the two ultrasonic waves of frequencies fp
and fs
, respectively launched at the base of the AFM probe and at the sample base) with a band-pass filter. For a good signal-to-noise ratio, the time constant of the lock-in amplifier was set between 1 and 10 ms. The scan rate was typically fixed at 0.5 Hz, which is typical in liquid imaging.
around 4.0 Vpp
. The l-MSAFM phase images result from a lockin detection (SRS 844 Amplifier, Stanford Research) by selecting the reference (at the frequency corresponding to the mixture of the two ultrasonic waves of frequencies fp
and fs
, respectively launched at the base of the AFM probe and at the sample base) with a band-pass filter. For a good signal-to-noise ratio, the time constant of the lock-in amplifier was set between 1 and 10 ms. The scan rate was typically fixed at 0.5 Hz, which is typical in liquid imaging.
2.2. Frequency mixing in l-MSAFM
As reported previously for the multi-frequency AFM [21], the partial differential equation of the probe, considered as a mechanical beam, can be expressed in the form:
where u(x,t) represents the transverse displacement of a point P of coordinate x on the cantilever at a given time t, r the density, E the Young's modulus, I the moment of inertia and c the structural damping. The boundary conditions of the system require:

and
where  in the tip-mass, and
  the cantilever length.
In the case of l-MSAFM, the interaction force  is time dependent. Assuming a harmonic dynamics of the sample (at
  ), the tip-sample distance
  becomes modulated in time, and a spatial component of the interaction should be considered
  . By means of analytical calculations, we have previously demonstrated that by imposing a forcing on the probe and a forcing on the sample, the modulation of
  engenders a discontinuous response of the system, which could be observed in the amplitude of the difference mode
  . We consider here the optimized case of the force, corresponding to the volume integrated Lennard–Jones potential.
2.3. Fluid cell for acoustic imaging
The fluid cell was modified to accommodate a piezoelectric transducer. This adaptation included a conventional tilt to ensure an efficient reflection of the laser to the photo-sensor detector. The cantilever is held by a specific spring adjusted to the new length from the front to back sides of the cell.
2.4. Cell culture
The study is focused on the HaCaT cell line. The immortalized human HaCaT cell line [34] was cultured in Dulbecco's modified Eagle's medium (DMEM) supplemented with 10% (v v−1) fetal calf serum (FCS; D Dutscher, Brumath, France) and 80 mg L−1 of gentamicin in a humidified 5% CO2 atmosphere at 37 °C. The keratinocytes were grown to confluence in 75 cm2 culture flasks (D Dutscher, Brumath, France). The medium was removed every 48 h, and cells were sub-cultured every seven days at a ratio of 1:6.
The culture, grown on a glass substrate, was then fixed with paraformaldehyde (2.5%). A saline solution of Dulbecco's phosphate buffered-saline (DPBS) is used. The isotonicity and non-toxicity of this buffer prevents the denaturation of biomolecules and conformational changes during the experiences.
2.5. Cytotoxicity assays
HaCaT cells were seeded at a density of 1 × 10⁴ cells per well in 100 μL FCS-supplemented DMEM on 96 multiwell culture plates (Nunc, D Dutscher) and incubated overnight for adherence. Glass slides (13 mm in diameter), which were previously cleaned, were installed in the wells to allow cells growth. After one day, the medium was removed and cells were incubated in FCS-free medium containing a 53 mM concentration of glyphosate for 0.5 h incubation time in a 37 °C-5% CO2 incubator. Glyphosate with a powder purity superior to 95%, (Sigma-Aldrich, St. Louis, MO, USA) was used in these assays. Under the conditions described (53 mM concentration of glyphosate), the concentration of glyphosate killing 50% of keratinocytes (IC50) value is achieved for 0.5 h incubation time. The IC curves, also called glyphosate-induced cytotoxicity, have been established in previous work. Finally after the exposure periods the reaction medium was removed and replaced by DMEM medium. Fluorescence analyses were executed with a confocal microscope Olympus Fluoview FV 1000. Actin was stained with phalloidin (Sigma-Aldrich). Then, DNA was stained with 25 μg mL−1 4',6'- diamidino-2-phenylindole (DAPI; Sigma-Aldrich).
3. Results and discussion
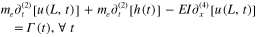
Figures 2 and 3 show a sequence of the resulting l-MSAFM phase maps  obtained on epidermal cells, in their physiological conditions, before and after oxidative treatments. Series of measurements on control cells are presented in figure 2 and illustrate the subsurface capability of l-MSAFM. The large size of the cell (up to 40 μm laterally, and up to 3 μm in height as seen in figures 2(a), (b)), and subsequent displacements of the actuators and the piezoelectric tube occasionally induce the presence of irregular kinks on the phase response of the l-MSAFM image. As the observed disturbances can affect tip–sample interaction, we decreased the size of the scanned area (figure 2(d)), to focus on the area of the cell including the nucleus. For the first time, the images obtained using l-MSAFM reveal details of the cytoskeleton and inner structures of the cell that could not be resolved with the common state of AFM. We focused here on the phase lag signal, which has been linked to mechanical properties in similar technique such as tapping mode and amplitude modulation mode imaging [22]. The phase lag in the AFM tip–sample interaction is a measure of the energy dissipation, which is commonly linked to the samples mechanical properties [30, 31]. In figure 2, we highlight the unique subsurface mapping capability of l-MSAFM in a composite set of phase response representative of eight different frequency component of the tip–sample interaction. The l-MSAFM phase maps presented in figures 2(e)–(l) are associated with the following generated difference frequencies
  : 35 (l), 37 (e), 38 (f), 39 (g), 40 (h), 45 (i), 50 (j) and 55 kHz (k). The nucleus, which was not observable in the topography images figures 2(c), (d), can clearly be observed (circled in light blue) in figures 2(e)–(g), (i), (k), with an exhibited diameter close to 5 μm. Strikingly, the l-MSAFM images expose the presence of filamentous structures, a few of which are indicated by the green arrows in figures 2(e)–(g), (i), (l). Measurements on the filaments indicate a length of 4 μm and width of 0.5 μm and further analysis suggests that the structures could potentially be mitochondria, although only localized chemical analysis could validate such a claim. The entities observed with diameters ranging from 500 nm to 1 μm (red circles in figure 2(i)) present the characteristics of vesicles. While the exact mechanism behind the low signal associated with the observed vesicles may not be directly available from the measured contrast, it may be linked to scattering events as in the 'absorption' of signal by the cavities, analogous to an echo effect. Note that an inversion of contrast occurs between
  = 40 kHz and 45 kHz [32], as can be seen from the inversed scale bars in figures 2(i)–(l), which can be explained by one of the resonances of the cantilever at 40 kHz. Due to the lack of complementary tool for high resolution subsurface imaging of cells in liquid, the interpretation of l-MSAFM images is based on: (1) the morphology of the cell that is available from AFM images, and (2) fluorescence imaging (figures 2(b) and 3(b)) of the same cells, in culture, with special staining to visualize the actin filaments (red) and the nucleus (blue). A more ideal control that would consist of imaging the same cell by AFM and fluorescence on a single platform is not yet possible due to the early stage of developments of l-MSAFM. However, the correlation between the l-MSAFM images and the changes in actin networks can be appreciated in figures 2 and 3.
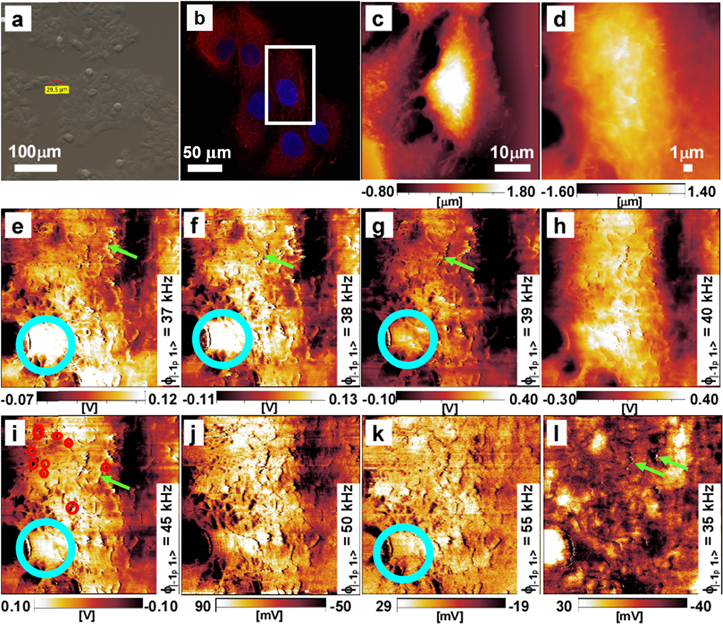
Figure 2. Cytoskeleton images of the control cell in DPBS buffer using l-MSAFM. (a) Optical image, (b) fluorescence image, the white box corresponds to the scan area magnified for l-MSAFM imaging, (c), (d) AFM height images of 50 × 50 μm2 (c) and 20 × 20 μm2 (d) at a rate of 0.5 s/line with a resolution of 512 × 512 pixels2. (e)–(l) First l-MSAFM images of living cells in physiological conditions at  : 37 (e), 38 (f), 39 (g), 40 (h), 45 (i), 50 (j), 55 (k) and 35 (l) kHz. The scale bar in (e)–(l) is the same as in (d). The blue circle indicates the nucleus whereas the green arrows are turned towards mitochondria. The sample forcing remained constant over the course of the study, at frequency
  = 4.500 MHz and amplitude
  = 4.0 Vpp
, while the forcing applied on the probe was varied from
= 4.0 Vpp
, while the forcing applied on the probe was varied from  = 4.445 MHz (k) to
  = 4.465 MHz (l), with a constant amplitude
  = 2.0 Vpp
.
= 2.0 Vpp
.
Download figure:
Standard image High-resolution image
Figure 3. Effect of glyphosate: stressed cell at half maximal inhibitory concentration IC50 on a glass substrate in DPBS buffer. (a) Optical image, (b) fluorescence images. Actin was stained with phalloidin (Sigma-Aldrich) and DNA was stained with 25 μg mL−1 4', 6'- diamidino-2-phenylindole (DAPI; Sigma-Aldrich). (c) and (f) AFM height images of 50 × 50 μm2 at a rate of 0.5 s per line with a resolution of 512 × 512 pixels2. (d), (e), (g), (h) l-MSAFM images of living stressed cells in physiological conditions for  = 39 (d), 37 (e), 38 (g) and 40 kHz (h). The sample forcing varied over the course of the study, from frequency
  = 4.500 MHz (d), (e) to
  = 4.503 MHz (h) with constant amplitude
  = 4.0 Vpp
while the forcing applied on the probe was varied from frequencies
= 4.0 Vpp
while the forcing applied on the probe was varied from frequencies  = 4.461 MHz (d) to
  = 4.463 MHz (e), (f), (h), with a constant amplitude
  = 2.0 Vpp
.
= 2.0 Vpp
.
Download figure:
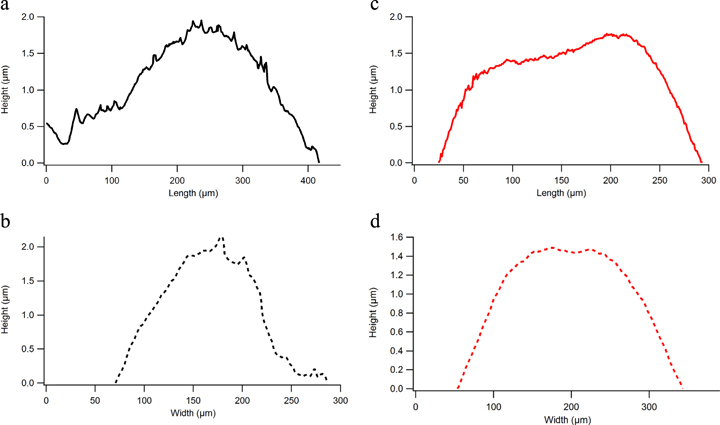
Standard image High-resolution imageThe effect of the pesticide on the HaCaT cell line was later investigated using l-MSAFM, under the same buffer conditions. As seen in figures 3(a)–(c), the oxidative stress caused by the glyphosate is clearly observable from the morphological damages and the inflation of the cells. In fact, from single profile measurements on the control cell (figure 2(c)) and the stressed cell (figure 3(c)), we observed an increase in height from 1.5 μm for the control cell to 2.1 μm for the stressed cell. Interestingly, the lateral dimensions rose from 12.7 × 23.1 μm2 to 19.5 × 22.2 μm2 as a consequence of the stress, causing an approximated two fold global volume expansion, i.e. 462 μm3 for the control cell and 906 μm3 for the stressed cell, which was the trend observed throughout the cell culture. The volume variation was estimated numerically by assuming an ellipsoidal form for both control and stressed cells. The cross sections of a control and treated cell toward of the length and the width are illustrated on the figure 4.
Figure 4. Cellular volume expansion due to the glyphosate. Length and width of a control (a), (b) and a treated cell (c), (d) are reported with their respective cross sections. The increase factor of the cell was calculated using these values.
Download figure:
Standard image High-resolution image
Furthermore, a redistribution of the protrusions on the cell surfaces could also be observed from the AFM topography images shown in figures 2(c) and 3(c). Analyzing a 20 × 20 μm2 area centered at the highest point of each cell (see figures 2(d), 3(d)) reveals that the control cell exhibits greater number of protrusions than the stressed cell, which presents a smoother surface, with a roughness Ra = 501 nm for the control cell and Ra = 429 nm for the treated cell (see figures 2(c), 3(c)). The curves plotted show also the difference of roughness of each cell, less important on the stressed cell (figures 4(c) and (d)), due to the infection corresponding to a volume expansion. These observations of protrusions redistribution correlate well with previous results [23].
After exposing the cells to glyphosate, none of the inner features of the cells resolved in figure 2 could be observed as can be seen in figures 3(d), (e), (g), (h), despite systematic tuning of the frequency  for phase imaging
  . However, the presence of large entities with lower phase suggests that vesicles have grown in size and number (dark areas in figures 3(d), (e), (g), (h)). These observations are in agreement with previous confocal microscopy studies of the same cells, carried out with green tubulin label to track the structure of the cells, which demonstrated a severe alteration of the inner cell conditions [25]. We determined that the mechanical properties of the disorganized structures (red stained actin structures observed in the confocal images in figure 3(b)) differ from the properties of their assembled state (observed in the confocal images in figure 2(b)) as the contrast in the l-MSAFM phase images exhibit very different features. The resulting l-MSAFM images in figure 3 indicate inner damages of the cells, and support the understanding of the modifications of cellular and mitochondrial functions. For low concentrations of glyphosate, as it is the case in this study, oxidative stress inducing an increased production of actin fibers in the filamentous network has already been previously reported [26]. Such observations corroborate our hypothesis of an increased stiffness and cell rigidity, linked to the reorganization of the actin filaments, as a protection mechanism of the HaCaT cells against chemical attacks [33]. As discussed by Heu et al [26], oxidative stress incurred by the exposure to glyphosate triggers some of the cell's defense mechanisms including reorganization of the actin filaments and subsequent increase in stiffness while the volume and morphology of the cell surface undergo important changes.
4. Conclusion
The introduction of subsurface imaging for live cell characterization holds great potential to bridge the gap between nanoscience and single cell analysis. Using the emerging multifrequency nanometrology in fluid l-MSAFM, we resolved for the first time the nanometer size inner structures of live HaCaT cells, in their physiological medium, without the need for staining or labeling. By using the spectral properties of the synthesized difference mode  to acquire series of complementary phase maps, we showed that the l-MSAFM could resolve the cytoskeleton, the nucleus and mitochondrial morphology in live HaCaT. In addition, our quantification of the effect of chemically stimulated stress in terms of volume increase and variation in roughness provided the association with the redistribution of the protrusions on the cell membrane. We demonstrated that glyphosate has a significant impact on the inner structure of the epidermal cells. We envision that this capability will have a broad impact in cellular biology, nanomedecine, toxicology and environmental studies.
Acknowledgments
This work has been supported by the Labex ACTION project. Dr. Laurene Tetard would like to acknowledge partial support from ORNL's. Research performed as a Eugene P Wigner Fellow and staff member at the Oak Ridge National Laboratory, managed by UT-Battelle, LLC, for the US Department of Energy under Contract DE-AC05-00OR22725. Other authors report no other relationships or activities that could appear to have influenced the submitted work.