
Abstract
3D aligned-carbon-nanotubes (ACNTs)@Li2FeSiO4 nanocomposite arrays on Al foil were developed as cathode materials for Li-ion batteries. The ACNTs were grown directly on an Al foil by a chemical vapor deposition method to achieve a 3D current collector structure for direct charge transport. Li2FeSiO4 nanoparticles were deposited on the surface of the ACNTs by a polyvinylalcohol (PVA)-assisted sol–gel method. The 3D samples showed a high degree of alignment of nanotubes with a favorable pore morphology before and after cycling. According to electrochemical measurements, the 3D sample with optimized mass ratio of ACNTs and Li2FeSiO4 (2:1) showed excellent rate capability and capacity retention, delivering a discharge specific capacity of 142 mAh g−1 at a rate of 0.5 C (C = 160 mAg−1) and maintaining 99% of the initial discharge capacity after 50 cycles at 24 ° C. Up to 20 C, the delivered charge/discharge capacity was 94 mAh g−1 after 172 cycles, which is 54% of the value obtained at C/20 (175 mAh g−1). In comparison, carbon coated nanoporous Li2FeSiO4 obtained under analogous conditions by a PVA-assisted sol–gel method can only deliver a capacity of 80 mAh g−1 and showed poor rate capability. In addition, despite amorphization, dissolution and chemical composition changes occurring in the 3D samples upon extended cycling, the 3D samples showed good long-term cycling stability at a high current density (5 C), maintaining ∼80% of the initial discharge capacity after 1000 cycles and ∼70% after 2000 cycles.
Export citation and abstract BibTeX RIS
1. Introduction
Demands for lightweight Li-ion batteries with extended lifetime and high charge/discharge rate capability have increased significantly each year during the past decade. Increasing the specific capacity of the cathode materials is considered as an attractive route to lower the battery weight, volume, and cost. Moreover, improving the rate and cycling capabilities of the cathode materials are necessary to make the battery more powerful and provide longer lifetime. Polyanion materials have attracted a great deal of interest as cathodes for lithium-ion batteries. A silicate material such as Li2MSiO4 (M = Fe,Mn,Co,Ni) would in principle allow reversible extraction of two lithium ions, thus it should deliver higher capacity (333 mAh g−1) compared to commercial cathode materials. These materials also fulfil the need for potentially lower costs, high thermal stability through strong Si–O bonding, increased safety, and environmental friendliness [1], making these materials attractive as cathode materials for lithium-ion batteries. Unfortunately, the Li2FeSiO4 cathode materials reported in literature have shown low rate capability, resulting from low electronic and ionic conductivities [2]. One of the most promising solutions to enhance the charge transfer of Li2FeSiO4 is the introduction of thin carbon coatings onto the surface of the active material [3]. Li2FeSiO4/C composites have therefore recently been prepared in a number of ways [4–6]. In addition, the type and morphology of the carbon coatings, which are connected with the active material, determine the effectiveness of charge transfer in the composites. Aligned-carbon-nanotubes (ACNTs) with high conductivities (>102 S cm−1) have been proven effective to extend their remarkable properties from nanoscale to macroscopic scale [7]. Especially, the ACNTs provide a unique and effective way for realizing improvements of the electrode materials for Li-ion batteries, such as ACNTs@Si [8], and ACNTs@S [9]. After depositing the electrode materials on the surface of the ACNTs, the ACNTs can provide vertical conductive pathways and facilitate fast electron transport and hence also Li-ion transfer. Additionally, during the charge and discharge cycles, structural and morphological changes of the active material can be compensated for by the high mechanical flexibility of the CNTs.
CNT/LiCoPO4 composites with good electrochemical stability have been synthesized by the combination of a templated CVD technique and wet chemical impregnation by a sol–gel based method [10]. However, this method can not give a 3D current collector structure [11] as the composite materials were pressed into the Al mesh before assembling into the coin cell. Huang et al [12] added CNTs to Li2FeSiO4/C by a traditional solid-state reaction method and obtained improved rate performance as cathode materials. However, this kind of physical mixing provided a weak connection between the CNTs and the active material, which prevented the full potential of the CNTs from being exploited. The objective of this work was therefore to develop a new 3D cathode for Li-ion batteries combining the use of ACNTs and Li2FeSiO4 to study their rate capability, stability, and fabrication. This work reports the synthesis of novel 3D ACNTs@Li2FeSiO4 nanocomposite arrays on Al foil (3D ACNTs@Li2FeSiO4/Al), which resulted in enhanced charge transfer and showed excellent rate capability.
2. Experimental details
2.1. Synthesis of 3D ACNTs@Li2FeSiO4 nanocomposite arrays on Al foil
A schematic representation of the synthesis route for the 3D ACNTs@Li2FeSiO4/Al samples is shown in figure 1. Aligned-carbon-nanotubes (ACNTs) were synthesized on a circular Al foil (16 mm in diameter) by means of chemical vapor deposition (CVD) with ferrocene (Avocado, 98%) as the catalyst, as has been reported previously [13]. The mass loadings of ACNTs on the Al foil were controlled by the deposition time. Three different ACNTs/Al samples with ACNT mass loadings of 0.5, 1, and 2 mg were prepared. A Li–Fe–Si–PVA solution (molar ratio Li:Fe:Si:PVA = 2:1:1:1.6,[Fe3+] = 0.26 M) was prepared by a wet chemical method previously described [6], where Li(CH3COO)⋅2H2O (Sigma-Aldrich, reagent grade), Fe(NO3)3⋅9H2O (Sigma-Aldrich, >98%), and tetraethyl orthosilicate (TEOS) (Aldrich, >99%) solutions were used as metal precursors. Polyvinylalcohol (PVA) (Aldrich, Mowiol 10-98, Mw = 61 000) was used as complexing and reducing agents during the carbothermal reaction. The prepared solution (25 μl) was applied drop-wise on the top of the ACNTs on the circular Al foil substrate. This process was followed by aging at 24 ° C for 10 h without covering to obtain a gel-coated composite, and heat-treatment in flowing Ar at 600 ° C for 10 h to obtain the final 3D ACNTs@Li2FeSiO4/Al cathodes. Three different 3D samples (mass ratio ACNTs: Li2FeSiO4 = 0.5:1, 1:1, and 2:1, respectively) were prepared and are listed in table 1. These samples are denoted as ACNTs0.5@LFS1, ACNTs1@LFS1, and ACNTs2@LFS1 for short in the following.

Figure 1. Schematic representation of the synthesis route for 3D ACNTs@Li2FeSiO4 nanocomposite arrays on Al foil. The black tubes are CNTs. The blue dots are Li2FeSiO4 particles.
Download figure:
Standard image High-resolution imageTable 1. Li2FeSiO4-based cathode made with different preparation methods and carbon contents.
| Sample | Sample code | Preparation methods | Carbon contents |
|---|---|---|---|
| 3D ACNTs@Li2FeSiO4/Al | ACNTs0.5@LFS1 | CVD and wet chemical impregnation by the PVA-assisted sol–gel method. | ACNTs 33 wt% |
| ACNTs1@LFS1 | ACNTs 50 wt% | ||
| ACNTs2@LFS1 | ACNTs 66 wt% | ||
| Nanoporous Li2FeSiO4 | Nanoporous | PVA-assisted sol–gel method. | Carbon coating ∼5 wt% Super-P carbon black 10 wt% in the electrode |
2.2. Synthesis of nanoporous Li2FeSiO4/C composite
Nanoporous Li2FeSiO4/C composites were synthesized by the wet chemical method as previously described [6]. A Li–Fe–Si–PVA solution (molar ratio Li:Fe:Si:PVA = 2:1:1:0.8) was prepared by the same method as described above. The as-prepared solution was stirred at 60 ° C and gel formation took place after stirring for 6 h in an uncovered beaker. The gel was then covered and aged at 24 ° C for 10 h before drying at 130 ° C for 3 h. The Li–Fe–Si-containing dry gels were calcined at 450 ° C for 1 h in air. The calcined powder was then mixed with an aqueous corn starch (Sigma-Aldrich, reagent grade) solution and ground into a paste in an agate mortar. The powder mixtures (starch content = 27 wt%) were heat treated in a flowing N2 atmosphere at 650 ° C for 10 h to obtain the nanoporous Li2FeSiO4/C composite which is denoted as nanoporous sample for short in the following.
2.3. Characterization
The 3D sample ACNTs2@LFS1 with optimized mass ratio of ACNTs and Li2FeSiO4 (2:1) and the nanoporous sample were analyzed by x-ray diffraction (XRD) using Cu Kα radiation (Bruker AXS D8 FOCUS diffractometer with a LynxEye PSD). TOPAS R (Bruker AXS) version 2.1 was used for x-ray Rietveld refinements. The specific surface area and pore size distribution were analyzed by nitrogen adsorption measurements (Tristar 3000 Micrometrics). Considering that the surface area of the Al foil can be neglected compared to the ACNTs@Li2FeSiO4 nanocomposites, the 3D sample ACNTs2@LFS1 with Al substrate was rolled up and placed inside the glass tube for the nitrogen adsorption measurement. The mass of ACNTs@Li2FeSiO4 nanocomposites loading on the Al foil was determined by the weight difference between the ACNTs@Li2FeSiO4/Al and the Al. The morphologies of the 3D ACNTs2@LFS1 and nanoporous samples were studied using field emission scanning electron microscopy (FESEM, Hitachi S-4300SE) and transmission electron microscopy (TEM, JEOL 2010F operated at 200 kV). To investigate any changes in the morphology of the samples during cycling, the electrodes were characterized by TEM also after cycling. This was performed by bringing the cathode to a fully discharged state after cycling, followed by disassembling the coin cell, dipping the electrode into a diethyl carbonate (DEC) solution for 10 h to remove any residual electrolyte, and finally drying at room temperature overnight inside an argon-filled glove box. TEM specimens were prepared by embedding the samples in epoxy before cutting thin electron transparent slices with a diamond knife (standard ultra-microtomy TEM sample preparation scheme). The thin slices were further transferred to a holey carbon coated Cu TEM grid. Quantitative chemical composition analysis and elemental mapping were performed with an Oxford instruments energy dispersive spectrometer (EDS) equipped with an X-Max large area (80 mm2) silicon drift detector (SDD). A long acquisition time, typically around 2 h, was used to provide good statistics in the element maps. In addition, drift correction was performed every 30 s during the acquisitions to maintain a high spatial resolution in each of the maps.
The electrochemical performance of the 3D ACNTs@Li2FeSiO4/Al and nanoporous Li2FeSiO4/C samples was assessed using CR2016 coin cells. The 3D sample could be assembled directly into the coin cell, eliminating the need for binder and conducting additives. However, for the nanoporous Li2FeSiO4/C sample, the cathode was prepared by mixing 85 wt% of the nanoporous Li2FeSiO4/C with 10 wt% Super-P carbon black and 5 wt% polyvinylidene fluoride (PVDF) (Kynar, reagent grade). Slurries were made by ball milling, using N-methyl-2-pyrrolidone (NMP) (Sigma-Aldrich, >99%) as the solvent. The electrodes were formed by tape casting the slurry onto Al foil, followed by drying overnight at 90 ° C in a vacuum furnace. A typical cathode loading was 4–5 mg cm−2. Coin cells were assembled with the cathode, lithium metal as the anode and a Celgard 2400 film as the separator. The electrolyte used was 1 M LiPF6 (Aldrich, ≥99.99%) dissolved in ethylene carbonate (EC, Sigma, 99%)/diethyl carbonate (DEC, Aldrich, ≥99%) (3:7 volume ratio). Cell assembly was carried out in an argon-filled glove box, with water and oxygen concentrations of 0.1 ppm. Charge–discharge analysis was performed galvanostatically between 1.5 and 4.6 V versus Li/Li+ with a Desktop Automated Test System (Maccor, Model 4200) at 24 ° C. For the 3D ACNTs@Li2FeSiO4/Al sample, the reported capacities are quoted with respect to the Li2FeSiO4 loading on the ACNTs, which was determined by the weight difference between ACNTs/Al and the 3D ACNTs@Li2FeSiO4/Al, and controlled by the volume of the Li–Fe–Si–PVA solution used for the synthesis. For the nanoporous Li2FeSiO4/C sample, the reported capacities are quoted with respect to the mass of the Li2FeSiO4/C composite, including the carbon and the secondary phases. Long-term cyclic stability of the ACNTs0.5@LFS1, ACNTs1@LFS1, and ACNTs2@LFS1 was evaluated at a charge/discharge current density of C/20 (C = 160 mA g−1) for the first two cycles and 5 C for the following cycles between 1.5 and 4.6 V versus Li/Li+. Over 1000 cycles were performed on these 3D samples.
The electrochemical impedance spectra (EIS) and cyclic voltammetry (CV) of the 3D ACNTs2@LFS1 and nanoporous samples were assessed using a 3-electrode cell (Hohsen Corp.) with metallic Li foil as both reference and counter electrodes. EIS were measured using a multi-channel potentiostat (VMP-3, Princeton Applied Research) in the frequency range of 100 kHz to 10 mHz. The EIS data were simulated by the ZSimpWin software. CV data were collected with VMP-3 at potentials between 1.5 and 4.8 V versus Li+/Li and a scanning rate of 0.1 mV s−1.
3. Results
3.1. Phase and morphology analysis
Figure 2 shows the XRD pattern of the ACNTs@Li2FeSiO4 nanocomposites scraped off the Al foil substrate for the 3D sample ACNTs2@LFS1. The broad peaks are attributed to the nanosized particles. The XRD pattern of the nanoporous Li2FeSiO4/C composite is also included in figure 2, and the Li2FeSiO4 phase could be identified by the space group P21/n [14]. Small amounts of Li2SiO3 and α-LiFeO2−x related secondary phases were observed in the nanoporous sample, but the yield of the Li2FeSiO4 was as high as ∼90 wt% determined by the Rietveld refinement. Comparing the two XRD patterns, the peak positions of the Li2FeSiO4 phase in the 3D sample are corresponding well with the ones for the nanoporous sample. However the unidentified peak appearing at 21° may be due to either a symmetry change of the P21/n structure or an impurity. The additional broad peaks appearing at approximately 26° and 42° correspond to the {0 0 2} and {1 0 0} crystal planes of the ACNTs, respectively [15]. A minor (110) diffraction line from Fe can also be observed in the patterns at 45°.
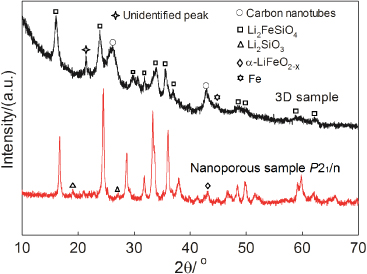
Figure 2. XRD patterns of the ACNTs@Li2FeSiO4 nanocomposites removed from the Al foil substrate for the 3D sample ACNTs2@LFS1, and the nanoporous Li2FeSiO4/C sample.
Download figure:
Standard image High-resolution imageThe morphology of the bare ACNTs on the Al foil before deposition was investigated by FESEM, as shown in figure 3(a). CNT arrays up to 60 mm long with very clear tops could be obtained by the facile CVD method [13]. The top view of the bare ACNTs shown in the inset of figure 3(a) indicates that the distribution of the CNT arrays was uniform. The FESEM image of the 3D sample ACNTs2@LFS1 viewed from the top, shown in figure 3(b), shows a cornfield-like ACNTs@Li2FeSiO4 nanocomposite layer covering the Al foil. The tufted ACNTs bundles could be caused by the capillary forces during drying after deposition of the Li–Fe–Si–PVA solution. A higher magnification FESEM image (figure 3(c)) taken of the cross-section shows the as-prepared ACNTs@Li2FeSiO4 nanocomposite with a thickness of approximately 60 μm. The interface part of the nanocomposite adjacent to the Al substrate was investigated by low angle annular dark field (LAADF) scanning TEM (STEM), as shown in figure 3(d). There is a homogeneous and dense coverage of bright nanoparticles on the CNTs. The inset in figure 3(d) showing a higher magnification image of the nanocomposite that is marked by a square in this same figure, clearly indicates that these nanoparticles have a size of around ∼20 nm and are well dispersed on the CNTs. This is marked by yellow lines in the inset. In order to confirm the chemical composition of the nanoparticles, element maps were acquired by EDS on the area defined by the inset in figure 3(d). Fe, Si, O, Al, and C were detected, and the calculated chemical compositions correspond to the Li2FeSiO4 phase, as shown in table S1 (available at stacks.iop.org/Nano/24/435703/mmedia). The element maps given in figure 3(e) confirm that most of the deposited nanoparticles are Li2FeSiO4. One such particle is marked by a blue circle in the inset of figure 3(d). However, a few iron nanoparticles marked by red circles in the same figure might result from the ferrocene catalyst during the CVD process. A selected area electron diffraction (SAED) pattern of the nanocomposite taken in the upper part of the nanotubes is also included figure 3(e). The two inner diffraction circles correspond to the {0 0 2} and {1 0 0} crystal planes of the ACNTs, which was also observed in the XRD pattern. The diffraction spots appearing in figure 3(e) are mainly attributed to the Li2FeSiO4 phase.

Figure 3. FESEM images of the bare ACNTs on Al foil acquired from a cross-section and a top view (inset) (a) and 3D ACNTs@Li2FeSiO4 nanocomposite arrays on Al foil acquired from a top view at low and high magnification (inset) (b) and a cross-section (c). (d) Low angle annular dark field (LAADF) scanning TEM image taken from the interface part of the nanocomposite adjacent to the Al substrate. (e) SAED pattern and EDS mappings acquired from the area as marked by rectangle in (d).
Download figure:
Standard image High-resolution imageThe LAADF STEM images of the 3D sample ACNTs2@LFS1 after cycling and washing with the DEC solvent are shown in figure 4. After cycling 12 times, the degree of alignment of the nanotubes seemed to be maintained (figure 4(a)). There are no significant morphology changes compared to the uncycled sample (figures 3(b) and (c)), and the main phases were still crystalline, confirmed by SAED. However, large amounts of agglomerates were observed after cycling 50 times (figure 4(b)). The SAED pattern of the nanocomposites (figure 4(c)) only shows the diffraction circles of ACNTs and a few diffraction spots corresponding to bcc Fe, indicating the agglomerates are mainly amorphous. Thus an evolution from crystalline to amorphous phase occurred during cycling. EDS mappings (figure 4(c)) of the area shown in the inset in figure 4(b) show that Fe, Si, O, P, and Al were detected in these agglomerates. Also small amounts of F were present. C is the major element in the EDS spectra. However, since the TEM specimens are resting on an amorphous carbon film, C is omitted from the analysis in order to provide reliable information about the nanoparticles dispersed on the ACNTs. Apart from Fe which appears as crystalline nanoparticles, the elements tended to distribute more homogeneously in the 3D networks for the sample after cycling 50 times and DEC washing compared to the uncycled 3D sample (figure 3(e)). Another interesting observation was that EDS of the sample cycled 50 times after DEC washing showed variations in the Si:O ratio across the cross-section. At the aluminum/cathode interface the Si:O ratio was approximately 1:3 while it was closer to 1:2 at the surface. Hence, the results confirmed that the Li2FeSiO4 phase no longer existed.

Figure 4. LAADF scanning TEM images of the 3D samples ACNTs2@LFS1 after 12 (a) and 50 (b) cycles. (c) SAED pattern and EDS mappings acquired from the area as marked by rectangle in (b). (d) Chemical compositions of the 3D ACNTs@Li2FeSiO4 nanocomposite arrays before and after cycling and DEC washing, as determined by EDS.
Download figure:
Standard image High-resolution imageThe chemical compositions of the 3D samples ACNTs2@LFS1 before and after cycling and DEC washing are provided in figure 4(d) and table S1 (available at stacks.iop.org/Nano/24/435703/mmedia). The selected areas for EDS analysis are taken at different locations from the surface region to the Al/nanocomposite interface region. The decreasing at.% of Fe with cycling was mainly attributed to the fact that the amorphous silicate phase is more likely to release Fe into the DEC solvent during washing compared to the crystalline Li2FeSiO4 phase. The Si:O ratio of the washed samples as well as the at.% of P and F increased after cycling, which are attributed to the products of electrolyte decomposition or active electrode dissolution forming SEI films (e.g. LixPFy, LixPOyFz and LiF) [16] in the 3D cathode. Despite these morphological and chemical composition changes, the 3D ACNTs@Li2FeSiO4 nanocomposites seemed to maintain a favorable pore morphology which allows access of the electrolyte into the network.
FESEM images of the nanoporous Li2FeSiO4/C composites before and after cycling are given in figure 5. The surface morphology underwent severe changes after 50 charge/discharge cycles. The nanoporous morphology can no longer be observed clearly, which may be due to the SEI film forming on the surface of the Li2FeSiO4/C particles.

Figure 5. FESEM images of the nanoporous Li2FeSiO4/C before (a) cycling and after 50 cycles (b).
Download figure:
Standard image High-resolution imageThe BET surface area of the 3D sample ACNTs2@LFS1 and nanoporous sample before cycling were 41 and 20 m2 g−1, respectively. The pore size distribution of the two samples, given in figure 6, shows that the nanoporous sample contains mesopores with uniform pore distribution and pore sizes of ∼20–30 nm, while the 3D sample contains a much larger mesopore volume than the nanoporous sample, allowing easier penetration of electrolyte into the cathode particles.
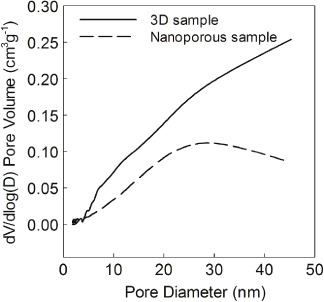
Figure 6. Pore size distributions (PSD) for the 3D sample ACNTs2@LFS1 and nanoporous Li2FeSiO4/C.
Download figure:
Standard image High-resolution image3.2. Electrochemical characterization
Figure 7(a) shows the results of the first and second cycle specific charge/discharge capacities at a current density of C/20 for the 3D ACNTs2@LFS1 and the nanoporous Li2FeSiO4/C samples. The 3D sample can deliver a discharge capacity of 175 mAh g−1 during the first and second cycle, while the nanoporous Li2FeSiO4/C sample can only deliver a discharge capacity of 80 mAh g−1. Figure 7(b) shows the charge/discharge capacity of the 3D sample ACNTs2@LFS1 at various current densities. The cell shows excellent rate capability, delivering a charge/discharge capacity of 91 mAh g−1 at 20 C (3200 mA g−1), which is 52% of the value obtained at C/20. The discharge capacities of the sample with C rates of 0.5, 1, and 5 were 142, 125, and 112 mAh g−1, respectively. Figure 7(c) gives the cycling stabilities of the 3D sample ACNTs2@LFS1 and the nanoporous Li2FeSiO4/C sample at 0.5 C. For the 3D sample, the discharge capacity decreased slightly from 144 mAh g−1 on the first 4–5 cycles, but stabilized after about the fifth cycle and maintained a value of 142 mAh g−1 for the following 45 cycles, which is around 99% of the initial discharge capacity. The nanoporous Li2FeSiO4/C showed an initial discharge capacity of 55 mAh g−1, and suffered from about 8% fading after 50 cycles, which is by far inferior to the 3D sample. Furthermore, after cycling both the 3D sample ACNTs2@LFS1 and the nanoporous Li2FeSiO4/C sample 50 times, the C rate was increased to 1, 5, and 20 C, and cycled 20 times at each C rate, followed by a return to C/20. The results are presented in figure 7(d). The 3D sample presented good cycling stability at each rate. After a total of 112 cycles (2 cycles at C/20, 50 cycles at 0.5 C and 60 cycles at higher C rates), the reversible capacity at C/20 was 155 mAh g−1, which shows a capacity fading of 12% compared to the initial reversible capacity of 175 mAh g−1 at C/20. Upon further cycling at increased C rates, the reversible capacities were still maintained at 123, 112, and 94 mAh g−1 at rates of 1, 5, and 20 C, respectively. The nanoporous Li2FeSiO4/C samples on the other hand, gave much lower reversible capacities (figure 7(d)). Values of 40, 25, and 8 mAh g−1 were measured at cycling rates of 1, 5, and 20 C, respectively. It should be noted that although the capacities were much lower than the 3D sample, they still remained stable for the 20 cycles at each cycling rate. Also, the capacity measured at C/20 after 112 cycles, was close to the initial reversible capacity. Figure 7(e) shows the long-term cycling stabilities of the 3D samples with different mass ratios of ACNTs and Li2FeSiO4 at a high charge/discharge current density (5 C). The 3D sample ACNTs2@LFS1 with the highest ACNTs content (66 wt%) delivered the highest initial discharge capacities at both low current density (C/20) and high current density (5 C). The 3D samples ACNTs1@LFS1 (50 wt% ACNTs) and ACNTs0.5@LFS1 (33 wt% ACNTs) gave much lower initial discharge capacities. Values of 145 and 76 mAh g−1 were measured at cycling rates of C/20 and 5 C for ACNTs1@LFS1. For ACNTs0.5@LFS1, the values are 20 and 6.4 mAh g−1. All the 3D samples suffered from about ∼20% fading after 1000 cycles at 5 C. However, the capacity fading during the next 1000 cycles (from 1000 to 2000 cycles), was less severe. Both of the 3D samples—ACNTs2@LFS1 and ACNTs1@LFS1—showed good stability with very little capacity loss from 1000 to 2000 cycles.

Figure 7. (a) First and second cycle charge/discharge capacity at a current density of C/20 (C = 160 mA g−1) for the 3D ACNTs2@LFS1 and nanoporous Li2FeSiO4/C samples. (b) The rate capability of the 3D sample ACNTs2@LFS1 at current densities of 0.05, 0.5, 1, 5, and 20 C, corresponding to 2nd, 52nd, 72nd, 92nd, and 112th cycles, respectively. (c) Cycling stability for the 3D ACNTs2@LFS1 and nanoporous Li2FeSiO4/C samples at 0.5 C. (d) Rate capability retention of the 3D ACNTs2@LFS1 and nanoporous Li2FeSiO4/C samples measured at different charge/discharge rates (1, 5, and 20 C). (e) Long-term cycling stability of the 3D samples ACNTs2@LFS1, ACNTs1@LFS1, and ACNTs0.5@LFS1 at a current density of C/20 for the first two cycles and 5 C for the following cycles. Only the values of discharge capacities are given in this profile.
Download figure:
Standard image High-resolution imageElectrochemical impedance spectra (EIS) were measured to explore the origin of the improvement in the electrochemical performance of the 3D sample ACNTs2@LFS1 and are presented in figure 8. Nyquist plots of the 3D sample ACNTs2@LFS1 (figure 8(a)) and nanoporous Li2FeSiO4/C sample (figure 8(b)) measured before charging and at fully discharged states at different cycles consist of a small semicircle in the high-frequency region (although not very clear in figure 8(a)), and a large semicircle in the high-to-middle frequency region, which are attributed to the lithium-ion migration through the SEI film and the charge transfer through the electrode/electrolyte interface, respectively [17]. However, some major differences can be observed in figures 8(a) and (b). In addition to the obvious fact that the total impedance of the 3D sample is much lower than the nanoporous sample, there are also large deviations in the low frequency region. The nanoporous Li2FeSiO4/C sample shows a straight line with a 45° angle, corresponding to a semi-infinite Warburg diffusion process in the bulk [18]. The 3D sample ACNTs2@LFS1 on the other hand, shows a line with an angle much larger than 45° and approaches 90° in the lower frequency region, corresponding to a transition region and finite diffusion region [19]. This indicates that Li-ion diffusion was sufficiently fast due to the short diffusion length. The semi-infinite diffusion controlled region was not observed and a capacitive effect was emphasized on the Nyquist plot due to charge saturation [19] of the Li2FeSiO4 nanoparticles or Li–Fe–Si–O amorphous phase.

Figure 8. Nyquist plots of the 3D sample ACNTs2@LFS1 (a) and nanoporous Li2FeSiO4/C sample (b) measured before charging and at fully discharged states at 12th and 50th cycles. (c) Equivalent circuit used to fit the experimental data.
Download figure:
Standard image High-resolution imageBased on the above analysis, simulated electrochemical parameters are shown in tables S2 and S3 in the supplementary materials (available at stacks.iop.org/Nano/24/435703/mmedia) by using the equivalent circuit in figure 8(c). This equivalent circuit proposed by Meyers et al [20] is widely used for simulation of porous electrodes. Here, Re,RSEI, and Rct are resistances of the electrolyte, the SEI film, and the charge transfer reaction, respectively. The capacitance of the SEI film and the double layer are represented by the constant phase elements (CPE) QSEI and Qdl, respectively, due to the 'depressed semicircle' in the impedance spectra [17]. The low frequency region cannot be modeled properly by a finite Warburg element. Therefore, the constant phase element (CPE), i.e., QD was also used to replace the diffusion element. This approach was used to obtain a good agreement between the calculated and the experimental data, as shown in figures 8(a) and (b). The significant change of the Nyquist plots for different samples during the cycling is the values of RSEI and Rct, as listed in table 2. The RSEI and Rct of the 3D sample are much lower than that of the nanoporous Li2FeSiO4/C sample both before and after the same number of cycles. In addition, the RSEI and Rct increased after cycling for both the 3D and the nanoporous Li2FeSiO4/C samples. This increase might be caused by the formation of an SEI film, electrode amorphization and dissolution (Fe loss during cycling) and would consequently result in the observed capacity fading after 50 cycles (figure 7(c)), especially the 113th cycle at low current density (C/20) (figure 7(d)).
Table 2. Simulated results from electrochemical impedance spectra of the 3D sample ACNTs2@LFS1 and the nanoporous Li2FeSiO4 sample.
| Sample | Cycle | Re (Ω) | RSEI (Ω) | Rct (Ω) | j0 (mA cm−2) |
|---|---|---|---|---|---|
| 3D ACNTs@Li2FeSiO4/Al | 0 | 0.97 | 0.87 | 2.41 | 5.32 × 10⁻⁴ |
| 12th | 1.27 | 2.16 | 6.18 | 2.07 × 10⁻⁴ | |
| 50th | 0.67 | 2.61 | 11.24 | 1.14 × 10⁻⁴ | |
| Nanoporous Li2FeSiO4 | 0 | 3.13 | 15.17 | 59.24 | 2.16 × 10⁻⁵ |
| 12th | 2.26 | 18.6 | 81.88 | 1.57 × 10⁻⁵ | |
| 50th | 1.18 | 31.4 | 152.6 | 8.40 × 10⁻⁶ |
The values of the exchange current density (j0) are calculated using equation (1) [21]:

where R is the ideal gas constant, T is the temperature (297.5 K), F is the Faraday constant, A is the area of the electrode surface (2 cm2) and n is the number of electrons transferred per ion during the intercalation, which is 1 for Li+. The exchange current density is a parameter that can be used to indicate the reversibility of the electrode. The higher value of j0 observed for the 3D sample implies better reversibility compared to the nanoporous sample. The above results are also consistent with the cyclic voltammetry analysis presented in figures 9(a) and (b) for the 3D sample ACNTs2@LFS1 and the nanoporous Li2FeSiO4/C sample. In the initial anodic process, oxidation peaks around 3.1 V versus Li+/Li are evident in both samples, which can be attributed to the oxidation of Fe2+ to Fe3+ [1]. After cycling, the Fe2+/Fe3+ redox potential dropped about 0.3 V, which was mainly due to the P21/n polymorph of Li2FeSiO4 transforming into the more stable inverse βII (Pmn21) polymorph during initial charging [22]. After the phase transformation, the Pmn21 phase was reversibly charged and discharged without further phase transformations. For the 12th cycle, the peak profile of the 3D sample was more symmetric and sharp, indicating a smaller conductivity restriction than that of the nanoporous sample. The redox potential separation of the 3D sample was 0.31 V, which is lower than that of the nanoporous sample (0.47 V). For the 50th cycle, the redox potential separation of the 3D sample remained low and the peak profile was still sharp. Additional oxidation and reduction peaks appearing around 3.2 V versus Li+/Li indicate the charge/discharge mechanism changed from the first few cycles. However, the redox potential separation of the nanoporous sample increased upon cycling and the peak profile became broader than the nanoporous sample after 12 cycles. The low redox potential separation for the 3D sample implies enhanced electrode reversibility and weaker polarization compared to the nanoporous sample. In addition to the oxidation peak at ∼3.1 V, another peak around ∼4.8 V is also present in the CV profile, especially for the 3D sample. This peak could be attributed to the Fe3+/Fe4+ redox couple, which forms in the voltage of 4.1–4.8 V [23]. Thus, more than one Li+ (e.g., 1.05 mol per formula unit) could be extracted out of/inserted into the Li2FeSiO4 lattice at a rate of C/20 (figure 7(a)). It should be noted that the CV peak profiles at high voltage (>4.5 V) may also be attributed to the decomposition of bulk electrolyte components [24]. Further work is needed to verify this.

Figure 9. Cyclic voltammetry profiles of the 3D sample ACNTs2@LFS1 (a) and nanoporous Li2FeSiO4/C sample (b) for 1st, 2nd, 12th and 50th cycles at 0.1 mV s−1 and 1.5–4.8 V versus Li+/Li.
Download figure:
Standard image High-resolution image
4. Discussion
The 3D ACNTs@Li2FeSiO4/Al cathodes eliminating the need for organic binders and toxic solvents provide a high degree of alignment of nanotubes with vertical conductive pathways. The unique 3D networks offer efficient electrical connectivity and sufficient access of the electrolyte to the Li2FeSiO4 nanoparticles. Hence, the high initial and second charge/discharge capacities of the 3D sample at low current density was attributed to a combination of high surface area and efficient charge transfer. The results of EIS and CV confirmed that the kinetics of Li+ and electron transfer into the electrodes were much faster for the 3D sample, the Li+ diffusion length was shorter, and the polarization was weaker compared to the nanoporous sample, indicating a stronger charge transfer reaction in the 3D sample. These results coincide well with the comparison of rate capabilities as shown in figure 7(d). In order to take the full advantage of the ACNTs, the mass ratio of the ACNTs should be sufficiently high to allow attachment of all the Li2FeSiO4 nanoparticles to the CNTs. In this work, the 3D sample with 66 wt% ACNTs delivered the best electrochemical performance based on the mass loadings of Li2FeSiO4 nanoparticles.
It should be noted that the charge/discharge mechanisms for the first few cycles are different from those occurring upon extended cycling. From the TEM, diffraction and EDS results it has been shown that the material transforms from a crystalline to an amorphous phase and the chemical composition changes as well. While the material is still in its crystalline form the charge/discharge mechanism is that of a phase transformation of Li2FeSiO4 [22]. As the material turns amorphous, the Li is intercalated and de-intercalated in the amorphous structure which is also of a different composition compared to the initial material [25]. In the latter process, the ACNTs served as the electronic conductor, while the amorphous LixSiOy which is a good Li-ion conductor [26] served as a Li-ion host, and the amorphous phase containing Fe2+/Fe3+ was the redox couple host [27, 28]. Thus the excellent rate capability of the 3D sample at these extremely high cycling rates is most likely attributed to the fast charge transfer facilitated by the carbon nanotubes and the amorphous nanostructure of the cathode material. The amorphous nanostructure of the Li–Fe–Si–O cathode material may also bring additional benefits by reducing the stress/strain of the electrochemical reaction, thus lowering the lithiation/de-lithiation over-potential. This is similar to what has been observed in other amorphous cathode systems, e.g. single-walled carbon nanotubes@amorphous FePO4 [29] and amorphous MnOx–C nanocomposites [30]. Upon extended cycling, the amorphous structure distributed more homogeneously on the ACNTs, and the 3D network maintained the favorable pore morphology which allows access of the electrolyte into the network. Thus the 3D sample show good long-term cycling stability even at the high current density of 5 C (figure 7(e)).
5. Conclusion
3D ACNTs@Li2FeSiO4 nanocomposite arrays on Al foil were synthesized by the combination of a facile CVD technique and a wet chemical impregnation by a PVA-assisted sol–gel based method. Electrochemical measurements on the obtained composites revealed a significant enhancement of the electrochemical performance of the 3D cathode with optimized mass ratio of ACNTs (66 wt%) compared to the nanoporous Li2FeSiO4/C that was obtained under analogous conditions by a PVA-assisted sol–gel method. Upon extended cycling agglomerates formed between the CNTs for the 3D electrode, the chemical composition changed, and crystalline Li2FeSiO4 turned into an amorphous phase. Despite these changes, the electrode still maintained a favorable pore morphology, providing easy access of the electrolyte to the 3D interconnected network. Also, the change in chemical composition and crystal structure (from crystalline to amorphous) did not seem to harm the electrochemical performance to a large extent at high current density. The resulting electrode showed high charge/discharge capacity, excellent rate capability retention, and good long-term cycling stability. This improvement was attributed to the high surface area 3D network combined with high electronic conductivity provided by the carbon nanotubes, which facilitated fast charge transfer, enhanced electrode reversibility and weakened electrode polarization. At the highest cycling rate, up to 20 C, the measured charge/discharge capacity of the 3D sample after 172 cycles was still 94 mAh g−1, which was 54% of the value obtained at C/20 (175 mAh g−1). All the 3D samples suffered from about ∼20% fading after 1000 cycles at 5 C.