
Abstract
A novel displacement reaction has been observed to occur between conducting polymers (CP) and metal salts which can be used to fabricate nanostructured CP–metal composites in a one-pot manner. Vanadium pentoxide (V 2O5) nanofiber is used during the synthesis as the reactive seeds to induce the nanofibril CP–metal network formation. The CP–metal nanocomposites exhibit excellent sensory properties for hydrogen peroxide (H2O2) detection, where both high sensitivity and a low detection limit can be obtained. The sensory performance of the CP–metal composite can be further enhanced by a facile microwave treatment. It is believed that the CP–metal nanofibril network can be converted to a carbon–metal network by a microwave-induced carbonization process and result in the sensory enhancement.
Export citation and abstract BibTeX RIS
1. Introduction
A novel displacement reaction between conducting polymers (CPs) and transition metal salts has been reported in this paper. A facile, simple reaction process is presented for the fabrication of the CP–metal nanocomposite and the reaction mechanism is well understood. This method could serve as a universal approach to generate CP–metal nanocomposites in a one-pot manner. The novel metal displacement reaction generally takes place between the so-called 'synthetic metal', i.e. the conducting polymer polypyrrole (PPy), and the transition metals including silver (Ag) and copper (Cu). The silver and copper metal salts are believed to possess a sufficiently high oxidation potential as Ag and Cu nanoparticles could be generated by their redox reaction with pyrrole [1], where the term 'displacement reaction' is extensively applied. Besides the metal nanoparticles, a nanofibril network of PPy could be generated simultaneously in the process, by the use of vanadium pentoxide (V 2O5) reactive seeds. In our previous study, we demonstrated that V 2O5 is an excellent seeding template to generate CP nanofibril networks [2–4]. However, in the present reaction, V2O5 not only serves as the seeds to catalyze the nanofibril PPy network formation; but also as an auxiliary oxidant contributing to the reaction kinetics. Novel PPy–metal nanocomposites with high-loading metal particles dispersed on nanofibril PPy networks could be readily fabricated in a high-yield, and in a one-pot manner by this reaction process. The nanocomposites show excellent electrochemical catalytic properties and efficient electrode kinetics, which would be of high interest in catalyst, sensor, and nano-electronic applications. Interestingly, the performance of the PPy–metal nanocomposites could be further enhanced by a microwave-induced carbonization process, which we believe would open a new scope for the versatile nano-engineering and modification.
Driven by the continuous revolutions in nanoscale science and technology, nanostructured conducting polymers (CPs) have emerged as promising candidates for the building blocks of next generation nano-electronics and devices. Great efforts and attention have been paid to the manipulation and construction of nanostructured CPs in all dimensions, apparently from 0D to 3D: nanospheres (0D) [5], nanofibers (1D) [3], nanoclips (2D) [6], and rambutan-like spheres (3D) [7]. The versatile toolkits of nanostructured CPs can be considered as advanced building blocks for dimensionally controlled sophisticated hybrid systems. Furthermore, the conductivity of CPs could be tuned by a doping/dedoping process from the semiconductor to the metallic range. Moreover, it will also provide a solid possibility to fabricate highly efficient photonic devices (e.g. solar cells) with controlled properties from the nanostructured CPs by a bandgap tuning process. Nanofibrous PPy has received extensive attention due to its unique properties such as ease of preparation, mechanical stability and benign nature. Nanofibril PPy is also evidenced to possess excellent electronic properties, i.e. a high capacitance and charge transport ability, making it an ideal substrate for chemical modification and composite manufacturing. Continuous endeavors have also been devoted to PPy–Ag and –Cu nanocomposites due to their distinct application potential in chemical sensing [8], surface enhanced Raman scattering [9], and catalysis [10].
In the present study, an advanced PPy nanofibril network with a high-loading of Cu and Ag particles dispersed along its branches is facilely fabricated. These novel network nanocomposites, however, are proved to possess unique charge transfer and electrocatalytic properties, possibly due to the enhanced interfacial interaction between the PPy network and the loaded metallic particles.
2. Experimental details
2.1. Synthesis of PPy–metal nanocomposites
In a typical experiment, 1 ml V 2O5 sol–gel was prepared and slowly introduced into a 50 ml (0.005 M; 0.1 M; 0.2 M) aqueous solution of AgNO3 or CuCl2, under vigorous magnetic stirring. After 10 min, 0.1 ml of pyrrole monomer was then added to the reaction. The color of the solution gradually darkened, indicating the formation of PPy. The mixture solution was then left for another 24 h under constant stirring to complete the polymerization and redox process. Afterwards, the as-obtained black precipitates were suction filtered and washed with copious amounts of DI water (3 ml × 100 ml) and acetone (3 ml × 100 ml). The product was then dried in a dynamic oven for 12 h. The yield of the nanocomposites powder was ∼35–90 mg depending on the initial metal salt concentrations.
2.2. Fabrication of PPy–Ag and C–Ag modified graphite electrode
The PPy–Ag modified graphite electrode (PPy–Ag/G) and C–Ag modified graphite electrode (C–Ag/G) were fabricated as follows. A graphite electrode (pencil) was carefully polished with a razor blade, rinsed with de-ionized water and ethanol, and then dried at ambient conditions before use. A thin layer of graphite paste coating was applied to the surface of the electrode using brushes. Afterwards, 0.1 mg PPy–Ag or C–Ag was weighed and attached to the electrode through the graphite paste coating. The modified electrode was then allowed to dry under ambient conditions for 15 min prior to use.
2.3. Open circuit potential monitoring of the synthesis process
Arbins' Instrument BT 2000 testing system was utilized to perform the open circuit potential measurement. The open circuit potential change (OCP) of the whole reaction process is monitored by immersing a three electrode cell into the reaction solution. A platinum foil was used as the working electrode while a platinum wire was used as the counter and Ag/AgCl as the reference. The open circuit condition was applied to the electrode cell where no current was passed through the cell and the potential difference between the working and reference electrode was monitored continuously. The three electrode cell was immersed into the reaction solution at the very beginning and 20 min stabilization time was allowed between the immersing of the cell and the addition of reactants. A standard synthesis process was performed on the reaction solution and its OCP was monitored simultaneously as a function of time.
2.4. Cyclic voltammetry measurement of PPy–Ag/G and C–Ag/G electrodes
The cyclic voltammetry (CV) measurement was performed on the BT 2000 testing system (Arbins' Instrument). A conventional three electrode cell was constructed to conduct the CV measurement. A PPy–Ag/G or C–Ag/G electrode was used as the working electrode, while a platinum wire was used as the counter and Ag/AgCl as the reference. The CV measurement was performed in 10 mM phosphate buffer solution (PBS) with a cyclic range from − 0.8 to 0.2 V and a scan rate of 20 mV s−1. PBS solution without and with H2O2 at various concentrations (0–3.0 mM) was subjected to the CV measurement, and the corresponding electrode responses were recorded subsequently.
2.5. Amperometric measurement of PPy–Ag/G and C–Ag/G electrodes
The BT 2000 testing system connected to a conventional three electrode cell was utilized to perform the amperometric measurement. A PPy–Ag/G or C–Ag/G electrode was used as the working electrode while a platinum wire was used as the counter and Ag/AgCl as the reference. The cell voltage was kept at − 0.45 V and 20 min stabilization time was allowed at the beginning of each amperometric measurement. The measurements were performed in 10 mM PBS solution under constant stirring and H2O2 with different concentrations was successively injected into the testing solution at an increment of 0.1 mM (0.1–1.6 mM). The electrode response was taken as the difference between the steady state and background current.
2.6. Microwave carbonization of the PPy–Ag and –Cu nanocomposites
For the carbonization process, 5 mg of PPy–Ag or –Cu nanocomposites was weighed and transferred into a 20 ml scintillation vial. The glass vial was then put into a Panasonic Inverter microwave and irradiated for 5 min at 1250 W. Sparks and flashes could be observed on the PPy–metal nanocomposites during the microwaving process, indicating the loss of backbone nitrogen atoms and nanocarbon formation [11].
2.7. Thermogravimetric analysis (TGA) of the PPy–Ag and –Cu nanocomposites
The TGA tests were conducted on a TA Q-500 thermo analyzer. In a typical experiment, 5 mg of the PPy–metal nanocomposite was weighed and placed in a platinum pan for the TGA test. The TGA tests were conducted between 25 and 800 °C under a 60 ml s−1 compressed air flow.
3. Results and discussion
Figure 1 shows the SEM and TEM images of the as-synthesized PPy–Ag and –Cu nanocomposite. Large, continuous plate-like Ag structures could be observed for the PPy–Ag composites (figure 1(A)). The Ag plates are visually flat on the surface, and their growth is also integrated with the PPy nanofiber networks, where a layered composite structure is formed. In this case, the continuous Ag plates typically exceed the several microns range and the nanofiber diameter of PPy is around 55 nm. From the corresponding TEM image of the Ag plate (figure 1(B)) it is observed that small Ag nanoparticles are coalesced and merged into large plate-like structures; and still many small particles exist in close proximity to the plate surface. The selected area electron diffraction (SAED) pattern of the silver plate (figure 1(B): inset) indicates the face-centered cubic (fcc) crystalline structure and the corresponding facets are also indexed. Differing from PPy–Ag, smaller Cu nanoparticles sized around 600 nm are found in the PPy–Cu nanocomposite. The Cu particles decorate the PPy nanofiber network and the fiber diameter of PPy is typically around 50 nm.
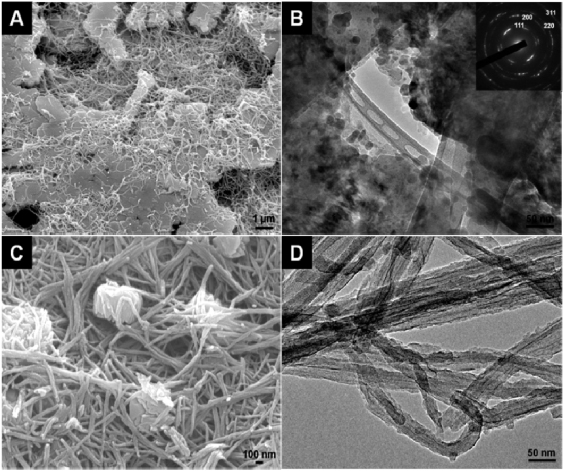
Figure 1. (A), (C) SEM images of PPy–Ag and –Cu nanocomposites synthesized under a 0.02 M metal salt concentration. (B), (D) TEM images of the corresponding PPy–Ag and –Cu nanocomposites. The inset shows the SAED pattern of the silver particles.
Download figure:
Standard imageThe morphologies of the PPy–Ag nanocomposite could be well controlled by the initial concentration of silver nitrate. SEM images of the PPy–Ag nanocomposites prepared with different initial silver nitrate concentrations are shown in figure 2 (0.005–0.10 M, from left to right). The nanofibril PPy network, as well as the Ag particles decorating within, can be well observed in the SEM images. The silver particles are large, typically in the micron size region, and composed of pure silver, as indicated by the EDX spectrum, accordingly. Plate-like silver particles are observed in the composites with a low silver nitrate concentration (0.005–0.01 M), and their size distribution is typically from 1 to 5 μm. However, the size of the silver portion in the composite increases significantly with increasing silver nitrate concentration, as indicated in figures 2(C)–(E). Large, flat, and continuous Ag plates are formed as a result of the high silver salt concentrations and PPy nanofiber networks are covering or beneath these large Ag plates. At this stage, very few Ag particles could be observed in the PPy network as the structure of the composite is layered and separated. The growth of the Ag plates is enhanced with increasing silver nitrate concentration; branches are developed as a result of the high Ag concentration (figure 2(D)). Nonetheless, at 0.1 M silver nitrate, silver particles exceeding 0.1 cm are formed (figure 2(E)), indicating the isotropic crystal growth of silver and a poor confinement effect between the silver particles and the PPy network. Besides the silver particle size, the diameters of the PPy nanofiber are also increased in higher silver nitrate concentrations. As can be seen from figures 2(F) to (J), the nanofiber diameters are 30, 50, 55, 65, and 110 nm, respectively, where a clear trend of increment can be concluded.

Figure 2. (A)–(E) SEM images of the PPy–Ag nanocomposite synthesized with various initial silver nitrate concentrations. From left to right: 0.005, 0.01, 0.02, 0.05 and 0.10 M. The insets show the EDX spectrum of the circled-red area; the gold peak is due to the sputter coating. (F)–(J) Corresponding magnified SEM images of the PPy–Ag nanocomposites shown in the upper row. The column plots indicate the size distribution of silver particles in the nanocomposite, respectively.
Download figure:
Standard imageThe initial concentration of silver nitrate also determines the loading amount of Ag particles within the nanocomposites. TGA is used to analyze the loading of Ag particles for different PPy–Ag nanocomposites as: (i) PPy nanofibers can be completely removed upon TGA treatment under air flow (figure 3: inset); (ii) silver oxide can be completely decomposed into Ag and O at a temperature exceeding 400 °C [12]. It can be observed from figure 3 that both in the lower (0.005–0.01 M) and higher (0.02–0.1 M) silver nitrate concentration range, the loading amount of silver is proportional to concentration. However, in general the loading in low silver concentrations is higher than that in high concentrations, indicating a high silver content and low polymer content for the composite. However, as the silver nitrate concentration increases, the polymerization degree of pyrrole is also increased as a result of the higher solution oxidation power. Therefore, the polymer content in the composite would increase significantly compared to the silver content, as the reduction power of the system remains the same. Different from the behavior of silver loading, the yield of the synthesis reaction increases nearly proportionally to the silver nitrate concentration, indicating a higher reaction efficiency is achieved at high silver concentrations. A schematic illustration showing the relationship among silver concentration, reaction yield, and silver particle loading is shown in figure 4.
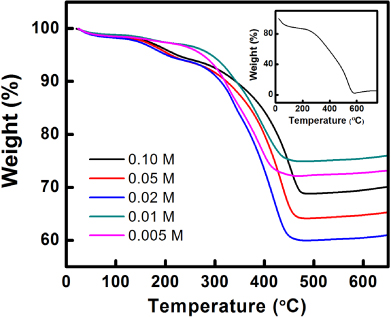
Figure 3. TGA graphs of PPy–Ag nanocomposites with different silver nitrate concentrations. Inset: TGA graph of pure PPy nanofiber.
Download figure:
Standard image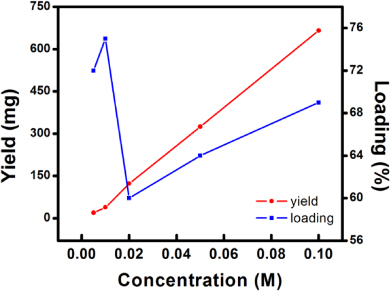
Figure 4. Schematic illustration of the relationship between the silver nitrate concentration, silver loading, and reaction yield.
Download figure:
Standard imageSimilar to the case of PPy–Ag, the initial concentration of CuCl2 also has a great impact on the morphologies of the PPy–Cu nanocomposites. It can be clearly observed that the size as well as the quantity of Cu particles both increase with increasing CuCl2 added during the reaction (figures 5(A)–(E)). In the low CuCl2 concentration range (0.005–0.01 M), the Cu particle size distribution is typically between 20 and 100 nm (figures 2(F) and (G)). Subtle Cu nanoparticles decorated the PPy nanofiber network, indicating an insufficient redox reaction between Cu2+ and Py, as compared to the case of PPy–Ag. However, in the high concentration range (0.02–0.1 M), substantial Cu particle growth and coalescence could be observed (figures 5(C)–(E)). At this stage, a broad distribution is obtained for the loaded Cu particles, typically from 300 nm to 1.5 μm. The diameter of the PPy nanofiber is also controlled by the CuCl2 concentration. With increasing CuCl2 concentration (0.005–0.1 M, figures 5(F)–(J)), the average diameter of the PPy fiber is calculated to be 33, 38, 45, 50, and 67 nm, respectively; which indicates a clear increasing trend. It is worth noting that both the PPy fiber and metal particle sizes are much smaller for PPy–Cu compared to PPy–Ag. This phenomenon could be attributed to the higher oxidation potential of Ag+; thus, the Py–Ag+ redox pair is more thermodynamically favorable and faster kinetics/higher conversion could also be achieved. Besides the Cu peaks, peaks ascended from V2O5 are observed in the EDX spectrum while only Ag peaks are observed for the PPy–Ag. However, it is thus evidenced that CuCl2 is not sufficient to oxidize Py in the low concentration range (0.005–0.01 M), and at this time V2O5 is the major oxidant. As a result, the yield of the reaction is very low and the V2O5 content is high. However, in the case of high CuCl2 concentration, excess Cu2+ would have a much higher oxidation power to induce pyrrole polymerization and the content of V2O5 in the composite is also decreased extensively (figures 5(C)–(E): inset).
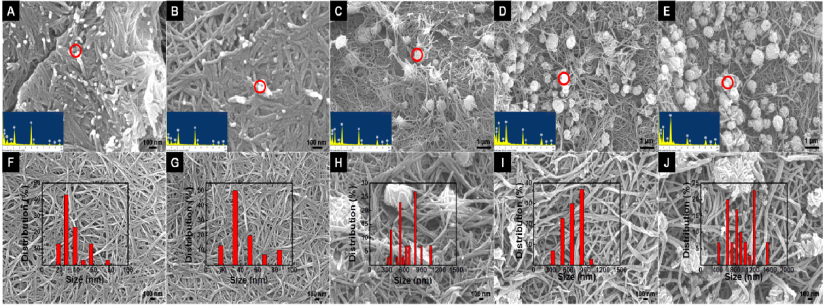
Figure 5. (A)–(E) SEM images of the PPy–Cu nanocomposite synthesized with various initial CuCl2 concentrations. From left to right: 0.005, 0.01, 0.02, 0.05 and 0.10 M. The insets show the EDX spectrum of the circled-red area; the gold peak is due to the sputter coating. (F)–(J) Corresponding magnified SEM images of the PPy–Cu nanocomposites shown in the upper row. The column plots indicate the size distribution of the Cu particles in the nanocomposite, respectively.
Download figure:
Standard imageThe loading amount of Cu particles within the PPy–Cu nanocomposites is determined by TGA. Oxidation of Cu in the air flow could be observed over 475 °C, as shown in figure 6. According to the TGA of PPy–Ag, the PPy content in the composite is burned off at a temperature around 475 °C, as indicated by the plateaus of the TGA graphs. Thus, the weights at 475 °C are used to determine the Cu loading of the PPy–Cu nanocomposites (figure 6: inset). Different from the case of PPy–Ag, the Cu particle loading of PPy–Cu composites decreases with increasing CuCl2 concentration. This phenomenon thus indicates an increasing PPy content in the composite rather than the Cu content. Thus, even in high CuCl2 concentrations, the conversion of Cu2+ to Cu particles is still stagnant, while the conversion of Py to PPy is becoming much stronger. It is interesting to note that the PPy–Cu nanocomposite synthesized from the low CuCl2 concentration has more weight-gain at higher temperatures. However, the particle size of Cu may play a key role during this stage; as the Cu particle size is much smaller in the low CuCl2 concentration, the higher surface area of the nanoparticles would enable ample oxidation over the particles. On the other hand, the yield of PPy–Cu nanocomposite is proportional to the initial concentration of CuCl2, which is analogous to the PPy–Ag composites. A schematic illustration showing the relationship among the CuCl2 concentration, reaction yield, and Cu particle loading is shown in figure 7.
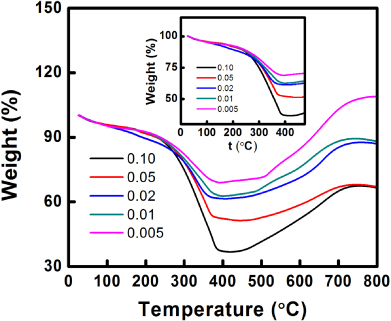
Figure 6. TGA graphs of PPy–Cu nanocomposites with different CuCl2 concentrations. Inset: TGA graph segment of the PPy–Cu nanocomposites between 0 and 475 °C.
Download figure:
Standard image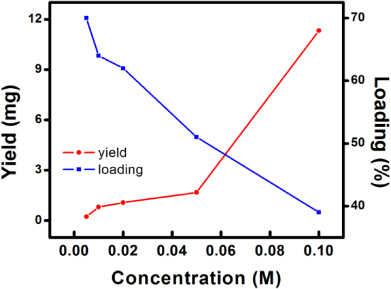
Figure 7. Schematic illustration of the relationship between the CuCl2 concentration, Cu loading, and reaction yield.
Download figure:
Standard imageVanadium pentoxide (V 2O5) nanofiber has been well recognized as an efficient seeding agent to generate nanofibril CP networks in high quantity [2–4]. Generally speaking, V2O5 nanofiber defines its seeding role by oxidizing pyrrole monomer to generate nanofibril PPy oligomers duplicating its shapes; then the oligomers will serve as active seeds to polymerize into PPy nanofibers and induce the bulky fibrous network formation. However, for the synthesis reaction of PPy–metal nanocomposites, V2O5 is believed to play a dual role as both a seeding template and an auxiliary oxidant. Figure 8 shows the in situ OCP change of the whole reaction process. It can be clearly seen from figure 8 that for both the PPy–Ag and –Cu systems, each V2O5 addition results in a positive shift of the OCP, indicating a higher oxidative power of the system. More importantly, V2O5 also coordinates with the metal salts to give a sufficiently high equilibrium potential prior to the pyrrole addition (figures 8(A) and (C)), which would result in a faster reaction kinetics and a higher degree of polymerization. Moreover, the role of V2O5 as the auxiliary oxidant could also be revealed. From figures 8(B) and (D) it can be observed that V2O5 can oxidize pyrrole solely prior to the addition of metal salts; the equilibrium potential of the system drops instantly after the addition of pyrrole, which indicates a rapid redox reaction between pyrrole and V2O5. However, this phenomenon is in accordance with the previous study that V2O5 could serve as the reactive seeds which could induce the nanofibril PPy formation by generating fibril pyrrole oligomers duplicating its shapes [2]. Based on the dual roles of V2O5 nanofibers, an authentic reaction mechanism could be proposed for the PPy–metal nanocomposite formation. As pyrrole is added into the mixture solution of V2O5 and metal salts, a synergistic co-oxidation process would dominate the formation of nanofibril PPy–metal networks. On one hand, the pyrrole monomer would react with the V2O5 nanofibers to generate nanofibril oligomers as seeds for the bulky network formation; on the other, the redox reaction between the metal ions and pyrrole would eventually lead to the metallic particle formation and pyrrole free radical supply for polymerization. A rapid reaction kinetics could be achieved as a result of the synergistic co-oxidation effect of the V 2O5–metal salt oxidant system, which is much faster than the sole redox reactions between the metal salts and pyrrole [13, 14]. Eventually it will lead to the formation of bulky nanofibril PPy–metal nanoparticle composites.
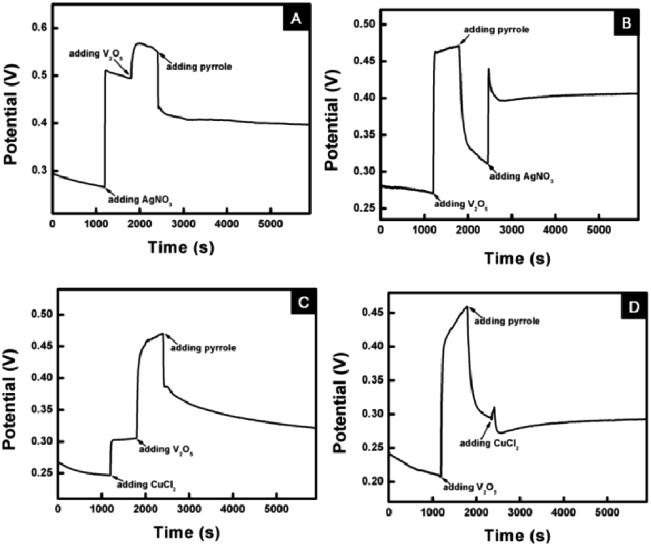
Figure 8. Potential–time profiles of pyrrole polymerization via different systems in different reagent addition sequences: (a) AgNO3/V 2O5/pyrrole (0.02 M); (b) V 2O5/pyrrole/AgNO3 (0.02 M); (c) CuCl2/V 2O5/pyrrole (0.02 M); (d) V 2O5/pyrrole/CuCl2 (0.02 M).
Download figure:
Standard imageSilver nanoparticles (Ag NPs) have been proved to possess excellent sensory properties towards H2O2, and they have also been widely utilized to fabricate various kinds of non-enzymatic H2O2 sensors [15–17]. However, the sensory response of the Ag NPs towards H2O2 is expected to be enhanced upon immobilization onto the highly conductive substrates such as conducting polymers and CNTs, possibly due to the accelerated electron transfer process on the electrode–electrolyte interface [18]. Therefore, in order to investigate the sensory properties of the as-synthesized PPy–Ag nanocomposite towards H2O2 and the possible metal–support interaction that may be involved, a PPy–Ag modified graphite electrode (PPy–Ag/G) was fabricated and subjected to the amperometric detection of H2O2. Figure 9(A) shows the as-obtained CVs of the PPy–Ag/G electrode with different H2O2 concentrations in PBS solution. A pair of redox peaks located at 0.1 V and − 0.05 V could be observed according to the CVs, which could be ascribed to the transitions of Ag0/Ag(I), and Ag(I)/Ag0, respectively [19]. On the other hand, a pair of broad anodic and cathodic waves, which center at − 0.25 and − 0.45 V accordingly, is also shown on the CVs. However, the anodic wave at − 0.25 V possibly arises from the oxidation of PPy and the ingression of anions/expulsion of cations; while the cathodic wave at − 0.45 V could be ascribed to the reduction of PPy as well as the expulsion of anions/ingression of cations [20, 21]. The observation that both features of Ag NPs and PPy are presented in the CVs thus indicate a strong interaction between the nano-deposits (Ag NPs) and the polymer support (PPy) [19], possibly through the synergistic electronic interactions between Ag NPs and the conducting polymer support. Nonetheless, a continuous increase in the cathodic current density of the CVs could be clearly observed with the increasing H2O2 concentration, which indicates the notable electrocatalytic activities of the PPy–Ag towards the reduction of H2O2, possibly due to the synergistic amplification effect of the metal–support interaction along with the electrocatalytic properties of the Ag NPs towards H2O2 [16]. Figure 9(B) shows the amperometric response of the PPy–Ag/G electrode upon successive addition of H2O2. The detection potential was set at − 0.45 V, for most of the Ag NP-based sensory materials for H2O2 exhibit a characteristic peak current around − 0.45 V, and a relatively low overpotential could be attained for the detection of H2O2 [15–17]. However, rapid response of the PPy–Ag/G electrode corresponding to each addition of H2O2 could be observed, as the amperometric current increases and reaches the steady state within 5 s. The electrode also shows a linear response to H2O2 from 0.1 to 1.6 mM, with a correlation coefficient of 0.991 and a sensitivity of 208.8 μA mM−1, which are demonstrated by the calibration curve (figure 9(B): inset). The sensitivity is sufficiently high as it surpasses plenty of other electroactive materials for H2O2 demonstrated before [16, 22]. Thus, it could be inferred from the amperometric test result that the PPy–Ag/G electrode obtains notable sensory properties according to amperometric detection of H2O2, indicating considerable application potential for the PPy–Ag nanocomposite as an electrode material for the fabrication of H2O2 sensors.

Figure 9. (A), (C) CVs of PPy–Ag nanocomposite modified graphite (PPy–Ag/G) and C–Ag/G electrodes in a 10 mM PBS solution in the absence and presence of H2O2 with different concentrations (from top to bottom: 0, 0.1, 0.5, 1, 1.5, 2, 2.5, 3 mM). Scan rate: 20 mV s−1. (B), (D) Amperometric responses of PPy–Ag/G and C–Ag/G electrodes upon successive addition of 0.1 mM (0.1–1.6 mM) in a stirred 10 mM PBS solution. Applied potential: − 0.45 V. The inset shows the corresponding calibration curves of the electrodes in the measured H2O2 concentration range.
Download figure:
Standard imageIt has been reported that a conducting polymer–metal composite could be converted to a nanocarbon–metal composite upon microwave irradiation [11]. The conversion of a conducting polymer support to a nanocarbon support is supposed to enhance the overall performance of the nanocomposite, as nanocarbons (carbon nanotubes, carbon nanofibers, graphenes, etc) generally obtain higher conductivity, stability, and processibility than conducting polymers [23]. In order to testify this speculation and evaluate the effect of microwave treatment, the PPy–Ag nanocomposite was subjected to microwave irradiation with the method described previously [11]. The resulting electrochemical and sensory properties of this nanocarbon–Ag nanocomposite (C–Ag) were also measured in comparison with the PPy–Ag nanocomposite using a C–Ag modified graphite electrode (C–Ag/G). The as-obtained CVs for the C–Ag/G electrode in PBS with different H2O2 concentrations are shown in figure 9(C). Compared to the ones of the PPy–Ag/G electrode, a higher current density and a clearer peak separation could be observed for the C–Ag/G electrode, indicating an accelerating electrode process of the C–Ag nanocomposite resulting from the enhanced conductivity and specific surface area of the nanocarbon support [11]. On the other hand, the amperometric response of the C–Ag/G electrode was also enhanced substantially compared to the PPy–Ag/G electrode. However, the electrode shows a linear response to H2O2 from 0.1 to 1.6 mM with a correlation coefficient of 0.994 and a sensitivity of 331.0 μA mM−1 (figure 9(D)). Moreover, a decrease in noise could also be observed for the amperometric response of the C–Ag/G electrode. Nonetheless, the enhanced CV and sensory response of the C–Ag/G electrode could be unambiguously attributed to the relatively higher conductivity and specific surface area of the nanocarbon support obtained after the microwave treatment, which thus enhances the metal–support interaction through an accelerated interfacial electron transfer process, similar to the case of a carbon support platinum catalyst [18]. The CV curve shape of C–Ag/G displays subtle changes compared with PPy–Ag, as the redox waves corresponding to PPy could still be observed. This phenomenon thus indicates the incomplete nanocarbon conversion upon the microwave treatment; only a small portion of the PPy chains have undergone the conversion whereas a large portion is still unaffected, as evidenced by the EDX analysis (table 1).
Table 1. EDX data of the nanocomposites made in different systems.
| Systems | C | N | O | V | Ag/Cu | Total |
|---|---|---|---|---|---|---|
| V 2O5/Pyrrole/AgNO3 0.02 M | 42.51 | 37.41 | 15.41 | 0.25 | 4.42 | 100 |
| Microwaved V 2O5/Pyrrole/AgNO3 0.02 M | 85.54 | 0 | 0 | 1.18 | 13.28 | 100 |
| V 2O5/Pyrrole/CuCl2 0.02 M | 38.86 | 34.33 | 19.63 | 5.94 | 1.24 | 100 |
| Microwaved V 2O5/Pyrrole/CuCl2 0.02 M | 73.34 | 0 | 18.75 | 5.82 | 2.09 | 100 |
The influence of the initial metal salt concentration on the sensing performance of the PPy–Ag nanocomposite is also investigated. PPy–Ag nanocomposites synthesized with different silver nitrate concentrations were weighed and used as the electrode active material towards H2O2. It can be clearly observed from the CVs that the current densities of the two peaks at 0.1 and − 0.05 V, which indicate Ag(0)/Ag(I) transitions, are increased with increasing silver nitrate concentration up to 0.05 M (figure 10). It thus indicates a higher electroactive surface area of the PPy–Ag composites synthesized by increasing metal salt concentrations. After the addition of 0.5 mM H2O2 into the testing solution, all the CVs corresponding to different PPy–Ag composites unambiguously show an increase in current density during the cathodic scan, evidencing the electrocatalytic properties of the PPy–Ags to H2O2 (figure 10). The responsive currents (ΔA) for the PPy–Ags after the addition of 0.5 mM H2O2 at − 0.45 V are also calculated. As the indication of the sensitivity to H2O2, it can be observed from figure 11 that ΔA increases nearly linearly with silver nitrate concentration up to 0.05M, which coincides with the CV results. However, the decrease in sensitivity at 0.10 M could be attributed to the formation of large Ag particles ( > 10 μm), which apparently decreases the electroactive surface area of the electrode significantly.
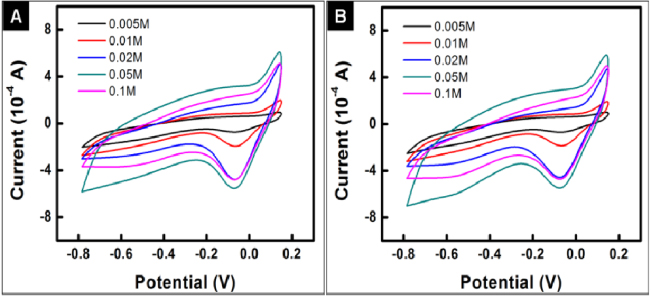
Figure 10. CVs of PPy–Ag/G electrodes with different PPy–Ag nanocomposites as the electrode active material without (A) and with (B) 0.5 mM H2O2. Scan rate: 20 mV s−1.
Download figure:
Standard image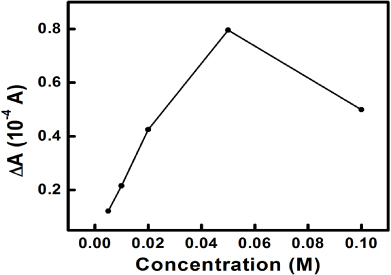
Figure 11. Plot of the responsive current after H2O2 addition versus the initial silver nitrate concentration.
Download figure:
Standard imageThe sensitivity of the PPy–Ag nanocomposites to H2O2 could be enhanced considerably by facile microwave treatment. However, the PPy nanofibers do possess excellent microwave absorptivity and they are believed to be converted into nanocarbons upon microwave irradiation. The nanocomposites have retained their morphologies during the fast microwave treatment (figures 12(A) and (B)); and upon losing nitrogen atoms and dopants in the polymer backbone, the PPy nanofibers are believed to be converted into nanocarbons composed of several graphitic layers with a 0.34 nm layer spacing [11]. The increase in sensitivity of the PPy–Ag nanocomposite upon microwave treatment could be attributed to the nanocarbon conversion. The conductivity and specific surface area of the PPy nanofiber network is believed to increase sufficiently after the microwave-assisted nanocarbon conversion [24]. A higher current density is observed for the PPy–Ag after microwave treatment, evidencing the enhanced charge transport properties of the composite structure (figure 13(A)). On the other hand, the PPy nanofibers show no sensing properties to H2O2, even after the carbonization treatment (figure 13(A): insets). Thus, it can be concluded that the enhanced sensitivity for the microwaved PPy–Ag could be majorly attributed to the enhanced charge transport properties of the nanocarbon network rather than the PPy nanofibers. Figure 13(B) shows the Raman spectrum of the polymer–metal nanocomposite after microwave treatment. The well-known E2g peak of perfect graphite crystal at 1600 cm−1 can be observed; the A1g mode due to the finite crystal size effect is also observed at 1360 cm−1 [25]. It thus indicates the successful nanocarbon conversion upon the microwave treatment to the nanocomposites.
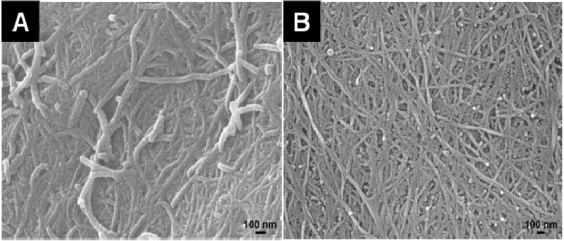
Figure 12. SEM image of PPy–Ag (A) and PPy–Cu (B) nanocomposites after the microwave treatment. Both composites are synthesized in a 0.02 M metal salt concentration.
Download figure:
Standard image
Figure 13. (A) CV curves of PPy–Ag nanocomposite (0.02 M) before (blue) and after (red) microwave. Insets: (upper) CVs of PPy–Ag with (red) and without (black) 0.1 mM H2O2. (Lower) CVs of microwave treated PPy–Ag with (red) and without (black) 0.1 mM H2O2. (B) Raman spectrum of the PPy–Cu nanocomposite (0.02 M) after the microwave treatment. Inset: the spectrum of PPy–Cu before treatment.
Download figure:
Standard image4. Conclusion
In conclusion, we have demonstrated for the first time (i) a concise displacement reaction between transition metals and synthetic metals (PPy) mediated by V 2O5 nanofiber seeds from which a high-yield conducting polymer–metal nanoparticle composite could be synthesized; (ii) V 2O5 nanofiber plays a dual role during the reaction process as both a seeding template and an oxidation agent; (iii) PPy/Ag nanocomposites are an excellent candidate to fabricate high performance non-enzymatic H2O2 sensors; (iv) microwave-assisted nanocarbonization could lead to a higher sensitivity of the polymer–metal nanocomposites. This study thus reveals the unprecedented application potential for the novel nanostructured metal–polymer networks, providing a number of noble pieces as a toolbox for metallic nanoparticle/polymer composite fabrication. This discovery will also have an impact on the future development of the structure and properties of electric composite materials.
Acknowledgments
We gratefully acknowledge financial support from the Department of Commerce, National Science Foundation Award CMMI-1000491, and Auburn University. MJK was supported by the World-Class University Program (MEST through NRF (R31-10026)).