
Abstract
We report the simulation of alpha recoil cascades in zirconolite (CaZrTi2O7) using the molecular dynamics method under a variety of simulation conditions. Interatomic potentials have been developed through fitting to crystalline and melted structures and their energy surfaces obtained from ab initio calculations. Single and double cascades have been modelled, showing that damage recovery in damaged crystalline material is greatly impaired when there are multiple events. The calcium ions are significantly easier to displace than other ions, which is consistent with a recent ab initio study of defect energies.
Export citation and abstract BibTeX RIS
1. Introduction
Safe long-term storage of nuclear waste, including surplus plutonium, is one of the largest international environmental challenges. In the search for a suitable encapsulation material, it is essential to identify one that is durable over very long timescales (millions of years); leaching of radioactive ions out of the encapsulation matrix into the surrounding environment—ground water in particular—could be potentially disastrous, with risks to human health being particularly serious. Experimental studies have shown that materials react very differently to alpha-decay, with some, such as the much studied ZrSiO4, undergoing amorphization and almost complete breakdown of long-range crystal order [1], and others, such as the cubic MgO, retaining the crystal structure with only small numbers of isolated defects [2]. Synroc is a composite material that has gained a great deal of attention over more than 30 years as a potential encapsulation material [3, 4]. This synthetic rock is mainly composed of three mineral phases, hollandite (BaAl2Ti6O16), zirconolite (CaZrTi2O7) and perovskite (CaTiO3), and has been considered for permanent encapsulation of long-lived radioactive actinides, particularly plutonium [5]. In order to assess minerals for their suitability as waste-hosts, it is important to understand what is happening to the structures at the atomic level.
In this work, we study monoclinic zirconolite—whose crystal structure [6] is shown in figure 1—using large-scale molecular dynamics (MD) simulations to assess the impact of heavy-atom collision cascades on its crystal structure. While the alpha particle carries away a larger amount of energy, it is the PKAs (primary knock-on atoms) that cause more damage due to their larger cross-section. Zirconolite is under consideration as a waste-form candidate material.
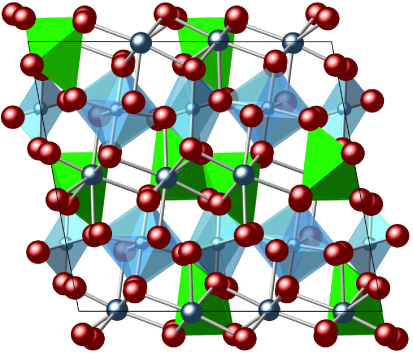
Figure 1. Crystal structure of monoclinic zirconolite viewed down the b axis (taken from [6]).
Download figure:
Standard imageWe simulate alpha-radiation recoil cascades produced by uranium ions (a representative decay cascade heavy PKA) with large and realistic kinetic energies within pristine and damaged crystals of zirconolite. We analyse the degree of amorphization of this mineral using both single and double cascades. A previous cascade study of zirconolite using MD was reported by Veiller et al [7], but the technological capabilities at the time limited that study to much smaller sample sizes, some two hundred times smaller than those presented here, and recoil energies that were at best six times smaller. More recently Mulroue et al [8] have reported ab initio studies of point defects in zirconolite.
2. Methods
2.1. Molecular dynamics simulation details
The cascade simulations were performed using the DL_POLY3 simulation code [9], which has been optimized specifically for very large samples and for studies of radiation damage. For the studies presented here, we worked with samples containing 1.2 million atoms, which are sufficiently large to contain the whole cascade without interaction between periodic images. We will report simulations performed with both constant-volume/constant-energy (NVE) and constant-stress/constant-temperature (NST) ensembles. The use of the NST ensemble is perhaps unusual in this context but allows us to identify any volume expansion effect. This is legitimate as the energy difference between the NVE and NST is actually minimal. For example after 7.5 ps, the total energy of the NPT 70 keV simulation was −4.1262 × 10⁷ eV and for the NVE ensemble −4.1208 × 10⁷ eV. A variable timestep method was used in order to optimize the use of computing time, with shorter time steps used in the initial stages with high particle kinetic energies, and the value being reset automatically based on the maximum kinetic energy. The initial timestep was set at 0.0001 ps with the maximum timestep being 0.000 16 ps and the minimum 0.000 05 ps. We performed comparison simulations in which a boundary layer of 7.5 Å at the edge of the model was used to dissipate energy through rescaling of the kinetic energy, but it was found that this made little difference compared to the simulations where we either removed no energy or used a thermostat to dissipate energy. The PKA direction for each simulation was [1 1 1]. The direction used in simulations can be significant when using lighter PKAs, causing channelling in low-density directions for example. However, in zirconolite and using a particularly heavy PKA, this is not expected to be the case here.
2.2. Empirical potentials
The interactions between atoms in the simulations consisted of long-range Coulomb interactions and short-range pair interactions, the latter being modelled using Buckingham potentials:
where rij is the distance between atoms of types i and j, and the values of the parameters Aij,Cij and ρij were fitted alongside values of the ionic charges. As these potentials were required to function with both perfect crystal structures and with severely damaged and disrupted structures, it was felt that fitting the potentials to both melted and non-melted structures would reduce any bias in the amorphization/recrystallization process towards the crystalline state. To achieve this, an MD simulation on a small sample using trial potentials was carried out at 5000 K to give configurations corresponding to the molten state, and 20 snap shots were saved. The energies of the molten configurations were calculated using density function theory with ultrasoft pseudopotentials as implemented with the code CASTEP [10]. In the fitting of the potentials, both the perfect crystal structure [6] and the structures and energies of the melted structures were used, and this was undertaken using the GULP code [11]. The goodness of fit was measured against the CASTEP calculated elastic constants, bulk modulus and lattice parameters. In addition it was a requirement that all phonon frequencies had real values. Table 1 lists the final potentials for zirconolite including the ion charges. For all sets of potentials, the fitting process showed that the O–O potential of Catlow [12] was the optimum and this was kept constant during the final fitting process. The calculated lattice parameters matched to within 2.8% of the CASTEP values. The c11 and c44 elastic constants agreed to within 4% and 13% respectively, and the bulk modulus was consistent to within 6.5%, table 2. The cut-off for the pair potentials was 10 Å.
In using melted structures for the zirconolite potential fitting, it was important to try to understand what difference, if any, the inclusion of the melted structures had on the development of the model potentials. Producing a second set of potentials fitted only to the optimized structure would allow this comparison to be made. Table 1 lists the final potentials from this fitting process. The lattice parameters were fitted in this case to within 3% and the bulk modulus 6%. Again all phonons had real values, which was an imposed requirement of the potentials.
The Buckingham potential suffers from the fact that at very small interatomic distances U(r) has a maximum value and then falls towards −∞ as r → 0. Usually this is not important, but in cascade simulations the high atomic energies can lead to very short interatomic distances. Thus at short distances the Buckingham potentials were merged to the strongly repulsive and often-used ZBL potential. The ZBL was joined to the Buckingham potentials at 0.8 Å [13]. The Buckingham potential and ZBL were plotted and joined by eye. A best-fit equation was then generated to smooth the merger and the full potential generated up to 10 Å. The equilibrium potential for the single U–O pair was taken to be the same as the Zr–O potential, with only the ZBL specifically fitted. Metal–metal interactions were defined entirely by the appropriate ZBL potentials.
Table 1. Fitted Buckingham potential parameters for zirconolite. As described in the text, Model 1 was based on the computed energies of the melted structure, whereas Model 2 was based solely on data for the perfect crystal structure. The ionic charges given in the last column correspond to the ion(s) highlighted in bold in column 1.
| Atom pair | A (eV) | ρ (Å) | C (eV Å6) | Charge (|e|) | ||
|---|---|---|---|---|---|---|
| Model 1 | Model 2 | Model 1 | Model 2 | |||
| O–O | 22 764 | 22 764 | 0.149 | 0.149 | 32.8 | −2 |
| Ca–O | 584.187 | 751 | 0.346 | 0.337 | 0 | 2.053 |
| Zr–O | 1547.795 | 1 620 | 0.347 | 0.344 | 0 | 3.988 |
| Ti–O | 1244.016 | 1 270 | 0.351 | 0.348 | 0 | 3.967 |
Table 2. The c11,c12 and c44 elastic constants and the bulk and shear modulus values, K and G respectively, obtained from first principles calculations on an optimized zirconolite unit cell (CASTEP); experimentally from a zirconolite sample; empirical potentials derived from fitting to an optimized unit cell (Empirical 1) and empirical potentials derived from fitting to both an optimized structure and twenty melted structures as outlined above (Empirical 2).
| Sample | c11 (GPa) | c44 (GPa) | c12 (GPa) | K (GPa) | G (GPa) |
|---|---|---|---|---|---|
| CASTEP | 298 | 89 | 140 | 181 | 51 |
| Experiment | — | — | — | 158 | 87 |
| Empirical 1 | 378 | 97 | 117 | 200 | 102 |
| Empirical 2 | 312 | 102 | 80 | 169 | 98 |
2.3. Comparison with experiment
In order to compare the potentials with experimental data, a sample of polycrystalline zirconolite was obtained, from which a parallelepiped 2.341 mm × 2.882 mm × 4.827 mm was cut for measurements of the bulk modulus, K, and the shear modulus, G. The methods have previously been described [14]. The sample was not completely phase-pure as a small excess of ZrO2 and TiO2 were added during production to buffer against CaTiO3 formation. Using the value of density for the crystal structure [6] the porosity of the sample was calculated to be around 2%. Table 2 presents a comparison of bulk modulus and shear modulus as well as the elastic constant data from the two sets of zirconolite potentials, CASTEP and experiment. Table 2 also shows the percentage difference between the CASTEP results, as the baseline, and the empirical and experimental results. The experimental bulk and shear moduli have been corrected for the 2% porosity. Table 2 shows a reasonable match to the CASTEP results for both the empirical potentials and the experimental data.
3. Single collision cascades
We first discuss the results of MD simulations of single collision cascades in which a single zirconium atom was replaced by a uranium atom with an assigned energy of 70 keV, with the simulations performed using the NVE ensemble. As with previous simulations [15], the damage is created within a picosecond, and after some recovery most subsequent changes in the structure are completed within around 8 ps. The final damaged area has approximate dimensions 30 Å × 60 Å × 30 Å.
In order to provide quantitative information about the effects on the structure from the cascade, we define the concept of an 'atomic defect' as an atom that has moved further than 0.75 Å from any given crystalline position of that atom type. This calculation is programmed directly within DL_POLY3. Although this definition is to some degree arbitrary, it nevertheless enables a quantitative comparison of the effects of the cascade on different atom types. Figure 2 shows the number of defects per type of atom through the course of the simulation. At the end point of the simulation there are 3797 oxygen defects, 2106 calcium defects, 379 titanium and 131 zirconium defects. If we scale by the number of each type of atom in the chemical formula, the relative numbers of oxygen, calcium, titanium and zirconium defects are 542, 2106, 190 and 131 respectively. The striking conclusion is that there is a significantly larger fraction of calcium atoms initially displaced than of any other atom type, even more so than the number of displaced oxygen atoms. It is also interesting that whereas figure 2 shows an early-stage spike in the number of defects of most atom types, indicating a degree of recovery of the structure after the initial stages of the cascade, there appears to be no such peak and hence no sign of recovery of the ordering of the positions of the calcium atoms. To some extent, part of the spike will represent local elastic displacements and relaxation of the structure following the explosive release of kinetic energy in the early-stage collision cascade, but in the case of the calcium atoms it appears that they are easily displaced from their positions within the crystal structure and are unable to return back to their ordered sites during the relaxation stage, remaining as permanent defects.

Figure 2. Number of defect interstitial atoms in a single cascade at 70 keV in zirconolite. The purple line represents the total, the green line oxygen, the blue line calcium, pink titanium and red zirconium. Of all ions oxygen is the most mobile and of the cations calcium defects greatly out number all other defects. The waves visible across the plot are due to the re-entry of the energy wave into the cell across the periodic boundary, hence the fattening of the lines towards the end of the calculations.
Download figure:
Standard imageTo gauge the changes in long-range crystallinity of the perfect and final structures, pair distribution functions (PDF), which describe the histogram of interatomic distances, were calculated. These are presented in figure 3. The perfect crystalline PDF is presented along with the PDF calculated in the vicinity of the damaged area. This resulted in an irregular volume of material, which is why the PDFs of figure 3 were calculated only to 10 Å. The PDFs of the ordered and damaged materials have significant peak differences in the peak positions, with reduced detail in the damaged material symptomatic of the reduced degree of crystalline order, although the peak positions at short distances are at approximately at the same positions.

Figure 3. PDF zirconolite in the perfect and final states. The black line shows the PDF from the perfect structure and the red line is the PDF from the damaged area, scaled to g(r) = 1 at large distances. While the difference is not clear-cut, there is an absence of ordered peaks at the medium-range distances, suggesting a certain amount of amorphization.
Download figure:
Standard imageTitanium coordination number was assessed by using 1.5× the sum of the atomic radii to define a maximum bond length. In the damaged area, most titanium atoms have oxygen coordination of 2, 3 or 4, with no 5 or 6 coordinate titanium ions in the inter-layer positions. There are a number titanium–oxygen bridges between adjacent layers of titanium atoms, similar to those found in the titanate perovskite, CaTiO3. In this case Ti–O–O–Ti and Ti–O–Ti–O bridges were most common, and their presence in the MD simulation was supported by ab initio calculations [16].
The calcium ions in the damaged area can also found lying in between the usual calcium planes. It is found that the calcium defects either have the calcium ions in new inter-planar layers, or else they remain in the same approximate position as in the crystal structure but with a different oxygen coordination.
This cascade was also carried out using the NST ensemble, as previous work has shown that materials such as zircon expand when damaged by irradiation [17]. Indeed, in the case of zircon the volume expansion is of around 20% [18, 19]. Previous experimental studies on zirconolite have shown a volume expansion to a maximum of 2.1% in doses of up to 1023 alpha events m−3 [20]. The final structure is very similar to the NVE results presented above, with the final structure being composed of a small, isolated area of damage (82 Å × 45 Å × 28 Å) and a largely defect-free remainder of the crystal structure. In terms of defect numbers, after 16.64 ps, there were 3297 oxygen interstitials, 1090 calcium, 335 titanium and 136 zirconium. These numbers are of the same order of magnitude as for the NVE simulation. Figure 4 shows the full PDF for this structure. Looking at both the final structures and the PDFs it is evident that the choice of ensemble plays very little part in the resulting nature of the damage. The progress of the volume change is shown in figure 5 with the overall change corresponding to a slight shrinkage of the structure.
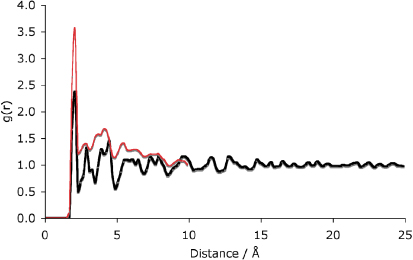
Figure 4. PDF of the damaged area from the NST simulation (red) as compared to the perfect crystalline structure (black). The PDF is very similar to that of the NVE run, with crystallinity largely preserved.
Download figure:
Standard image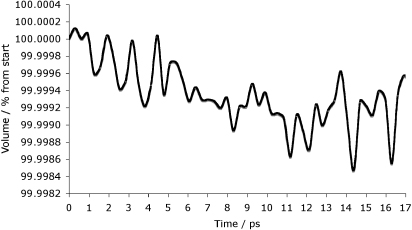
Figure 5. Volume change of the cell up to 17 ps (right). The final structure shows isolated damage coincident with the end of the PKA track. In addition a small amount (−0.9%) of volume shrinkage is observed.
Download figure:
Standard image4. Double cascade
To investigate the nature of damage in a previously damaged structure, a double cascade was conducted with two 70 keV PKAs being employed, the second one being released after the structure had relaxed following the first PKA. The damage remaining at the end of the simulation is much greater than with the single cascade (120 Å × 84 Å × 87 Å). As with the single cascades the defect pattern shows a large number of calcium and oxygen defects, with far fewer zirconium and titanium defects.
There is one significant point of interest with the dual cascade, which is seen by comparing the time dependence of the count of new defects shown in figure 6 with the corresponding count for a single cascade, figure 2. Although the broad features for the different atom types are very similar for the dual and single cascade, including the thermal spike seen for all atom types other than calcium, it is noticeable that the number of oxygen defects remaining after the thermal spike is larger from the second cascade, and the number of calcium defects generated by the second cascade is approximately twice the number generated by the first cascade.
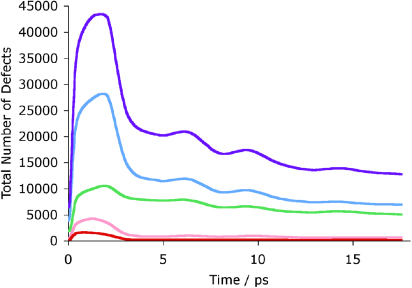
Figure 6. Defects in the dual cascade in zirconolite. The purple line represents the total, the green line calcium, the blue line oxygen, yellow titanium and red zirconium. The same pattern of defect evolution is visible as in the single cascade with oxygen and calcium ions having the greatest mobility. The waves visible across the plot are due to the re-entry of the energy wave into the cell across the periodic boundary, hence the fattening of the lines towards the end of the calculations.
Download figure:
Standard imageThe picture that emerges is that the damage caused by a cascade in the vicinity of a previous cascade will lead to more overall damage than the sum of two separated cascades. This suggests that is easier to displace atoms from the previously damaged structure than from the pristine crystal. The significance of this is that it suggests that amorphization will be accelerated with continued dose.
5. Alternative interatomic potentials
So far all the calculations have been conducted with the potential parameters fitted to the melted structures (table 1). However, to assess the value of fitting the potential parameters this way, a single 70 keV cascade was carried out with parameters fitted solely to the optimized crystal structure (parameters also reported in table 1). The overall effect is very similar in that a small, isolated area of damage remains at the end of the simulation. However, in terms of defects there are actually more in total for the second potential (10 339 total, compared with 7707 for the melted potentials, at 13 ps).
In addition it is noticeable that point defects can be found at large distances from the main damage area. Figure 7 shows the evolution of the number of defects. Compared with figure 2, the numbers of titanium and zirconium defects are very small for both models (128 zirconolite defects for the cascade simulated using the original potential, only 6 with the non-melted potential; 420 and 563 titanium defects respectively for the corresponding models). The number of oxygen defects is also similar, with 4544 (melted potentials) and 4981 (non-melted potentials). The largest difference is with the calcium ions, which number 4789 in this cascade and 2615 in the original (melted potentials) simulation. In addition, figure 7 shows that the evolution of the defects is different with the calcium defect number peaking above that of oxygen, although the final structures and defect profiles are similar. Despite the differences in defect profiles it is clear that the choice of potential does not heavily bias the results towards crystallinity or amorphization.
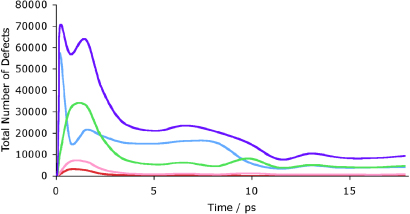
Figure 7. Defects in the 70 keV cascade using non-melted potentials and the NVE ensemble. The purple line represents total defect numbers, blue calcium, green oxygen, yellow titanium and red zirconium. While the number of defects at the end point of the simulation is similar to the original calculation the evolution of the defects is somewhat different with the calcium defect numbers peaking above those of oxygen.
Download figure:
Standard image6. Conclusion
The simulations reported in this work show, in broad details, behaviour consistent with a number of previous simulations with high recoil energies and large samples [1, 15–17]. In particular, the structure relaxes quickly after the initial damage as seen in the spike in the number of defects, with some degree of recovery of the crystal structure together with some residual damage in terms of a structurally disordered core region around the cascade and some more widely distributed point defects. While only a very limited number of simulations were run, due to the large computational requirement, and it is therefore difficult to draw any more general conclusions about the 2 sets of potentials and the affects of the second cascade, there are two key results from this work. Firstly, a second cascade in the vicinity of pre-existing damage leads to a larger number of displaced atoms compared to the number generated by a single cascade, and secondly, calcium atoms are overwhelmingly more likely to be permanently displaced through a cascade than any of the other atomic species. This latter point is actually consistent with the defect calculations recently reported by Mulroue et al [8], that showed the energy associated with the formation of calcium Frenkel defects to be much lower than for other atom species in zirconolite.
Acknowledgments
We would like to thank NERC (grant code NE/C004035/1) for funding this project. Via our membership of the UK's HPC Materials Chemistry Consortium, which is funded by EPSRC (EP/F067496), this work made use of the facilities of HECToR, the UK's national high-performance computing service, which is provided by UoE HPCx Ltd at the University of Edinburgh, Cray Inc. and NAG Ltd, and funded by the Office of Science and Technology through EPSRC's High End Computing Programme. In addition we would like to acknowledge the HPC Darwin computing facility at the University of Cambridge. We would also like to thank Dr Ewan Maddrell (National Nuclear Laboratory, UK) for useful discussions during the course of this work.