
Abstract
Pure bending behavior of Nb3Sn wire over a wide range of bending has been characterized. A previously developed test device designed to apply variable bending strains to Nb3Sn strands using a beam style sample holder was used. Based on finite element and experimental investigations, two sample holder beams were developed to cover pure bending strains up to 1.25% for ITER-type Nb3Sn wires. These newly designed beams were optimized to apply consistent and uniform pure bending strains to Nb3Sn strands over the entire bending range. Their performance was evaluated by testing two ITER-type Nb3Sn wires including one internal tin and one bronze route. The internal tin strands experienced around 55% critical current degradation at 1.25% bending strain while the critical current of the bronze route strands were only reduced by 40%. Upon removal of the bending load, the internal tin wires experienced significant permanent degradation whereas the bronze route wires were completely reversible. These critical current results were evaluated and explained using an existing integrated model accounting for neutral axis shift, current transfer length, filament breakage and uniaxial strain release under pure bending loads.
Export citation and abstract BibTeX RIS
1. Introduction
Interest in the behavior of Nb3Sn superconducting strands under pure bending loads has grown following the unexpected degradations experienced in ITER central solenoid coil tests [1]. The degradations are suggested to be in part caused by the repeated bending strain experienced in the strands of a multistaged cable-in-conduit conductor (CICC) [2]. To better understand the influence of these bending strains, experimental work has been done on pure bending [3–5], spatial periodic bending [6–8] and jacketed bending [9, 10] as well as analytical modeling of bending [2, 11, 12].
The experimental pure bending research uses a variable bending-strain device that was designed to apply uniform bending strain to superconducting samples while resisting against the electromagnetic Lorentz load created from the transport current in a background magnetic field of 11–15 T. The device was originally used to characterize the critical current of five different Nb3Sn wires up to a maximum applied bending strain of 0.8% [3]. However, the operating strains of superconducting strands within ITER magnet coils are expected to reach values above 0.8% [13]. Thus, to accurately model these coils, the pure bending performance of Nb3Sn wires at higher bending strains are necessary.
This paper describes in detail the work that has been done to characterize the critical current of Nb3Sn strands up to 1.25% bending strain using the variable bending-strain device. This work includes preliminary testing of three beams designed to cover the wider bending range, a finite element investigation into a critical current discrepancy, the optimization and development of two improved sample holders as well as the critical current testing and evaluation using an integrated pure bending model.
2. Pure bending device
2.1. Design of device
The pure bending device is a robust mechanism able to test high current superconducting wire over a range of bending strains in the presence of high magnetic fields [3–5]. The device operates by continuously bending samples through an evolution of bending states using the lever arm approach originally adopted by Goldacker et al [14] for characterizing high temperature superconductors under bending. The principle idea behind this approach is to fix the ends of a beam to lever arms which rotate about fixed pivot points. Opposite rotation of the lever arms causes the ends of the beam to move closer together bowing the beam into a circular arc. The lever arm approach provides a good approximation to true pure bending motion.
The rotation of the pure bending device is controlled by a DC motor located outside the cryostat. The DC motor applies rotation to an input shaft which connects to the gear train as shown in figure 1(a). The gear train consists of two continuous worm drives which produce a total gear ratio of 972–1. The first worm drive converts the rotation of the input shaft into rotation of the drive shaft while the second worm drive converts the rotation of the drive shaft into opposite rotations of two torque gears. The torque gears rotate the lever arms which are attached to the ends of the two sample holders by beam clamps as seen in figure 1(c). As the lever arms rotate, opposing moments develop on the ends of the sample holder beams causing them to bend.

Figure 1. Pure bending test device. (a) Gear train consisting of two continuous worm drives [4]. (b) Sample holder beam highlighting vertical support ribs, wire channel and current terminators [15]. (c) Front view of the variable bending-strain device showing two sample holders, lever arms and beam clamps [17]. (d) Back view of the variable bending-strain device indicating current leads, current terminators and the input shaft [17].
Download figure:
Standard image High-resolution imageThe sample holders were designed to place two Nb3Sn strands in channels machined along their top and bottom edges as seen in figure 1(b). This was done to place the wires at the geometric neutral axis of the sample holder ensuring they experience a state of pure bending. Two beams were used at once allowing four Nb3Sn wire samples to be characterized at each bending state. To help resist against the electromagnetic Lorentz load during testing, evenly spaced vertical support ribs were added along the length of the beams as illustrated in figure 1(b). To provide a means of transitioning the current from the copper leads to the Nb3Sn wire, current terminators were mounted to the ends of the sample holder.
Each sample holder was fabricated out of annealed Ti-6Al-4V titanium alloy due to its high elastic strain limit of 1.4% at 4.2 K and its similar coefficient of thermal expansion to Nb3Sn. The current terminators were made out of Oxygen-free high thermal conductivity (OFHC) copper for its electrical properties. All other device components were made out of austenitic 316 grade stainless steel for its high strength at cryogenic temperatures and low magnetic permeability. A consistent material was chosen throughout the gear train to maintain geometric relationships as the components cool to cryogenic temperatures. Additional information on the device development can be found in [4, 16].
2.2. Bending curvature
The pure bending device was designed for a maximum lever arm rotation of 114° based on the limited space within a cryostat in a high field magnet. That amount of rotation corresponds to a theoretical device setting strain of 1.4% (corresponding to 1.25% corrected strain as described in the following section). The deformed shape of the sample holder at that setting strain is shown in figure 2 alongside three other bending states. The four curvatures clearly represent the entire bending evolution of the sample holder. The deformed shapes were found using finite element analysis as described in section 4.

Figure 2. Deformed shape of the pure bending sample holder over the entire bending range. (a) Finite element simulations of the deformed sample holder shape at four representative bending strains. (b) Plot of the deformed sample holder shape (as found from the numerical simulations) versus the corresponding perfect circular arc which represents an ideal pure bending condition. A deviation of the beam curvature from pure bending is seen above 1.0% setting strain.
Download figure:
Standard image High-resolution imagePure bending requires a perfect circular arc with a uniform radius of curvature. To determine the bending accuracy of the device, the deformed shapes of the sample holder seen in figure 2(a) are plotted as dotted lines in figure 2(b) along with their equivalent circular arcs (solid lines). Up to 1.0% setting strain no appreciable deviation from pure bending is visible. At a setting value of 1.4% the deformed shape of the beam deviates from the perfect circular arc. At this bending state, the sample holder has less curvature in the middle and higher curvature at its ends. This noncircular deformation above 1.0% setting strain is an inherent limitation of using the lever arm approach in the limited magnet bore space and is caused by the fixed pivot points.
2.3. Pure bending strain correction
To correct for the noncircular deformation experienced at high bending, above 1.0% setting strain, the actual bending strain on the surface of the Nb3Sn wire was determined using finite element simulations. The numerical strain results were averaged over a 50 mm (1.97'') span in the middle of the 116.38 mm (4.58'') long sample of Nb3Sn wire. This region corresponds to the location over which the primary voltage measurements are taken during testing. Additional information on the numerical calculation of the strain state can be found in [17].
The actual bending strain on the surface of the Nb3Sn wire is plotted against the theoretical setting strain of the device in figure 3 [18]. The solid curve represents the corrected bending strain of the sample and appears to closely match the dashed ideal strain curve up to a setting value of 1.0%. Above this value, the corrected strain begins to significantly deviate from the setting value as was expected from the noncircular deformation at high bending. At 1.4% setting strain, the middle of the Nb3Sn strand has less curvature resulting in a bending strain of 1.25%, roughly a 12% difference. Unless otherwise noted, for the remainder of the paper bending strain will refer to the corrected strain on the wire surface. Later the corrected bending strain will be converted into the peak bending strain on the superconducting filaments using the copper:non-copper ratio of the Nb3Sn wire.

Figure 3. The applied setting strain of the bending device plotted versus the actual corrected strain on the surface of the Nb3Sn wire as determined from numerical simulations [18]. Above 1.0% the corrected strain begins to significantly deviate from the setting strain.
Download figure:
Standard image High-resolution image3. Preliminary developed sample holders for higher bending strains
3.1. Sample holders tested
The original variable bending-strain device was limited to 0.8% strain by the beam thickness of its sample holder, as indicated in figure 4(a). Above that amount, the strain on the surface of the beam would be greater than 1.4% causing the titanium alloy to yield. To overcome this limitation and reach the desired bending strain of 1.25%, two additional sample holders were developed for medium and high bending. Plastic deformation was avoided by reducing the beam thicknesses of the medium and high bending sample holders from 1.68 mm (0.066'') to 1.16 mm (0.046'') and 0.80 mm (0.032'') respectively [15]. The low bending sample holder maintained the original thickness of 1.68 mm (0.066'') to support the higher Lorentz loads experienced below 0.6% bending.

Figure 4. Annotated section views of the preliminary sample holders indicating the beam thickness, rib span and rib width dimensions. (a) Low bending sample holder highlighting the channel walls, (b) medium bending sample holder and (c) high bending sample holder with no channel walls.
Download figure:
Standard image High-resolution imageThe design of the three sample holders was based on the original beam for up to 0.8% bending strain. The same overall height 26.06 mm (1.026'') and length 162.36 mm (6.394'') were chosen for the beams resulting in a 116.38 mm (4.582'') long test sample of Nb3Sn wire [4, 16]. The dimensions and spacing of the support ribs were modified to help improve the overall strain characteristics of the new sample holders. The rib span was reduced to 4.34 mm (0.171'') while the rib width remained the same at 1.02 mm (0.040'') [15]. Annotated section views of the preliminary three sample holder designs are shown in figure 4.
The high bending sample holder has a beam thickness that is slightly smaller (0.80 mm) than the diameter of the Nb3Sn wire (0.82 mm). Because of this, the high bending beam has no channel walls in between the support ribs as seen in figure 4(c). Therefore, the strands are only supported periodically by the ribs and are not continuously supported by solid material in the plane of bending as they are in the low and high bending beams. Additional details on the design of the preliminary three sample holders can be found in [15].
3.2. Results and findings
A typical set of critical current data for Nb3Sn Hitachi strands of ITER-type bronze route wire is presented in figure 5. Two samples of Nb3Sn wire were tested over each bending range: low bending (LB), medium bending (MB) and high bending (HB). Critical current results for loading and recovery are plotted together.

Figure 5. Preliminary critical current results for the low (LB), medium (MB) and high bending (HB) Hitachi strands showing a critical current discrepancy between sample holders [19]. Two samples were mounted on each beam and are indicated by (1) and (2), top sample and bottom sample respectively.
Download figure:
Standard image High-resolution imageOverall, the data shows a decreasing critical current trend which is the expected behavior for a superconducting wire under increasing bending strains. The key characteristic of these results is a higher critical current trend in the Nb3Sn wire from the high bending beam. The critical current for the low and medium bending sample holders begins to decrease earlier and degrades more sharply than that in the high bending sample holder. At a bending strain of 1.0%, the critical current of the high bending strands is roughly 30 A larger than that of the medium bending strands.
4. Numerical investigation of the critical current discrepancy
A structural finite element investigation using ANSYS® was conducted to determine a cause for the critical current discrepancy found in the preliminary three sample holders. The investigation began with basic numerical models of only the sample holders. It then progressed to appropriately modeling the strain state of Nb3Sn strands in the sample holder channels. Lastly, a full numerical model was constructed featuring Nb3Sn wire mounted on the sample holder and a uniform distributed Lorentz load applied to its center.
All simulations incorporated the same basic settings such as boundary conditions and loads. A half model was created using a symmetry condition to reduce the computation time and complexity. The rotation of the model was applied via a pilot node definition. The solid model was meshed using 20 node structural solid tetrahedral elements with large strain capability. A mesh analysis revealed an adequate overall mesh density of roughly 125 000 elements and 250 000 nodes. A multilinear stress–strain curve for Ti-6Al-4V alloy with an elastic modulus of 133 GPa at 4.2 K was applied to the sample holder [20]. Multifilament Nb3Sn strands are complex and have varied composite properties depending on the wire type [21]. Finding the exact strain state at the filament level is beyond the scope of this work. Thus, the Nb3Sn wire was instead modeled as pure annealed copper with a bilinear stress–strain curve and an elastic modulus of 105 GPa [22]. Due to the uncertainties of friction in a cryogenic environment a coefficient of 0.2 was used for all material interactions. A static non-linear analysis including large deformation was used for the simulations. The discretized finite element model shown in figure 6 indicates the uniform distributed load, symmetry plane, pilot node rotation and mesh density of the Nb3Sn wire.
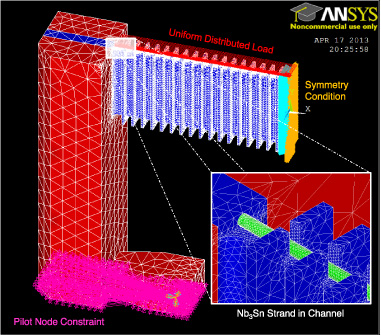
Figure 6. Finite element symmetry model of the pure bending device. A pilot node constraint for rotation is indicated along with the symmetry plane and a uniform distributed Lorentz load. The close-up image highlights the presence of a Nb3Sn wire in the top channel of the sample holder beam.
Download figure:
Standard image High-resolution image4.1. Sample holder analysis
The initial numerical simulations of the three sample holder designs focused on characterizing the exact behavior of the beams over their intended bending ranges. These simulations determined the deformed shape of the sample holder at each bending state which identified a noncircular deformation at high bending as presented earlier in section 2.2.
Another characteristic which was discovered was a shift in the neutral axis towards the compressive side of the beam. Further analysis showed that the shift was caused by a cross-sectional warping of the sample holders due to transverse shearing [23]. A model run without support ribs indicated a more severe cross-sectional warping. Therefore, the vertical support ribs that were initially designed to resist the Lorentz load also have the additional benefit of decreasing the cross-sectional warping and neutral axis shift [15].
4.2. Strand-in-channel modeling
A Nb3Sn strand was added into the channel of the sample holder in the numerical model so that the strain state of the wire could be determined. Care was taken to appropriately model the interaction between the strand and the sample holder to ensure accurate strain distributions within the wire. This was achieved using a target and contact pair relationship which was specified to detect and control the contact behavior of the interaction. No electromagnetic load was applied to the wire in these simulations.
The main finding from the low and medium bending sample holders was a large periodic strain fluctuation on the surface of the wire as illustrated in figure 7. The strain contour shows that the strand exhibits periodic oval regions of high compressive strain on its inner surface. This non-uniform strain behavior is also experienced on the outer surface. These high compressive strain regions on the inner surface lie in between the support ribs indicating that the channel walls have a direct affect on the strain state of the sample. In comparison, the high bending sample holder, with no channel walls, experienced uniform strain distributions on the strand surface in the absence of electromagnetic loads.
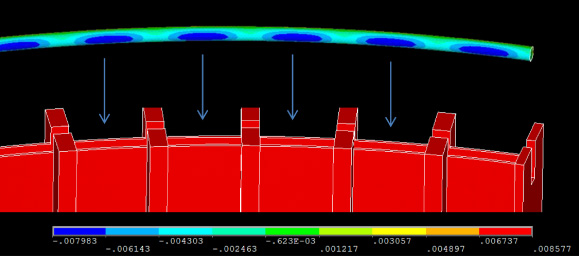
Figure 7. Bending strain contour plot of a Nb3Sn strand removed from the channel of the low bending sample holder. Periodic oval regions of high compressive strain can be seen on the wire surface. The location of these high strain regions are inbetween the vertical support ribs.
Download figure:
Standard image High-resolution imageFurther detailed analysis of the deformed shape of the sample holder revealed that the inner channel walls bow and press into the strand during bending. This phenomenon is shown in figure 8 which is a true scaled top view of the beam. The arrows indicate regions where the sample holder contacts the strand, the bowing channel walls on the inner surface and the rigid support ribs on the outer surface. These periodic contact locations create regions of high contact pressure which affects the strain of the strand. These contact regions not only create large periodic strain fluctuations on the surface, they also create strain fluctuations within the wire which likely affects the performance of the Nb3Sn filaments lowering the critical current of the sample.
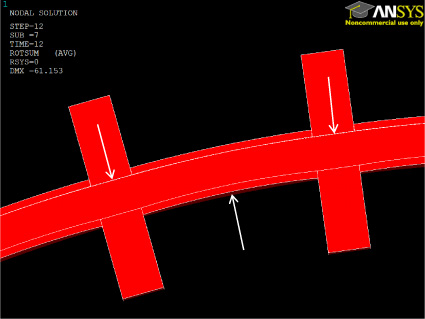
Figure 8. Top view of the deformed sample holder under bending indicating a bowing of the inner channel walls. Arrows represent the locations of high contact pressure on the Nb3Sn wire which cause the bending strain fluctuations presented in figure 7.
Download figure:
Standard image High-resolution imageIn addition to the periodic fluctuations, another interesting characteristic that was found at bending strains above 1.0% was a variation in the magnitude of the strain along the length of the strand. The strain was slightly lower in the middle of the sample and higher at the very ends. This variation in strain along the length of the wire is attributed to the noncircular deformation of the sample holder at high bending, shown in figure 2(b), which indicates less curvature in the middle of the sample and more curvature at the ends. Note that the corrected bending strain presented in figure 3 takes into account this variation over the 50 mm (1.97'') test section in the middle of the sample.
4.3. Lorentz load effects
Following the successful modeling of a strand in the sample holder channel, the electromagnetic loading experienced during testing was investigated. This was carried out by applying a representative Lorentz load to the center of the strand in the form of a uniform distributed load. The results presented in figure 9 are plotted for the highest possible electromagnetic load (5 kN m−1) generated from a transport current of 330 A in a field of 15 T.

Figure 9. Lorentz load effect on the strain state of the Nb3Sn wire at 1.0% bending strain. (a) Strain results from the high bending beam showing a strain fluctuation caused by the electromagnetic load. (b) Strain results from the medium bending beam indicating the electromagnetic load had no significant influence on the strain state. A 5 kN m−1 Lorentz load was used to signify the maximum possible load during testing. Data was taken for the outer and inner surfaces as well as the center of the sample. Results are for a symmetry model where the middle of the wire is located at zero.
Download figure:
Standard image High-resolution imageOne key finding for the high bending beam was that the addition of a uniform distributed Lorentz load, no matter how large, created strain fluctuations along the length of the wire as seen in figure 9(a). These fluctuations are caused by the lack of support for the wire in between the ribs and their severity worsened with the magnitude of applied load.
The loaded medium bending results, shown in figure 9(b), are indistinguishable from the no load case indicating that the Lorenz load has minimal effect on the strain state of the strand for this sample holder. This implies that the channel wall bowing is the primary contributor to the non-uniform strain state in the strand for this sample holder.
A comparison of the Lorentz load results of the two sample holders indicates that the magnitude of fluctuation caused by the maximum loading condition in the high bending beam (0.2%) is still less than the magnitude of fluctuation caused by the bowing of the channel walls in the medium bending beam (0.8%).
Another important finding for the high bending beam was that the Lorentz load did not affect its deformed curvature at a bending strain of 0.6%. This suggests that the high bending sample holder is strong enough to cover a wider range of bending strains than originally designed for. In addition to this, it is low enough that it overlaps the range of the low bending sample holder, which covers up to 0.7% bending, eliminating the need for a medium bending sample holder.
At low bending, the sample holders are most vulnerable to electromagnetic loading effects. In addition to this, the high critical current at low bending results in the largest Lorentz loads. Under this condition, the Lorentz load causes the sample holders to deform in the direction of the load. The deformation of the high bending sample holder under increasing Lorentz load is shown in figure 10. The degree of Lorentz load deformation for the high bending beam was found to be considerably higher than for the low bending beam; proving that the greater beam thickness of the low bending sample holder more adequately reacts the electromagnetic load.
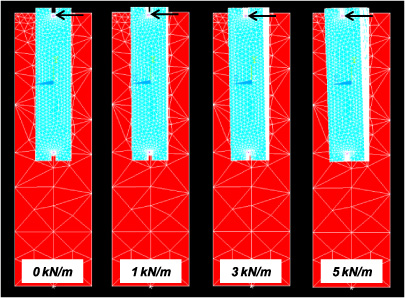
Figure 10. Finite element simulations of the sample holder deformation at zero bending for three different Lorentz loads. The load was applied to a strand in the top channel of the beam in a horizontally left direction as indicated by the arrows.
Download figure:
Standard image High-resolution image5. New sample holders
Finite element analysis identified the channel wall bowing in the low and medium bending sample holders as the probable cause for the critical current discrepancy because the large periodic fluctuations that were produced likely cause a significant degradation in critical current of the wire. To alleviate this issue, a new set of sample holders were designed based on the preliminary high bending sample holder which proved to have favorable critical current behavior given its lack of channel walls.
The new set of sample holders covers the entire bending range using only two beams: low and high bending. The low bending sample holder covers 0.0%–0.7% while the high bending sample holder covers from 0.6% to 1.25% bending strain. The channel walls in both new beams have been eliminated in order to minimize the non-uniform strain distribution in the wires. In addition, the bending strain fluctuations caused by the electromagnetic loads have been reduced by optimizing the support rib design. This was achieved through a parametric study on the strain characteristics of the strand in which the rib spacing, rib thickness and rib width were independently varied. The study recommended an optimized design having rib spacing as small as possible, a rib width less than 1 mm and a rib thickness dependent on the bending range. Additional information can be found in [17].
5.1. New sample holder design
The new sample holders feature 35 evenly spaced support ribs along their length instead of the 21 used in the preliminary beams. This was achieved by reducing the rib span to 2.38 mm (0.094'') and the rib width to 0.81 mm (0.032''). The smaller span significantly reduces the freedom of the sample minimizing the potential magnitude of periodic strain fluctuations when loaded. Dimensioned schematics of the new sample holders are shown in figure 11(a). Overall sample holder length and copper terminators were kept unchanged.
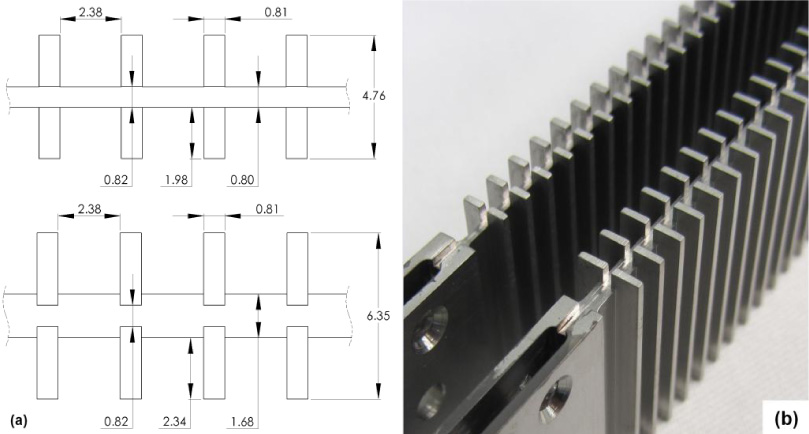
Figure 11. The new low and high bending sample holders. (a) Dimensioned top view schematics of the new high bending (top) and low bending (bottom) beams. Dimensions are given in mm. (b) Fabricated sample holders illustrating the difference in total thickness.
Download figure:
Standard image High-resolution imageThe new low and high bending sample holders were designed to cover the same bending ranges and therefore kept the same beam thickness, 1.68 mm (0.066'') and 0.80 mm (0.032'') respectively. The new high bending beam used the original total thickness of 3/16'' (4.76 mm), while the new low bending beam was designed with a greater total thickness of 1/4'' (6.35 mm) increasing the size of the support ribs. The larger support ribs were chosen to lessen the warping and to reduce the severity of deformation caused by the Lorentz load at low bending. The wider nature of the low bending sample holder can be seen in the isometric view of the fabricated beams in figure 11(b).
5.2. FEA validation of new sample holder design
The improvements of the new sample holder designs were validated using finite element simulations. The numerical strain results from the preliminary and new sample holders are plotted together in figure 12. The plots clearly show a reduction in the magnitude of strain fluctuations for both new sample holder designs. The fluctuations on the surface of the strand for the new high bending beam were roughly half of those in the original design while the new low bending beam reduced the fluctuations by as much as one fifth. The reduction of the strain fluctuations on the surface was mirrored by the elimination of fluctuations within the wire. Thus, the filaments inside the wire experience a uniform strain distribution indicating a state of pure bending.
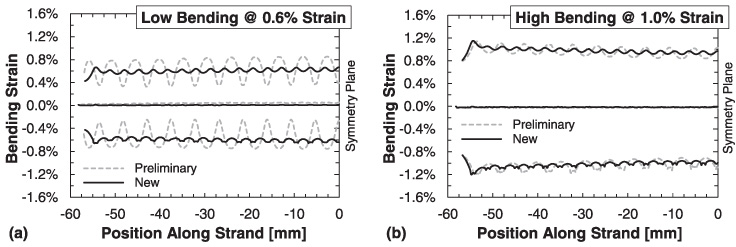
Figure 12. Bending strain improvement of the new sample holders as compared to the preliminary beams. (a) Comparison of the low bending sample holders at 0.6% strain. (b) Comparison of the high bending sample holders at 1.0% strain. Loading conditions and plot details are same as figure 9.
Download figure:
Standard image High-resolution imageAnother improved strain characteristic seen in the low bending sample holder results shown in figure 12(a) was a zero strain condition at the center of the strand indicating an elimination of the neutral axis shift. This was achieved by the larger support ribs lessening the cross-sectional warping of the sample holder.
5.3. Bending strain difference
To quantify the improvement of the new sample holders the bending strain difference on the surface of the Nb3Sn wire was calculated using equation (1) [18]. The bending strain difference is a quantitative average of the Lorentz load effect on the wire as determined from numerical finite element simulations. The corrected bending strain (εcorrected) is found in figure 3 and represents the wire strain state without magnetic loading. The loaded bending strain (εloaded) is the numerically determined strain on the surface of the wire under operational electromagnetic loading. The difference is calculated for (n) nodes along the 50 mm (1.97'') primary voltage tap region in the center of the wire. The difference was found independently for the outer and inner surfaces and was then averaged to combine the contributions from both surfaces.

The bending strain difference results for the preliminary and new sample holders are presented in figure 13 for a Lorentz load of 5 kN m−1. The difference over the entire bending range is a combination of three different effects: the periodic strain fluctuations that the wire experiences during loading which are uniform over the entire bending range, the Lorentz load deformation of the beams which occur only at low bending strains, and the noncircular deformation of the sample holder at bending strains above 1.0%.
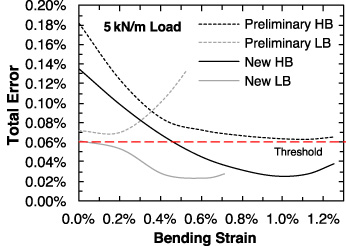
Figure 13. The bending strain difference on the surface of the Nb3Sn wire indicating the improvement of the new low bending (LB) and high bending (HB) sample holders as compared to the preliminary beams. The bending strain difference is a combination of three different effects; Lorentz load deformation, periodic strain fluctuations and noncircular deformation.
Download figure:
Standard image High-resolution imageThe new high bending beam (dark solid curve) showed a strain difference improvement over the entire bending range due to a reduction in strain fluctuations. The new low bending beam (light solid curve) lessened the Lorentz load deformation at very low strains and reduced the strain fluctuations throughout. Overall, both new sample holders show clear improvement of the pure bending strain difference as compared to the preliminary design. A threshold of 0.06% was determined to be an acceptable strain uncertainty to produce true pure bending characteristics. The new sample holders are both below this threshold over their designed bending ranges.
The bending strain difference on the surface of the Nb3Sn wire can also be used to show the influence of the electromagnetic Lorentz load on the new sample holders. A bending strain difference plot comparing the new sample holders with and without a Lorentz load is given in figure 14. The no Lorentz load curves (dotted lines) have zero bending strain difference at low bending until the warping and noncircular deformation begin for the low and high bending beams respectively. The solid curves indicate that the addition of a 5 kN m−1 Lorentz load produces large bending strain difference in both sample holders at low bending. This bending strain difference is worst at zero applied bending and is caused by the Lorentz load deformation that was shown in figure 10. As expected, the influence of the Lorentz load at low bending is less severe in the new low bending sample holder indicating the benefit of using wider support ribs and smaller spacing.
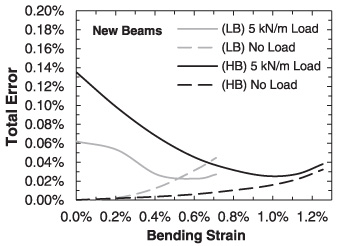
Figure 14. The bending strain difference on the surface of the Nb3Sn wire illustrating the significant Lorentz load effect at low bending for both new sample holders. Solid lines indicate an applied Lorentz load of 5 kN m−1 and the dotted lines represent a no electromagnetic load case.
Download figure:
Standard image High-resolution image6. Test conditions and critical current test results
6.1. Testing conditions and tested wires
All pure bending tests were performed in the 20 T 195 mm (7.68'') warm bore bitter magnet at the National High Magnetic Field Laboratory (NHMFL) facility in Tallahassee, Florida. Experiments were conducted in a bath of liquid helium at 4.2 K and in a magnetic field of 15 T. Critical current measurements were taken over a 50 mm (1.97'') span in the middle of the sample and were analyzed with a Ec = 100 μV m−1 voltage criterion. Data was recorded at 0.1% strain increments up to a setting value of 1.4% (1.25% corrected strain). Irreversibility of the critical current was determined by periodically releasing the applied bending. Each of the sample holders were initially tested over their designed bending ranges (0.0–0.7% for low bending and 0.6%–1.25% for high bending). After this, the high bending sample holder was tested down to zero bending, below its designed range, to characterize the Lorentz load effect at low bending. The sample holders were also used for reversed current tests and the high bending beam was used for cycling tests as well.
Critical current characterization tests were performed for two different ITER-type Nb3Sn wires including one internal tin and one bronze route wire. The internal tin sample was an ITER US Oxford wire (OST) while the bronze route sample was a Hitachi wire (HIT). Two strands of each wire type were mounted on a single sample holder beam and are indicated by (1) top strand and (2) bottom strand. For the reaction heat treatment process, the un-reacted wires were securely placed in the channels of the sample holders and current terminators. Once positioned, the beams and wires went through the heat treatment process. After heat treatment, the reacted Nb3Sn wires were soldered directly to the current terminators and were never removed from the sample holders to avoid unnecessary damages prior to the experiments. Wire specifications and heat treatment schedules can be found in table 1. Additional information on experimental preparation can be found in [17].
Table 1. Wire specifications for Oxford and Hitachi samples.
| Strand manufacturer | Oxford | Hitachi |
|---|---|---|
| Wire ID | 9948-1 | HE-3733-2 |
| Technique | Internal tin | Bronze route |
| Strand diameter (mm) | 0.820 ± 0.03 | 0.820 ± 0.03 |
| Cu:non-Cu | 1.079 ± 0.03 | 1.00 ± 0.1 |
| Twist pitch (mm) | 17 15 ± 2 | |
| Heat treatment | Ramp up to 210 °C with 5 °C h−1 and hold for 50 h, ramp up to 340 °C with 5 °C h−1 and hold for 25 h, ramp up to 450 °C with 5 °C h−1 and hold for 25 h, ramp up to 575 °C with 5 °C h−1 and hold for 100 h, ramp up to 650 °C with 5 °C h−1 and hold for 100 h, ramp down at 5 °C h−1 to 500 °C and then at 25 °C h−1 | |
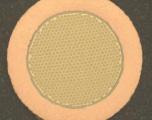
| Cross section |
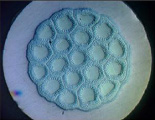 [24] [24] |
|
6.2. Critical current results
The critical current results from the pure bending experiments are presented in the figures 15 and 16. Figure 15 plots the critical current results versus bending strain for both the Hitachi and Oxford wires. Loading and recovery data are plotted together showing the overall electrical behavior for both wire types. Recovery refers to data taken after reaching the maximum bending state and are indicated by open symbols and dashed lines. Both wires follow a decreasing critical current trend as bending strain is increased. The Hitachi samples showed no appreciable permanent degradation, their critical current returned to its initial level after the bending load was removed. The Oxford samples were more prone to damage and showed significant permanent degradation when the bending load was removed from 1.25% strain. A likely cause of the critical current degradation might be fracturing of the Nb3Sn filaments on the tensile side which has been reported to be more severe in internal tin type wire [25–27]. In addition, the Oxford strands had a tendency to prematurely quench reducing the amount of data collected.
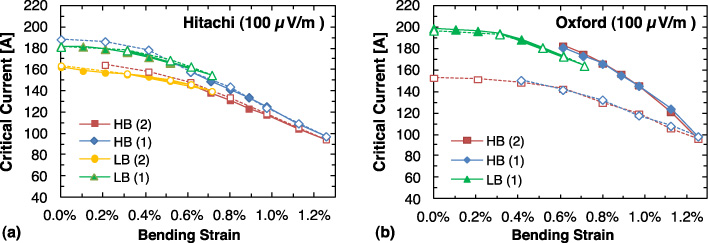
Figure 15. Critical current results from the new low bending (LB) and high bending (HB) sample holders. (a) Hitachi results showing smooth critical current behavior between both sample holders. (b) Oxford results showing a typical critical current trend including permanent degradation behavior. Two samples were mounted on each beam and are indicated by (1) and (2), top sample and bottom sample respectively. Open symbols with dashed lines indicate recovery data after reaching maximum bending.
Download figure:
Standard image High-resolution image
Figure 16. Normalized critical current results for Hitachi and Oxford strands. (a) Hitachi results showing reversible critical current behavior. (b) Oxford results showing permanent degradation after reaching maximum bending strain. Plot colors, symbols and notations are same as figure 15.
Download figure:
Standard image High-resolution imageThe most important finding from the experiments is the uniformity of the critical current degradation over the entire bending range. This uniformity is best illustrated in the normalized critical current plots of figure 16. The low bending data was normalized to the initially measured zero bending critical current while the high bending data was normalized to the projected zero bending critical current based on the initial critical current degradation at 0.6% bending strain. These normalized results allow the degradation behavior of different samples to be directly compared. For both wire types, the low and high bending results exhibit the same critical current reduction between 0.6% and 0.7% bending strain indicating the sample holders are creating equal strain states and are applying the same amount of bending to the Nb3Sn wire. These findings verify that the design improvements made to the new sample holders were successful in eliminating all critical current discrepancies between sample holders.
The normalized results show that at 1.25% bending strain the Hitachi strands experienced a critical current reduction around 40%, while the Oxford strands experienced around 55% reduction. Spatial periodic bending experiments at University of Twente experienced similar critical current degradations for analogous bending strains [8]. The main distinguishing behavior between the two wire types is a completely reversible critical current in the Hitachi wire and a 30% permanent degradation in the Oxford wire after reaching a maximum bending of 1.25%. The high bending Hitachi strands actually experienced an increase in critical current of almost 10% after returning from maximum bending. The enhanced critical current behavior has been previously observed in bronze route wires when cyclic bending was applied [28–30].
The n-value is a transport characteristic which describes the sharpness of the transition from a superconductive state to a resistive state. A larger n-value will have a steeper more rapid transition while a lower n-value will have a slower more gradual transition. The n-value results from the low and high bending Hitachi (HIT) and Oxford (OST) samples are presented in figures 17 and 18. A full cycle of loading and recovery data for each strand was presented. As in figure 15, open symbols with dotted lines represent recovery data after reaching maximum bending and correspond to the loading data shown as solid symbols and solid lines.
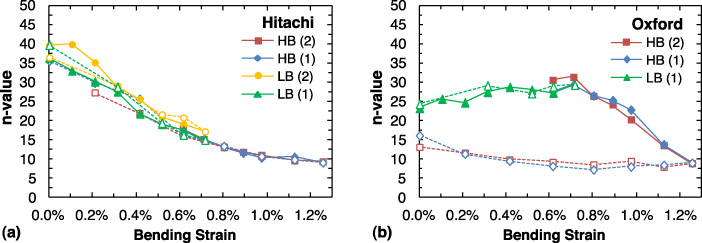
Figure 17. n-value results plotted versus applied bending strain from the low bending (LB) and high bending (HB) beams. (a) n-values for Hitachi strands indicating a completely reversible behavior. (b) n-values for Oxford strands showing irreversible degraded after reaching maximum bending. Plot colors, symbols and notations are same as figure 15.
Download figure:
Standard image High-resolution image
Figure 18. n-value results plotted versus normalized critical current indicating that the variations of n-value reflect the variations in critical current. (a) n-value results for Hitachi strands and (b) n-value results for Oxford strands. Normalized critical current was the same as figure 16. Plot colors, symbols and notations are same as figure 15.
Download figure:
Standard image High-resolution imageFigure 17 displays the n-value behavior of both wire types over the entire bending range. The n-value of the Hitachi strands was initially higher than the Oxford strands however, both wire types had final n-values of roughly 10 at 1.25% bending strain. The low and high bending Hitachi results indicate a gradual decrease in n-value as bending strain was increased. The Hitachi strands show a completely reversible behavior upon recovery after reaching their maximum applied bending. In comparison, the Oxford n-values behaved differently and showed two unique trends. First, the low bending Oxford data indicates a relatively unchanged n-value over its entire bending range up to 0.7% strain. This behavior may be linked to the premature quenching experienced in the low bending Oxford samples. Second, the high bending Oxford data has a more sever n-value degradation compared to Hitachi and in addition experiences a permanent reduction in n-value upon recovery from 1.25% strain. This permanent degradation can again be linked to damage of the superconducting filaments within the wire.
The n-value and the critical current are both transport characteristics of the superconducting wire which are sensitive to strain. Therefore, variations in n-value are generally reflected by variations in critical current. Figure 18 plots the n-value results for both wire types versus the normalized critical current data. The Hitachi plot indicates that the n-value initially decreases sharply for small changes in critical current and then becomes more gradual as critical current is reduced further. The Oxford plot shows a very different trend in which the n-value remains unchanged for small critical current reductions and then decreases linearly as critical current is degraded further. The recovery data show a reversible trend for Hitachi and a permanent reduction for the high bending Oxford strands.
6.3. Critical current comparison to prior experiments
The same bronze route Hitachi wire used in the preliminary sample holder experiments was also tested with the new sample holders, allowing for a direct comparison of critical current behavior. For consistency, the new tested wire was taken from the same spool provided by the manufacturer and underwent the same heat treatment process. The normalized critical current results for the new Hitachi strands are plotted in figure 19 alongside the preliminary critical current data presented in [19]. Only the initial loading data of each sample holder was plotted for clarity.

Figure 19. Normalized Hitachi critical current results from the new sample holders (2012) compared to the normalized Hitachi results from the preliminary sample holders (2011). Results plotted are for the initial loading of each sample holder. Tested strands were cut from the same spool of wire provided by the manufacturer and followed the same heat treatment process.
Download figure:
Standard image High-resolution imageThe critical current results for the new sample holders (2012) are shown as data points and indicate a consistent critical current degradation over the entire bending range. The preliminary high bending (HB) data from 2011 (solid line) matches the new high bending results very closely. This was an expected behavior considering both sample holders have similar designs with no channel walls. The preliminary low (LB) and medium bending (MB) data from 2011 (dashed lines) indicate a lower critical current trend than the new low bending sample holder above 0.5% bending strain. Since the new low bending sample holder has no channel walls, the comparison clearly proves that the bowing of the channel walls in the preliminary beams leads to earlier and more severe critical current degradations.
6.4. Reversed current test results
In addition to characterizing the critical current over the entire bending range, reversed current tests were also conducted at 15 T to identify any effect the electromagnetic load direction might have on the performance of the samples. A reversed current direction changes the Lorentz load from radially inward to radially outward. At a field of 15 T and a critical current of 200 A an electromagnetic load of 3.0 kN m−1 will be experienced.
Reversed current results for typical low and high bending strands are presented in figure 20. The reversed-outward data follows the same critical current trend as the normal-inward data. In addition, the reversed-outward results are at times slightly higher than the normal-inward data. Overall, the current and electromagnetic load directions do not have a significant influence on the critical current behavior of the Nb3Sn wire.

Figure 20. Critical current data from reversed current tests showing no major influence on critical current behavior of the wires. (a) Low bending and (b) high bending reversed current results for Hitachi (HIT) and Oxford (OST) wires. Reversed current produces a radially outward electromagnetic load on the wire.
Download figure:
Standard image High-resolution image6.5. Unloading results after cycling tests
The effects of cycling the bending strain up to its maximum and back down were investigated. The high bending samples were cycled up to 1.25% strain and back to zero four consecutive times and data was recorded upon the final unloading from maximum bending. Results for both wire types are shown in figure 21 which plots the unloading data after cycling on top of the critical current results from the initial loading sequence.
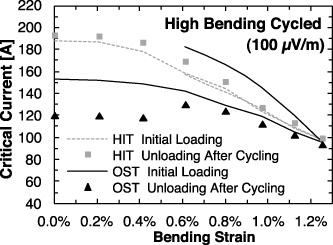
Figure 21. Critical current data upon unloading after cycling tests for high bending strands. Data are plotted along with the critical current results from the initial loading of the wire. Hitachi strands showed a slight increase in critical current after cycling while Oxford strands indicated additional permanent degradation.
Download figure:
Standard image High-resolution imageThe Hitachi wire data indicates that the critical current post cycling had the same trend as the original loading with a slight increase in critical current below 0.8% strain. The Oxford samples showed a noticeable degradation in critical current upon unloading after cycling. This degradation was likely caused by additional filament breakage in the samples during the cyclic bending.
7. Integrated model analysis
Critical current behavior of Nb3Sn strands under pure bending can be better understood using empirical models. The integrated model developed by Takayasu et al [3] considers the combined effects of four physical parameters: neutral axis shift, current transfer length, filament breakage and uniaxial strain release. Neutral axis shift can occur due to yielding of the strand matrix under bending [31]. The current transfer length is associated with the transverse resistance of the matrix material [32]. Filament breakage is the mechanical fracturing of filaments on the tensile side [25–27]. Uniaxial strain release describes an alleviation of the thermally induced precompressive strain from cyclic bending [28–30].
The pure bending behavior of a typical high bending Nb3Sn wire from each manufacturer was evaluated using the integrated model. The magnitudes of the fitting parameters varied with the amount of applied bending and were determined iteratively in the same method as presented in [3]. The final parameter curves help to explain the characteristic trends of the experimental critical current data. Table 2 provides the scaling equation constants used in the curve fittings of both wire types [33, 34].
Table 2. Scaling equation constants for Oxford and Hitachi wire.
| Strand | Oxford | Hitachi |
|---|---|---|
| Bc20max (T) | 32.84 | 34.14 |
| Tc0max (K) | 16.55 | 16.55 |
| C (A T) | 19 850 | 16 583 |
| ε0A | 0.002 57 | 0.002 57 |
| εmax | −0.000 66 | −0.000 66 |
| Ca1 | 44.89 | 44.89 |
| Ca2 | 5.61 | 5.61 |
7.1. Hitachi wire
The curve fitting results for a characteristic high bending Hitachi strand are shown in figure 22. The critical current data is plotted against the peak bending strain which is the maximum strain that the filaments experience within the sample. The test results taken during loading of the sample are shown by solid circles while the asterisks represent the recovery data taken upon unloading after the maximum bending was reached. The measured data lies between the perfect current transfer case (dotted line) and the no current transfer case (dashed line). The best analytical fit to the experimental loading data (solid thick line) and recovery data (solid thin line) were generated from the parameter curves shown in figure 23.
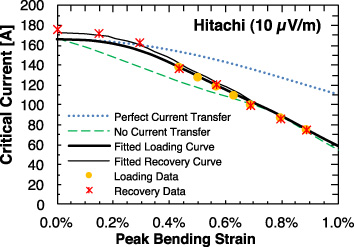
Figure 22. Curve fitting of the Hitachi high bending critical current results. Fits were obtained from an integrated model incorporating the neutral axis shift, current transfer length, filament breakage and uniaxial strain release as fitting parameters. The experimental loading and unloading data are shown by solid circles and asterisks respectively. The best fit to the loading and recovery data are represented by the solid thick and thin lines respectively. The upper dotted and lower dashed lines are the perfect current transfer and no current transfer models.
Download figure:
Standard image High-resolution image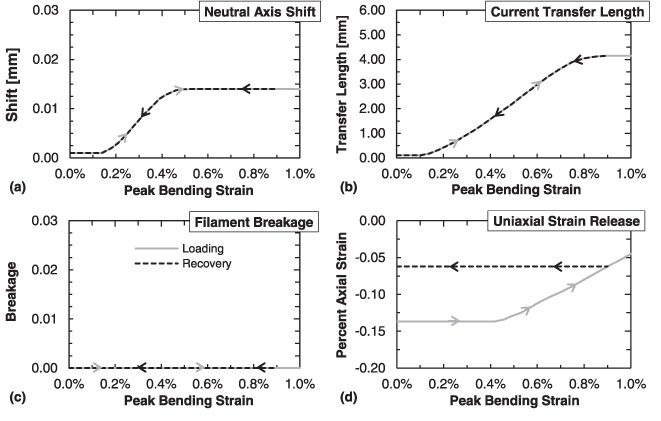
Figure 23. Fitting parameter curves used in the modeling of the Hitachi strands. The light solid line represents the parameter curve used to fit the loading data while the dark dashed line represents the curve used to fit the recovery data. Recovery curves start at the maximum bending state, 0.90% peak bending strain.
Download figure:
Standard image High-resolution imageThe experimental critical current data is a good fit to the perfect current transfer model at low bending while the no current transfer curve is a good fit at high bending. The transition between current transfer models is reflected by a rise in the current transfer length over the bending range, figure 23(b). The slight increase in the critical current upon unloading from maximum bending can be explained by an alleviation of the thermal precompressive strain due to tensile effects at high bending, figure 23(d). The completely reversible nature of the critical current implies no filament breakage in the wire, figure 23(c). The steady critical current values at small bending before large degradations occur can be described by the neutral axis shift, figure 23(a).
7.2. Oxford wire
The integrated model was also used to fit the experimental data from the Oxford wire. The curve fitting results for a typical high bending Oxford strand are shown in figure 24 and the corresponding parameter curves for the fitting are displayed in figure 25.

Figure 24. Curve fitting of Oxford high bending critical current results. Plot colors, symbols, notations and descriptions are same as figure 22.
Download figure:
Standard image High-resolution image
Figure 25. Parameter curves used in the modeling of the Oxford strands. Plot colors, symbols, notations and descriptions are same as figure 23.
Download figure:
Standard image High-resolution image
The large permanent degradation in the Oxford wire that was experienced after reaching maximum bending can be directly described by a sharp increase in filament breakage after 0.5% bending, figure 25(c). The permanent reduction in critical current was mirrored by a permanent degradation of n-value which can be characterized by a non-reversible current transfer length, figure 25(b). No increase in critical current upon unloading was explained by a constant uniaxial strain release over the entire bending range, figure 25(d). The neutral axis shift curve from the Hitachi modeling was found acceptable for the Oxford samples due to the similarities of the two wires, figure 25(a).
8. Conclusions
The sample holders of a variable bending-strain device were optimized and used to characterize the critical current of various Nb3Sn strands over a wide bending range up to a 1.25% strain. Three preliminary sample holders (low, medium and high bending) were constructed to cover the bending range. Preliminary experiments were done on 4 ITER-type Nb3Sn wires, including two internal tin and two bronze route wires. The analysis of the results indicated a sharper critical current degradation in the low and medium bending sample holders.
To identify a cause for the critical current discrepancy found in the preliminary sample holders, an in-depth finite element investigation was performed. The numerical analysis for the first time incorporated a strand and an electromagnetic load into the sample holder model allowing for the true strain state of the tested wire to be determined. The investigation discovered that the channel walls in the preliminary low and medium bending sample holders had an undesirable influence on the strain distribution of the wire which led to higher critical current degradations.
Based on the findings from the analysis, the preliminary three sample holders were replaced by two improved sample holders, low and high bending, able to cover the same range of bending strains up to 1.25%. The new beams were designed devoid of channel walls and were optimized using a parametric study to produce the most uniform pure bending strain state possible. The error from pure bending for the new sample holders was quantified and shown to be within an acceptable error threshold of 0.06%.
The new sample holders were used to characterize both bronze route (Hitachi) and internal tin (Oxford) type Nb3Sn wires under pure bending. The overall experimental results showed a consistent critical current trend in both sample holders with no discrepancy. The tested wires from both manufacturers were found to exhibit a critical current degradation of between 40 and 55% at the maximum bending strain of 1.25%. The Oxford samples experienced around 30% permanent degradation while the Hitachi samples were found to be completely reversible.
The critical current data was evaluated using a previously developed integrated model which was used to explain the critical current behavior by means of the four physical parameters; neutral axis shift, current transfer length, filament breakage and uniaxial strain release. The permanent degradation of the Oxford samples was explained by a sharp increase in filament breakage at high bending. The slight increase of the critical current in the Hitachi samples after unloading from maximum bending was accounted for by an alleviation of the uniaxial thermal precompressive strain.
Acknowledgments
The authors would like to thank N Martovetsky, ITER Project Office, ORNL, and K Miyashita from Hitachi Cable, Ltd for supplying the tested wires. This work was supported by the US Department of Energy (DOE). A portion of this work was performed at the National High Magnetic Field Laboratory, Florida State University, which is supported by NSF and DOE.