
Abstract
Bi2Sr2CaCu2Ox(Bi2212)/Ag multifilamentary wires are manufactured via the powder-in-tube process using oxide powders. After deformation, the wires undergo a partial-melt process, resulting in a complex, heterogeneous microstructure containing multiple secondary phases and porosity, limiting the wires' electrical and mechanical performance. Here, an alternative approach using the direct conversion of metallic precursors (MPs) to Bi2212 is studied. The formation of metallic precursor powders via a mechanical alloy is discussed. The MP powder is then converted to superconducting Bi2212 through a simple two-step heat treatment. By introducing oxygen at a temperature at which Bi2212 is in a stable phase, and holding at an elevated temperature for a sufficient time, the metallic precursors are oxidized and transformed into Bi2212. Several factors that impact the formation and growth of Bi2212 grains are discussed. Peak temperature, holding time and heating rate are shown to affect the MP →Bi2212 conversion, the Bi2201 content and the Bi2212 morphology and density. It is found that Bi2Sr2CuOy (Bi2201) can be the only phase impurity after heat treatment, which is quite different from what is observed in partial-melt processed wires derived from oxide precursors. Lastly, the microstructure at the sample/silver interface suggests larger size and preferred orientation of Bi2212 grains with the aid of a silver surface. Implications for MP Bi2212 wires are discussed.
Export citation and abstract BibTeX RIS
List of abbreviations
| Bi2201 | Bi2Sr2CuOy |
| Bi2212 | Bi2Sr2CaCu2Ox |
| Bi2223 | Bi2Sr2Ca2Cu3Oz |
| MPs | Metallic precursors |
| Jc | Critical current density |
| OPIT | Oxide-powder-in-tube |
| PMP | Partial-melt processing |
| CF | Copper-free |
| AECs | Alkaline earth cuprates |
| To x | Oxidation temperature |
| t1 | Dwelling time at Tox |
| Tp | Peak temperature |
| tp | Dwelling time at Tp |
| R1 | Heating rate from Tox toTp |
| FC | Furnace cooling |
| Tc | Critical temperature |
| ΔTc | Tc transition width |
| γ | XRD intensity ratio |
| f | The fraction of Bi2201 intergrowths in Bi2212 grains |
1. Introduction
The upper critical fields of low temperature superconductors such as NbTi and Nb3Sn limit the maximum magnetic fields that can be generated to about 10.5 and 20 T [1–3]. To meet the requirements for future applications such as a high energy large hadron collider, a muon collider and high field nuclear magnetic resonance magnets, a superconducting conductor capable of generating magnetic fields above 20 T is needed. One option is Bi2Sr2CaCu2Ox (Bi2212) round wire, which has a high critical current density (Jc) in magnetic fields of at least 45 T [4]. As the only high field superconductor available as an isotropic round wire, Bi2212 wire sheathed in Ag/Ag-alloy is of particular interest [4–7].
Currently, Bi2Sr2CaCu2Ox/Ag wires are manufactured via the oxide-powder-in-tube (OPIT) route by filling Ag-tubes with oxide precursors, deforming into wire, restacking (sometimes twice) and heat treating using partial-melt processing (PMP) or variants thereof [8–14]. Yet, the oxide precursor route has many shortcomings. One significant challenge is in low tap density, typically ranging from 1 to 2.5 g cm−3, whereas the density of Bi2Sr2CaCu2Ox is 6.45 g cm−3. Thus, starting from oxide precursors, it is not possible to obtain a 100% dense green wire. During PMP, bubbles and voids form and evolve, greatly reducing the transport Jc of the wire [15, 16]. Another challenge related to the use of oxide precursors is that during PMP the Bi2212 powder melts incongruently, forming several non-superconducting crystalline phases and a liquid phase [9, 17]. During subsequent cooling, these non-superconducting phases cannot convert completely to Bi2212, resulting in phase impurities, including Bi2Sr2CuOx (Bi2201), a copper-free (CF) phase and alkaline earth cuprates (AECs) [18, 19]. Furthermore, for multifilamentary OPIT Bi2212 wires, high Jc depends on interfilamentary bridging resulting from resolidification [20]. The Bi2212 bridges are the essential links that allow superconducting electrons to meander around porosity and non-superconducting phases. Due to bridging, however, the effective filament size from a magnetization perspective is the wire diameter, which may be problematic for some applications. A true multifilamentary wire, without bridges, porosity or non-superconducting phases, is sought.
An alternative to the oxide precursor route with the potential to address these issues is metallic precursors (MPs) that are not oxidized until after wire deformation. Previously, MPs were studied for Bi2Sr2Ca2Cu3Oz (Bi2223) powder-in-tube (PIT) tapes. While MP Bi2223 wires achieved a certain level of success, ultimately an OPIT process replaced the MP Bi2223 approach. There are key differences between Bi2212 wires and Bi2223 tapes, indicating that the MP route may be more suitable for Bi2212 than for Bi2223. One of the most fundamental differences between Bi2212 and Bi2223 tapes is the stability of the superconducting phase. The phase equilibria of the quaternary system Bi2O3–SrO–CaO–CuO shows that the Bi2212 phase is thermodynamically stable over a wide temperature range and coexists with most of the compounds in this system. In contrast, the Bi2223 phase is stable within a narrow temperature range and exhibits phase equilibria with only a few of the compounds in the system [21]. Pb-free Bi2223 single crystals and pure Bi2223 powders are difficult to obtain, and most Bi2223 tape research and development has focused on Pb-doped stoichiometries [22–25]. In contrast, the stable phase field for Bi2212 covers a large range of Bi, Sr and Ca stoichiometries and a broad temperature space [26–30]. Thus, the direct conversion from metallic precursors to Bi2212 is likely to be straightforward and faster than the conversion to Bi2223. Rapid, direct conversion will also minimize the interdiffusion of Bi2212 cations with the Ag sheath [31]. Lastly, the Pilling–Bedworth ratios for Bi2212 and Bi2223 are 1.112 and 1.294, respectively, indicating that during the metal-to-ceramic conversion, the net expansion of Bi2212 is less than half of that of Bi2223.
Another potential advantage of the MP route is the absence of carbon. The presence of carbon and carbon contamination during oxide precursor processing has serious consequences due to the evolution of CO2 during PMP, and as a result oxide powder manufacturers focus significant attention on minimizing the carbon content. The impact of carbon content on heat-treated wires has been studied by varying the calcination conditions before packing the powders into Ag tubes. Jc was greatly reduced by the presence of carbon, particularly in the form of carbonates. High carbon residue results in poor grain connectivity and increased porosity [32–34].
This work focuses on the preparation of MP powders and their conversion to superconducting oxide Bi2212. Solid-state sintering, including the crucial step of the direct oxidation of metallic precursors, is studied using pressed pellets. Heat-treated pellets are studied extensively, including thermal, chemical, microstructural and magnetic characterizations.
2. Experimental approach
2.1. Sample preparation
The starting metals are 0.074 mm bismuth powders, 0.5−1.5 μm copper powders, 19 mm strontium granules and 1 mm calcium granules, all with high purity (≥99.5%). For one powder batch, 0.5−1.0 μm silver powder (purity of 99.9%) is added as well. Before mixing, the Sr granules are charged within a Spex zirconia milling vial and ball-milled for 2 h using a Spex 8000 to reduce the particle size to 0.5 mm.
The handling of MPs requires particular caution because Ca and Sr are highly reactive with O2 and water. Thus, all the powder handling requires a carbon-free, oxygen-free, dry environment. Here, the weighing, storing and milling of MPs are under an Ar atmosphere.
According to the phase diagram [35, 36], the central axes of the single-phase region point to a Bi stoichiometry of 2.18 in the temperature range of 820–870 °C in air. As the temperature decreases, the single-phase region becomes large. For the Bi2212 phase within the composition range Bi2.18Sr3−yCayCu2O8+d (y = 0.4−2.0), the single phase extends furthest when y = 1.10 and decreases slightly as y increases [26]. Here, the starting materials are mixed with a cation ratio of Bi:Sr:Ca:Cu of 2.18:1.90:1.10:2.00, a stoichiometry in the middle of the single-phase region. The endpoints of the Bi2212 solid solution region remain almost unchanged from 100% O2 to 1.0% O2. Therefore, this stoichiometry remains in the center of the single-phase region as the oxygen partial pressure varies from 100% to 1.0% [36].
Two batches of powders are milled with the same Bi:Sr:Ca:Cu ratio; in one batch 5 wt% Ag is added. After weighing and mixing all the powders in a high purity (<1 ppm oxygen) argon atmosphere in a glovebox, they are charged again within a Spex zirconia milling vial and mechanically alloyed for 20 h. After milling, the powders are stored in glass vials in an argon atmosphere. Table 1 lists the cation ratios of Bi, Sr, Ca, Cu and weight percentage of Ag as detected by chemical analysis after milling but before heat treatment. Batch I was milled continuously while batch II was milled with intermittent scraping. The cation ratios and Ag content deviate from the starting stoichiometry of Bi2.18:Sr1.90:Ca1.10:Cu2.00, which may be due to some elements sticking preferentially to the milling vial and balls; intermittent scraping of batch II was used to reduce this effect.
Table 1. Chemical analysis of the metallic precursors after milling.
| Sample | Bi | Sr | Ca | Cu | Ag (wt%) |
|---|---|---|---|---|---|
| Starting mixture (pre-milling) | 2.18 | 1.90 | 1.10 | 2.00 | — |
| Batch I (milled and unreacted) | 2.22 | 1.82 | 1.15 | 2.00 | 0 |
| Batch II (milled and unreacted) | 2.19 | 1.87 | 1.13 | 2.00 | 1.94 |
Pellets with a 6 mm diameter, 1.0–1.2 mm thickness and 0.18–0.20 g mass are made from the milled powders; three pellets are made from batch I (I-1–3) and six from batch II (II-1–6). A reference pellet is also made from oxide precursor (as received Nexans Bi2212 granules). All pellets are pressed using a uniaxial press at a pressure of up to 2 GPa and a density of up to 5.30 g cm−3. The milled metallic precursors are filled and sealed into a 6 mm die in a glovebox and then the die is taken out for pressing.
2.2. Heat treatment
To avoid intense reactions between the metallic precursors and oxygen, and to ensure that the starting stoichiometry is in the single-phase region, a series of two-step heat treatments are carried out under 10% O2 (Ar balance) atmosphere with different temperatures and times in a quartz tube furnace. Figure 1 shows a schematic drawing of a typical two-step heat treatment profile. For each heat treatment, the pellet sample is taken from the glovebox just before heat treatment and put on a silver foil in an alumina boat. The furnace is then sealed, vacuumed and refilled with pure Ar repeatedly to ensure that there is no oxygen in the quartz tube before heat treatment.

Figure 1. Schematic drawing of the two-step heat treatment temperature–time profile.
Download figure:
Standard image High-resolution imageHeat treatments include two dwelling steps, one at Tox and the other at Tp. Step 1 is used to directly oxidize the metallic precursors at Tox instead of Tp, avoiding melting as there are considerable amounts of Bi and Sr, with melting points of 271.4 and 768.8 °C, in the green pellets. Hence, early oxidation, before the temperature reaches Tp, is needed to prevent elemental diffusion within a liquid phase which might harm the final homogeneity of the pellet. Moreover, Bi2212 crystallization at 630 °C in air from glass oxide precursors has been reported [26]. Hence, two values of Tox are studied, 600 and 650 °C. Compared to conventional PMP in 100% oxygen, the reduced oxygen partial pressure used here reduces the Bi2212 melting temperature to around 870 °C [37]. Thus, to avoid partial melting during heat treatment, Tp is studied in the range 800–855 °C.
After pumping, the sealed furnace is heated to Tox at a rate of 300 °C h−1 in flowing Ar and held for 10 min to allow the temperature to stabilize, after which a flow of 10% O2 mixed gas is introduced. After holding at Tox for a specific amount of time, t1, the system is heated to Tp at a rate of R1 and held for tp. Finally, the system is cooled to room temperature at a rate of 100 °C h−1 or furnace cooled (FC) (∼400 °C h−1). Detailed heat treatment parameters are listed in table 2.
Table 2. Detailed heat treatment parameters for each sample.
| Sample | Tox (°C) | t1 (h) | Tp (°C) | tp (h) | R1 (°C h−1) | Cooling rate (°C h−1) |
|---|---|---|---|---|---|---|
| I-1 | 650 | 2 | 800 | 2 | 200 | 100 |
| I-2 | 600 | 2 | 830 | 2 | 200 | 100 |
| I-3 | 650 | 2 | 830 | 2 | 200 | 100 |
| II-1 | 650 | 0 | 845 | 16 | 200 | FC |
| II-2 | 650 | 0 | 845 | 48 | 200 | FC |
| II-3 | 650 | 0 | 855 | 16 | 200 | FC |
| II-4 | 650 | 0 | 855 | 48 | 200 | FC |
| II-5 | 650 | 0 | 855 | 16 | 60 | FC |
| II-6 | 650 | 0 | 855 | 48 | 60 | FC |
2.3. Characterization
Inductive-coupled-plasma emission spectroscopy (ICP-ES) (Perkin Elmer 2000 Dual View spectrometer) is used to determine the stoichiometry of milled batches (table 1). Samples are weighed on Teflon microwave digest sample holders to the nearest 10−5 g. 5 ml of 4:1 ([conc. HCl]: [conc. HNO3]) is then added to each sample. The solution then sits for 48 h.
A JEOL 10LA scanning electron microscope (SEM) with energy dispersive spectrometry (EDS) is used to examine the homogeneity of the elemental distribution of milled batches. Hitachi S3200 and TM3000 SEMs are used to investigate the microstructures of the heat-treated samples.
An FEI Titan 80-300 probe aberration corrected scanning transmission electron microscope (STEM) with SUPER X EDS is used to characterize the Bi2201 intergrowths of a heat-treated sample.
A Rigaku Smartlab x-ray diffractometer (XRD) is used for phase analysis. The measurements are carried out with a Cu Kα source over a 2θ range of 5°–75°, using 40 kV and 44 mA. To avoid oxidation of the metallic precursors during handling, a thin mineral oil film is coated on the pellet surface in the glovebox before removal for analysis. For heat-treated samples, the pellets are pulverized into fine powders before scanning.
The superconducting critical temperature, Tc, is measured in a SQUID magnetometer (Quantum Design MPMS-5S) via magnetization versus temperature measurements. The samples are cooled to 4.2 K in zero field and measured in a 100 Oe applied field during warming.
Differential thermal analysis (DTA) (Perkin Elmer STA 6000) is used to study the melting behavior of the heat-treated samples to investigate the phase purity. All the tested samples are 40 ± 0.002 mg and are heated to 980 °C at 10 K min−1 in flowing 10% O2 (20 ml min−1).
3. Results
3.1. MP powder characterization
Figure 2 shows an SEM micrograph and corresponding EDS maps of the elemental distributions of Bi, Sr, Ca and Cu in batch I before heat treatment. A homogeneous distribution of elements is observed after milling. Similar homogeneity is observed in batch II. Figure 3 shows the XRD results for both batches after milling but before heat treatment. Note that in addition to elemental metals (Bi, Cu and Sr), some alloys formed during milling (Ca–Cu and/or Bi–Sr).
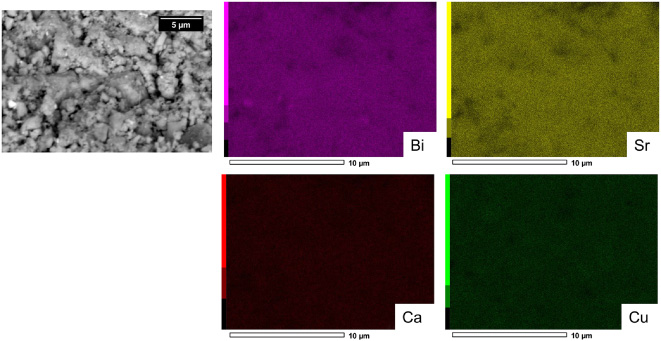
Figure 2. SEM micrograph and EDS maps of batch I after milling but before heat treatment.
Download figure:
Standard image High-resolution image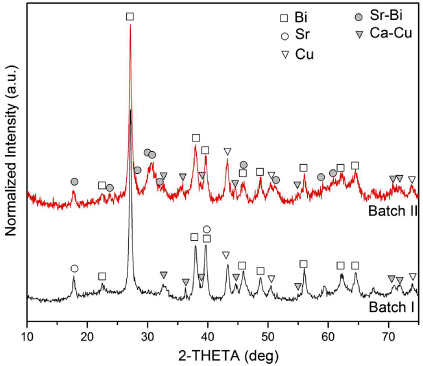
Figure 3. XRD results for batches I and II after milling but before heat treatment.
Download figure:
Standard image High-resolution image3.2. Heat-treated pellets
Figures 4 and 5 show the magnetic properties of heat-treated samples measured by SQUID. Figure 4 shows the absolute magnetic moment versus temperature for samples from batches I and II. All heat-treated samples show a superconducting transition in the range of 69–81 K, and only sample I-1 has a lower magnetic moment at 4.2 K than Nexans granules. Figure 5 shows the same data normalized by reference values at 4.2 K. Only sample I-1 exhibits a shallower transition than Nexans granules. The Tcs of samples I-1–3 (figure 5(a)) are 69.0 K, 77.5 K and 79.0 K, respectively, and the Tcs of samples II-1–4 are 79.0 K, 79.5 K, 80.5 K and 81.0 K, respectively (figure 5(b)). The Nexans granule sample has a Tc of 67.5 K.
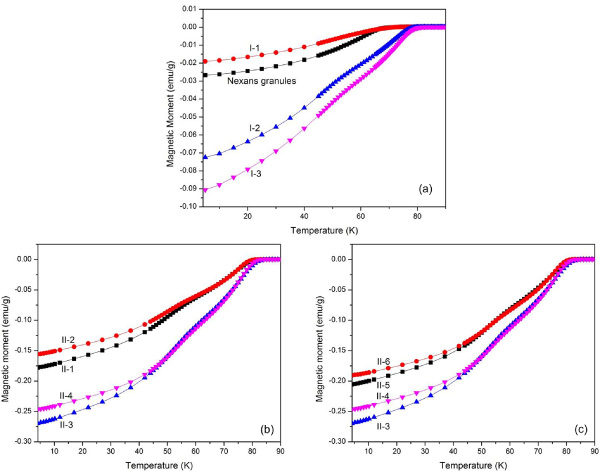
Figure 4. Magnetization versus temperature of heat-treated samples and a reference Nexans granule sample. Samples from (a) batch I and the Nexans granule sample, (b) batch II to compare the effects of Tp and tp, and (c) batch II to compare the effect of R1. Note that (a) has a much smaller range of moment than (b) and (c).
Download figure:
Standard image High-resolution image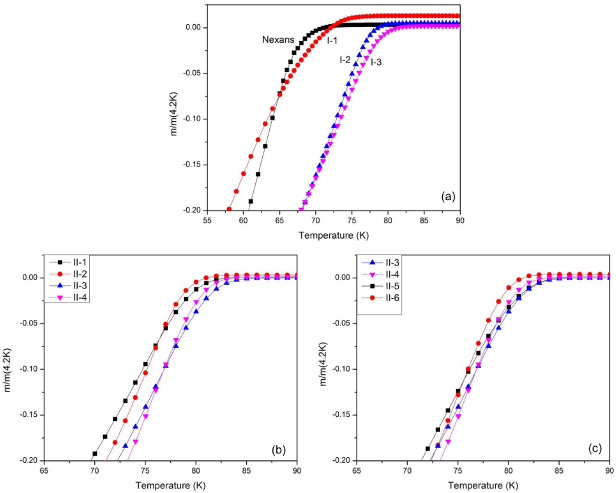
Figure 5. Normalized magnetization versus temperature. Samples from (a) batch I and the Nexans granule sample, (b) batch II to compare the effects of Tp and tp, and (c) batch II to compare the effect of R1.
Download figure:
Standard image High-resolution imageFigure 6 shows the XRD patterns for three heat-treated samples, I-3, II-1 and II-4; the major peaks of each phase are indexed. XRD results (not shown) from batch I indicate that all samples contain Bi2212, Bi2201 and Cu-free phase. In contrast, for batch II, only sample II-1 contains Cu-free phase whereas the others contain only Bi2201 and Bi2212. Thus, the XRD patterns in figure 6 are indicative of all samples. Figure 7 displays enlarged sections for 2θ between 21° and 24°, showing the relative intensity of the 006 (Bi2201) and 008 (Bi2212) peaks for different samples from batch II.
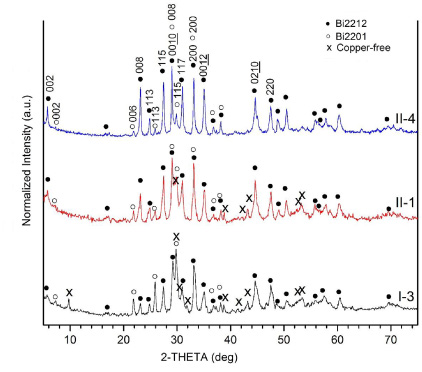
Figure 6. XRD results for heat-treated samples I-3, II-1 and II-4.
Download figure:
Standard image High-resolution image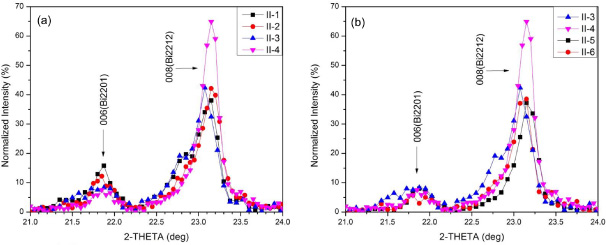
Figure 7. XRD results, focusing on the Bi2201 006 and Bi2212 008 peaks, to compare (a) the effects of Tp and tp, (b) the effect of R1.
Download figure:
Standard image High-resolution imageDTA curves of different heat-treated samples and Nexans granules are shown in figure 8. Additional peaks around the main melting peak are indicated by arrows. The melting onsets of samples II-1–6 are all 876 ± 1 °C. Figure 8(a) compares samples II-1–4 to show the effects of Tp and tp while (b) compares samples II-3–6 to show the effect of R1. The peak width for the Nexans granules is much wider than that for the converted metallic precursor samples. In (a), for samples II-1–3 and Nexans granules, there are additional peak(s) around the main melting peak, suggesting multiple melting events. There is no observable additional peak for sample II-4. In (b) there are also additional peaks around the main melting peak for samples with a low heating rate, i.e. samples II-5 and II-6.

Figure 8. DTA curves showing melting peaks to compare (a) the effects of Tp and tp, (b) the effect of R1.
Download figure:
Standard image High-resolution imageFigure 9 shows top surface SEM images of samples II-1–4. By increasing Tp from 845 to 855 °C, the grain size increases from approximately 10−15 μm to more than 20−25 μm. By increasing tp from 16 ((a) and (c)) to 48 h ((b) and (d)), the grain size increases, but the effect is less dramatic than temperature. Figure 10 shows cross-sectional SEM images of polished samples II-3 and II-4. Closely stacked Bi2212 grains with an average size of 25 μm are formed when Tp reaches 855 °C. Porosity exists between the aligned grains in sample II-3 and is reduced in sample II-4. Figure 11 shows the microstructure at the pellet/Ag interface of samples II-1 and II-2. Comparing the images from the tops of these samples with those at the Ag interface, the Bi2212 grains at the Ag interface are much larger than those at the top and are well connected.
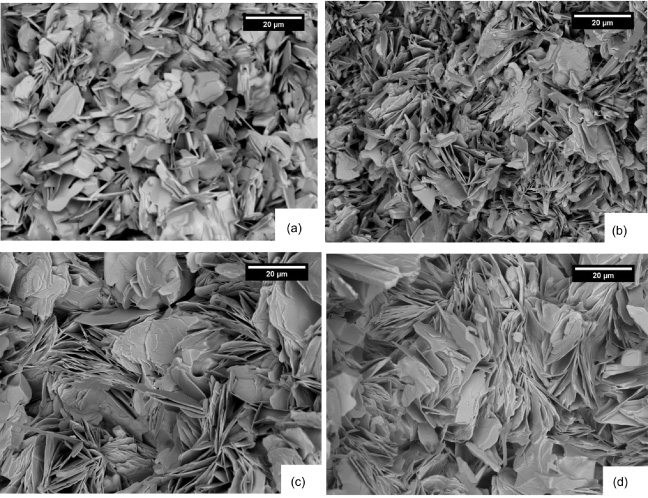
Figure 9. SEM images of the top surfaces of heat-treated samples. (a) II-1, (b) II-2, (c) II-3, (d) II-4.
Download figure:
Standard image High-resolution image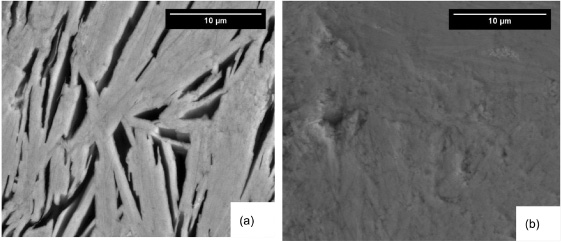
Figure 10. Cross-sectional SEM images of polished samples (a) II-3 and (b) II-4.
Download figure:
Standard image High-resolution image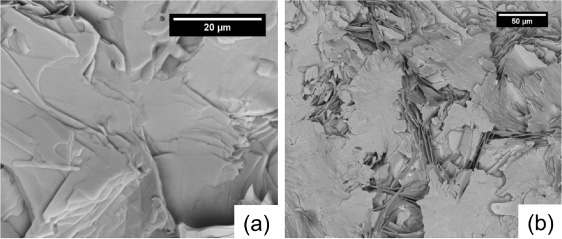
Figure 11. SEM images of the pellet/Ag interface of samples (a) II-1 and (b) II-2.
Download figure:
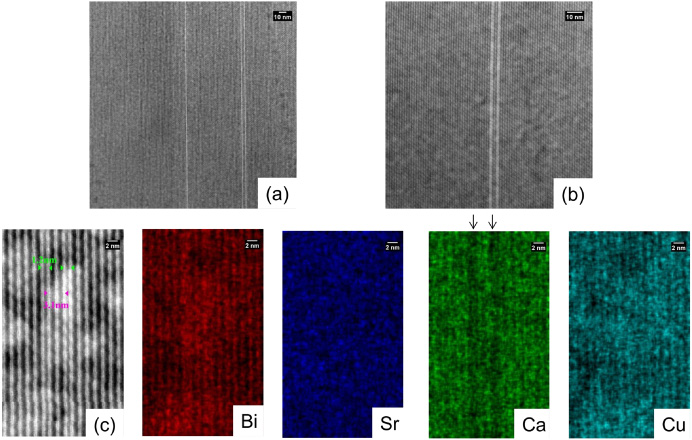
Standard image High-resolution imageFigure 12 shows STEM images of sample II-4. Bi2212 grains with Bi2201 half-cell intergrowths are seen. With increasing magnification, it is clear that each bright line in (a) and (b) is a half unit cell of Bi2201 with a 1.2 nm spacing. In (c), one Bi2212 unit cell with a 3.1 nm spacing is seen between the two Bi2201 half-cells. EDS mapping confirms that the two bright lines in the STEM images are Ca-deficient. No large Bi2201 grains are observed in this sample.
Figure 12. (a), (b) STEM images of Bi2212 grains from sample II-4 with Bi2201 intergrowths and (c) EDS maps showing the Bi2201 half-cell intergrowths.
Download figure:
Standard image High-resolution image
Table 3 shows the XRD intensity ratio γ ( ) of the 008 and
  peaks of the Bi2212 phase for six samples. The γ values are used to calculate the fraction of Bi2201 intergrowths in the Bi2212 grains (f) based on the model developed by Rikel et al [38, 39]; these are also listed in table 3.
Table 3. Intensity ratio γ and fraction f of Bi2201 intergrowth in Bi2212 grains.
| Sample | II-1 | II-2 | II-3 | II-4 | II-5 | II-6 |
|---|---|---|---|---|---|---|
| γ | 53 ± 1 | 52 ± 1 | 53 ± 1 | 73 ± 1 | 49 ± 1 | 50 ± 1 |
| f (%) | 11 ± 3 | 12 ± 3 | 11 ± 2 | 5 ± 2 | 14 ± 4 | 13 ± 4 |
4. Discussion
4.1. Properties of metallic precursors
The XRD results for the milled precursors in figure 3 show a combination of elemental metals (Bi and Cu) and metal alloys. A Ca–Cu alloy is common to both batches, whereas batch II also shows a Sr–Bi alloy which might be a result of the intermittent scraping giving a more homogeneous mixing of powders. The chemical analysis in table 1 shows that the result for the cation ratios in batch II is closer to the nominal stoichiometry of the starting powders, indicating that Sr sticks preferentially to the mixing media and that the intermittent scraping is beneficial.
The metal alloys formed during milling may be a source of impurities upon oxidation, such as copper-free phases in samples I-1–4 and II-1, as shown in figure 6. As there is no detectable copper-free phase or other non-superconducting phases in samples II-2–6, any alloys formed during milling are reactive and not stable during heat treatment.
4.2. Effects of the heat treatment parameters Tp and tp
Magnetic measurements of the three batch I samples indicate that a higher peak temperature yields a larger magnetic response, indicative of enhanced Bi2212 formation. Tp is either 800 or 830 °C, which is 80 or 50 °C below the Bi2212 melting temperature in 10% O2. The reactions of oxidized powders were not complete and a considerable amount of Cu-free phase and Bi2201 phase was found in heat-treated samples. This is probably due to the very low diffusion rate of cations and the high activation energy required to form Bi2212 via solid-state reactions [40, 41]. The activation energy of the transformation from Bi2201 to Bi2212 in the solid state, without the aid of liquid, is 3.0 to 6.7 times larger than with partial-melt processing. Kinetic studies of the Bi–Sr–Ca–Cu–O phases also imply a diffusion controlled transformation [41]. Thus, the non-superconducting phases that formed in the early stages of the heat treatments are not fully converted to Bi2212 by diffusion at low Tp. With Tp well below the melt temperature, the phase transformation is limited. Note that increased Tp also increases Tc, consistent with results reported by others [26, 42]. The transition width ΔTc of sample I-1 is 5–6 K while those for samples I-2 and I-3 are within 2 K, indicating increased oxygen homogeneity in samples I-2 and I-3 [43]. This also confirms the more efficient diffusion among grains due to the increase in Tp.
Based on the batch I results, batch II studies focused on higher Tp (845 and 855 °C) and longer tp (16 and 48 h). Samples II-1–4 were heated from 650 °C to Tp at 200 °C h−1. Magnetization measurements show that the samples with higher Tp (II-3 and II-4) have approximately 35% larger magnetization than those with lower Tp (II-1 and II-2). Furthermore, the magnetic results show that longer tp results in an 8%–12% decrease in magnetic moment at 4.2 K. The Tc results indicate that for Tps of 845 and 855 °C, the influence of increasing Tp on Tc is small. Also, the Tcs of samples II-1–4 are all close to 80 K, with oxygen content × close to 8.0 [44]. The transition widths ΔTc of these four samples are within 1 K, indicating a more homogeneous distribution of oxygen content with increased Tp [43].
Figure 7 shows the relative intensity of the 006 (Bi2201) and 008 (Bi2212) peaks as a function of Tp and tp. With increasing Tp and tp, the 006 (Bi2201) peak decreases and the 008 (Bi2212) peak increases. The XRD results show that for batch II, only sample II-1, which was heat-treated with lower Tp = 845 °C and shorter tp = 16 h, has Cu-free phases, while the others have only Bi2201 and Bi2212 phases. There is no obvious peak for the ordered 4413 phase (an intermediate phase of mixed Bi2212 and Bi2201) as reported by others [39, 45, 46].
Rikel et al developed a model that correlates the Bi2201 intergrowth fraction in Bi2212 with the intensity ratio γ () of the 008 and peaks of the Bi2212 phase [38, 39]. According to this model, for a Bi2212 single crystal that contains a fraction f of randomly distributed Bi2201 intergrowths, the average value 〈f(1 − f)〉 is inversely related to the intensity ratio γ. If f < 0.5, the average value 〈f(1 − f)〉 increases monotonically with increasing f. Thus, for Bi2201 intergrowth f < 50%, less Bi2201 intergrowth content should result in larger γ. Intensity ratio γ and f-values for samples II-1–6 are listed in table 3. For samples II-1–4, γ ranges from 53–73%, for which, according to the correlation map in [39], the Bi2201 intergrowth fraction f ranges from 5% for II-4 to 11% for II-2. These values are similar to what Heeb et al showed previously for a sample annealed at 850 °C for more than 80 h [47]; however, here the annealing was for only 48 h. Therefore, with further increase in tp, the fraction of Bi2201 may be reduced further [48]. Furthermore, the f-values here are much less than the average values of a PMP Bi2212/Ag conductor, which range from 6.4% to 35%, explaining the absence of any observable 4413 phase peak. In addition, only a low content of Bi2201 half-cell intergrowths is observed in sample II-4 under STEM, indicating that large Bi2201 grains either do not form or are converted to Bi2212 with higher Tp and longer tp.
The SEM images in figure 9 show that by increasing Tp from 845 to 855 °C, the grain size increases from 10−15 μm to more than 20−25 μm, a result of increased growth rate at elevated temperature. Closed-stacked Bi2212 grains are found when Tp reaches 855 °C (figures 9(c) and (d)). Cross-sectional images for sample II-3 and 4 give a clearer view of layered Bi2212 grains and flakes. With a short tp, porosity is favored between the Bi2212 flakes, while with a longer tp, a more dense structure is formed.
4.3. Effects of varying the testing rate R1
Samples II-5 and II-6 share the same Tox = 650 °C, Tp = 855 °C, tp and cooling rate (furnace cooled) as samples II-3 and II-4, but the heating rate R1 is decreased to from 200 to 60 °C h−1. Magnetization results show that by decreasing R1, there is an ∼23% decrease in magnetic moment at 4.2 K. Again, there is no effect on Tc, indicating that the oxygen content is mostly influenced by Tp. The XRD results in figure 7(b) show that with the lower R1, the 008 (Bi2212) peak decreases, indicating that more Bi2201 is formed. The γ values calculated for samples II-5 and II-6 are 49% and 50%, respectively, suggesting around 13–14% of Bi2201, significantly higher than samples II-3 and II-4. Furthermore, the DTA curves in figure 8(b) for samples II-5 and II-6 show additional peaks around the main melting peak, indicating reduced Bi2212 content when processed with lower R1.
Although both Bi2201 and Bi2212 form in the temperature range 650–790 °C [37], Bi2201 is more stable than Bi2212 and is thus preferred. Additionally, the stability range of Bi2201 is only slightly reduced by decreasing the oxygen partial pressure, but is further reduced by increasing the temperature [45]. Hence, with a lower heating rate, the time for heating is increased from 1.0 to 3.4 h, allowing more time for Bi2201 formation and growth.
4.4. Analysis of the pellet/Ag interface
Figure 11 shows that the Bi2212 grains at the Ag interface are much larger than those at the sample's free surface. These grains are well connected, which is commonly observed in Ag-clad Bi2212 conductors after PMP [18, 49, 50]. In PMP Bi2212/Ag tapes, nucleation and grain alignment begin at the oxide/Ag interface [51]. Also, based on a grain alignment model developed by Buhl et al, Bi2212 grains bend during growth when they reach a Ag surface and turn parallel to the Ag surface [52].
Here, rapid diffusion at the pellet/Ag interface is the essential factor influencing Bi2212 formation and growth. The peak temperature is 845 °C for samples II-1 and II-2, which is nearly 30 °C below the melting temperature (876 ± 1 °C as determined by DTA), so the bulk does not melt during the heat treatment. A 5.2 wt% silver addition to Bi2212 powders reduces the melt temperature by more than 20 °C [53]. Thus, in the region influenced by the Ag interface, the melting temperature of Bi2212 is at least 20 °C lower than in the bulk, ensuring rapid diffusion. Because the growth in the a−b plane direction is much faster than in the c direction, very large platelet Bi2212 grains form at the interface. When dwelling at Tp, Bi2212 grains grow rapidly, reach the Ag interface, and then turn parallel to the Ag surface [52]. The smoothness of the Ag surface also influences Bi2212 grain orientation [54]. For the remainder of the pellet (which is not proximate to the Ag), the Bi2212 grains form and grow in colonies but without any alignment relative to the Ag sheath. With the layer thickness greater than the grain size (about 150 μm), the colonies of Bi2212 grains are no longer parallel to the Ag substrate [55]. Also, the rest of the pellet is still nearly 30 °C lower than its melting temperature, so grain growth via diffusion is limited in the solid state.
4.5. Implications for MP Bi2212 wires
The results show several potential advantages of MP powders with a direct oxidation heat treatment over conventional OPIT with PMP. Several potential challenges must also be considered for wire processing.
Through mechanical alloying, MP powder can have a controllable stoichiometry and homogeneous elemental distribution. Composition is a potentially significant factor in future Bi2212 wire optimization. With sufficient intermittent scraping and optimized milling time, an elementally homogeneous MP powder with the desired stoichiometry can be obtained, avoiding phase segregation and inhomogeneous oxidation after heat treatment.
The results here show that by using a direct oxidation approach to forming Bi2212 grains without a partial melt, Bi2201 is the only phase impurity formed, and the Bi2201 content is much lower than in tapes and wires. Recent results indicate that although large Bi2201 grains reduce Jc, Bi2201 intergrowths within Bi2212 grains do not, and in fact may provide flux pinning [19, 56]. Through direct oxidation of MPs, any CF or AEC grains that may form in the early stage of heat treatment are fully reacted, whereas this is not the case with PMP of oxide precursors. The solid-state reaction converting MPs →Bi2212 also limits void agglomeration, a significant limiting factor for transport Jc in OPIT wire [57, 58].
The results here show that high density Bi2212 colonies are formed during the MP →Bi2212 transformation and that large, textured grains are aligned at the Ag interface. For multifilamentary wires with filament sizes between 10 and 30 μm, highly aligned Bi2212 grains are expected after heat treatment.
One important issue for MP wires that has not been addressed here is the need for sufficient and rapid oxygen diffusion through the Ag sheath to ensure homogeneous oxidation and to avoid phase segregation. In the work reported here, the MP pellets have a free surface exposed to the flowing oxygen, so even with a 10% oxygen atmosphere, access to oxygen is sufficient. In wires, the time constant for oxygen diffusion through the Ag sheath must be compared to those of solid-state metallic reactions and/or phase segregation within the precursor. This will require significant study with Ag-sheathed MP wires.
5. Conclusion
A metallic precursor approach to synthesizing Bi2Sr2CaCu2Ox is presented. A homogeneous MP with a controlled stoichiometry containing Bi, Sr, Ca, Cu, Ag and/or its alloys is produced by mechanical alloying with intermittent scraping. Pressed pellets are formed and heat-treated with simple two-stage heat treatments. By introducing oxygen when Bi2212 starts to form and holding at an elevated temperature for a sufficient time, the MP oxidizes and transforms into Bi2212. A series of samples have been investigated based on chemical, thermal, microstructural, phase and magnetic property analysis to understand the preparation of the MP and its conversion to Bi2212 under various heat treatment conditions. Since the peak temperature is at least 20 °C below the melting temperature, it is feasible to have Bi2201 as the only phase impurity after heat treatment, which is quite different from partial-melt processing of oxide precursors which results in AEC and CF phases as well. Several factors impacting the nucleation and growth of Bi2212 grains are discussed. Higher Tp and longer tp facilitate conversion of the MP to Bi2212 and a reduction of the Bi2201 content. The oxygen content is mostly influenced by Tp. Furthermore, higher Tp results in larger and denser Bi2212 grains. A faster heating rate R1 results in a shorter time between T1 and Tp, suppressing Bi2201 nucleation. Additionally, the microstructure at the sample/silver interface suggests larger size and preferred orientation of Bi2212 grains with the aid of a silver interface.
Acknowledgments
The authors acknowledge the use of the Analytical Instrumentation Facility (AIF) at North Carolina State University, which is supported by the State of North Carolina and the National Science Foundation. The authors are grateful to Dr Yi Liu, Golsa Naderi, Amir Kajbafvala (NCSU) and William Nachtrab (Supercon. Inc.) for assistance with this project.