


Abstract
Regular imaging is used throughout image guided radiation therapy to improve treatment delivery. In order for treatment procedures to be optimized, the doses delivered by imaging exposures should be taken into account. CT dosimetry methods based on the CT dose index (CTDI), measured with a 100 mm long pencil ionization chamber (CTDI100) in standard phantoms, are not designed for cone-beam CT (CBCT) imaging systems used in radiotherapy, therefore a modified version has been proposed for CBCT by the International Electrotechnical Commission (CTDIIEC). Monte Carlo simulations based on a Varian On-Board Imaging system were used to derive conversion coefficients that enable organ doses for ICRP reference phantoms to be determined from the CTDIIEC for different scan protocols and different beam widths (80–320) mm. A dose–width product calculated by multiplying the CTDIIEC by the width of the CBCT beam is proposed as a quantity that can be used for estimating effective dose. The variation in coefficients with CBCT beam width was studied. Coefficients to allow estimation of effective doses were derived, namely 0.0034 mSv (mGy cm)−1 for the head, 0.0252 mSv (mGy cm)−1 for the thorax, 0.0216 mSv (mGy cm)−1 for the abdomen and 0.0150 mSv (mGy cm)−1 for the pelvis, and these may be applicable more generally to other CBCT systems in radiotherapy. If data on effective doses are available, these can be used in making judgements on the contributions to patient dose from imaging, and thereby assist in optimization of the treatment regimes. The coefficients can also be employed in converting dosimetry data recorded in patient records into quantities relating directly to patient doses.
Export citation and abstract BibTeX RIS
1. Introduction
Clinical imaging based on computed tomography (CT) technology in the form of cone-beam CT (CBCT) has become an essential component of radiotherapy treatments. It is used for monitoring and checking the position of the planning target volume and organs at risk prior to treatment delivery for image guided radiation therapy (IGRT). The frequency of imaging and exposure levels used are important, and, for optimization of the treatment to be achieved, a knowledge of the dose levels delivered by imaging is required. Moreover, the European Basic Safety Standards require information relating to patient exposure to form part of the report for any medical radiological procedure, as well as information relating to risk to be provided to the patient (Euratom 2014). Currently, the dose measurement used for CT dosimetry is the CT dose index (CTDI), which is measured with a pencil ionization chamber of length 100 mm (CTDI100) within standard cylindrical PMMA head and body phantoms (IEC 2001). The CTDI100 was developed for CT scans performed with narrow beams ≤40 mm on conventional multi-detector CT (MDCT) scanners, but CBCT systems use flat panel detectors as the image receptors, and beams extend beyond the lengths of the pencil chamber and the standard phantoms for some scans (Mori et al 2005, Boone 2007, Kyriakou et al 2008, Abuhaimed et al 2014). Therefore, alternative dose indices based on different approaches have been proposed for use in CBCT dosimetry to provide a better representation of the dose within the body by including more of the contribution from scattered radiation (Mori et al 2005, Fahrig et al 2006, Islam et al 2006, Amer et al 2007, Kyriakou et al 2008, Geleijns et al 2009, AAPM 2010, IEC 2012). These have been discussed in detail in previous studies (Abuhaimed et al 2014, Abuhaimed et al 2015, 2015b, 2015c).
The link between the volume-averaged CTDI (CTDIvol) and doses to organs irradiated has been investigated for MDCT scanners (Turner et al 2010). They used similar scan parameters and phantoms to develop conversion coefficients to allow estimation of organ doses from CTDIvol for four CT scanners. The mean variation in organ doses normalized with respect to the CTDIvol for each scanner was ±5%. In a similar manner, coefficients linking dose–length product (DLP) to effective dose have been developed (Shrimpton et al 2016). The use of scanner-independent conversion coefficients for a range of CT scan protocols and scanners can be used to estimate organ and effective doses for patients undergoing MDCT scans (Turner et al 2011, McMillan et al 2014, Choonsik et al 2015).
Information on the correlation between the dose indices proposed for CBCT dosimetry and organ and effective doses is limited. Martin et al (2016) investigated the link between the weighted CTDI (CTDIw) value measured with a reference beam width of 20 mm (CTDIw,ref) that is displayed currently on the console for the Varian On-Board Imager (OBI) used for IGRT procedures and organ doses. Wood et al (2015) proposed a technique for estimating organ doses resulting from pelvic scans for prostate cancer patients for the OBI system using a patient dose calculator (PCXMC). Rampado et al (2016) investigated the link between several CBCT dose indices and organ doses received by radiotherapy patients undergoing IGRT procedures using an Elekta x-ray volume imager (XVI), and derived conversion coefficients to allow approximate values of organ doses to be estimated.
The aim of this study is to investigate the link between a dose index proposed for CBCT by the International Electrotechnical Commission (IEC) (IEC 2012) and recommended by the International Atomic Energy Agency (IAEA) (IAEA 2011) and the Institute of Physics and Engineering in Medicine (IPEM) (Platten et al 2013), and organ and effective doses resulting from various OBI scan protocols for a wide range of beam widths.
2. Materials and methods
2.1. Dose index of CBCT dosimetry
The approach suggested by the IEC is a modification of the CTDI concept and uses instrumentation employed for CT dosimetry (figure 1). The symbol (CTDIIEC) has been used in this study to distinguish the modified method from the standard CTDI100. The CTDIIEC is derived from a measurement of the CTDI100 using a reference beam width (ref) ≤40 mm in standard 150 mm long CT dosimetry phantoms to which correction factors are applied, equal to the ratio of CTDI measurements made free in air (FIA) for the clinical cone beam of width W (CTDIFIA,W) and the reference beam (CTDIFIA,ref) as:

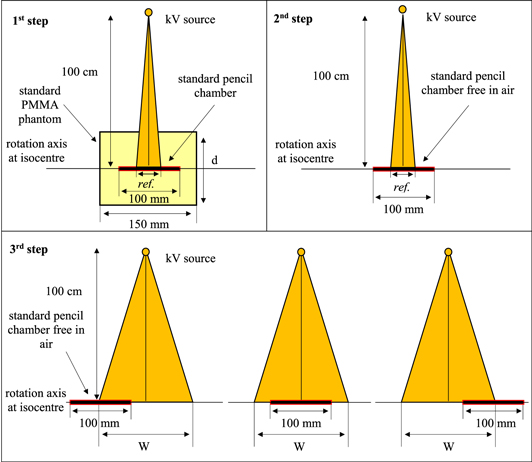
Figure 1. Diagrammatic representations (sagittal views) of the configuration used for measurements of the three quantities required to determine CTDIIEC from equation (1) with a 100 mm pencil ionization chamber (step 1: CTDI100,ref, 2: CTDIFIA,ref and 3: CTDIFIA,W), d = 16 cm and 32 cm for the head and body phantoms, respectively.
Download figure:
Standard image High-resolution imageThe CTDI100,ref values are measured at the central and peripheral positions with the CTDI phantom positioned at the isocentre. CTDIFIA,W can be measured either by a long ionization chamber or by combining measurements made with the standard 100 mm long pencil ionization chamber by moving it in steps across the beam. The minimum number of steps required to evaluate a beam of width W is based on the sum of W + 40 mm. For example, two steps are used when the sum ≤200 mm, whereas three steps are required for the sum of ≤300 mm, as shown in the third step in figure 1 (IAEA 2011). CTDIIEC,W is evaluated to account for the dose distribution in a manner similar to that used for the CTDIw.

The advantage of the CTDIIEC over the CTDI100 is that the use of a long ionization chamber reduces the dependence of the CTDI100 on beam width. Figure 2 shows the influence of the beam width on CTDI100 and CTDIIEC. Values of CTDIIEC are approximately constant over a wide range of beam widths with variations of less than ±1%, whereas the CTDI100 falls once the beam width exceeds the length of the chamber (100 mm) and the phantom (150 mm).

Figure 2. Variation of CTDI100,w and CTDIIEC,w values (mGy/100 mAs) with the beams of width (80–320) mm for the (a) head and (b) body phantoms (reproduced from Abuhaimed et al 2014, © IOP Publishing Ltd. All rights reserved).
Download figure:
Standard image High-resolution imageIn the same way that the CTDIvol is multiplied by the length of a CT scan to derive the quantity DLP that is linked to the total amount of radiation delivered by a MDCT scan, the CTDIIEC can be multiplied by the width (W) of the cone beam to derive an equivalent quantity, the dose–width product (DWP).

2.2. Monte Carlo simulations
Values for the CTDI100, together with organ and effective doses for four scan protocols (head, thorax, abdomen, and pelvis) commonly used in the clinic for IGRT procedures, were assessed using Monte Carlo (MC) simulations. The MC user codes BEAMnrc (Rogers et al 1995), Cavity (Kawrakow et al 2017a) and DOSXYZnrc (Walters et al 2017) based on EGSnrc (V2017) (Kawrakow et al 2017b) were utilized. BEAMnrc was used to simulate the kV OBI system integrated into a Varian TrueBeam linear accelerator, and Cavity and DOSXYZnrc were utilized to assess CTDIIEC and organ doses in three dimensions, respectively. CTDIIEC and organ doses were investigated using beams of width 80–320 mm in increments of 20 mm. The protocols 100 kV, head bowtie filter, and a partial rotation for the head scans, and 120 kV, body bowtie, and a full rotation for the body scans were investigated. All the MC simulations were run usinga cluster computer (SANAM) available at King Abdulaziz City for Science and Technology (KACST).
2.2.1. kV beams
The geometric and dosimetric properties of the MC codes developed for the OBI system were validated and calibrated against experimental measurements in previous studies (Abuhaimed et al 2014, Martin et al 2016). kV beams for the head and body protocols were generated with BEAMnrc using 1.0 × 10¹⁰ histories per beam and ISOURCE = 10 (parallel circular beam incident from side). A variance reduction technique implemented in BEAMnrc known as directional bremsstrahlung splitting was utilized to obtain an efficient MC calculation in the kV energy range (Kawrakow et al 2004, Mainegra-Hing and Kawrakow 2006). This technique was employed with a splitting number (NBRSP) set to 2 × 10⁴. Electrons and photons were tracked during the simulations down to ECUT of 516 keV and PCUT of 1 keV, respectively (Abuhaimed et al 2018). These values were also set to the low energy thresholds for creation of secondary electrons (AE) and photons (AP). The resulting beams were stored at a source–surface distance (SSD) of 50 cm in files known as phase space (PHSP) files.
2.2.2. Assessments of CTDIIEC
The PHSP files generated with BEAMnrc were transferred into Cavity to simulate the kV beams. The configuration shown in figure 1 required for the CTDIIEC assessment was simulated using the standard 150 mm long CTDI head (16 cm diameter) and body (32 cm diameter) phantoms and a 100 mm long pencil ionization chamber (Radcal 10X6-3CT). CTDI100,ref and CTDIFIA,ref were assessed using a reference beam of width 20 mm. Since the MC code allows simulation of a chamber of any length, the technique shown in the third step of figure 1 was not applied for CTDIIEC,W. The chamber length used for CTDIIEC,W was specified based on the beam of interest as W + 40 mm (IAEA 2011). All phantoms were placed at a source–isocentre distance (SID) of 100 cm, thus the distance between the PHSP files obtained with BEAMnrc at 50 cm and the phantoms was set to 50 cm. The CTDI100,ref calculations were made at the central and peripheral positions of the phantoms to obtain CTDIIEC,w. The partial rotation (200°) that was used for the head protocol began at 90° (left of the patient), and the x-ray source moved beneath the phantom stopping at the right side at 290°. 1.0 × 10⁸ histories were run for each projection to obtain a statistical uncertainty <1%. Values for the CTDIIEC,w were multiplied by the width of the cone beam at the isocentre to derive values for the DWP, as in equation (3).
2.2.3. Estimation of organ doses
Organ and effective doses resulting from the four scan protocols were assessed using DOSXYZnrc for the International Commission on Radiological Protection (ICRP) adult male and female reference computational phantoms (ICRP 2009). A computational method based on MATLAB codes applied in (Martin et al 2016) was used to transfer the format of the ICRP phantoms to the MC code format. The codes were also applied to extract and report mean values of organ doses in three dimensions. The PHSP files generated with BEAMnrc were transferred to DOSXYZnrc, and run as kV sources using ISOURCE = 8 (phase-space source incident from multiple directions). The ICRP phantoms were placed at a SID of 100 cm, and 1.0 × 10¹⁰ and 1.5 × 10¹⁰ histories were run for the male and female phantoms, respectively, to achieve statistical uncertainty values of <1% for organs located inside the scan fields. The centre for the head scan was positioned at the middle of the phantom head, whereas the scan centres were located at the middles of the lung, the pancreas and the pelvis for thorax, abdomen and pelvis scans, respectively. Table 1 lists the height and weight of the ICRP phantoms and the effective diameter (ED) of the regions studied. The ED was estimated as described in AAPM (2011), which is based on assessing the anterior and posterior (AP) and the lateral (LAT) dimensions as:

Table 1. Height and weight of the ICRP adult phantoms, and the ED of the regions investigated.
| Male | Female | |
|---|---|---|
| Height (m) | 1.76 | 1.63 |
| Weight (kg) | 73.0 | 60.0 |
| ED head (cm) | 18.92 | 15.47 |
| ED thorax (cm) | 32.37 | 28.54 |
| ED abdomen (cm) | 32.10 | 26.48 |
| ED pelvis (cm) | 30.21 | 28.84 |
The middle slice of each region, which was used as an isocentre for the scan, was also used to estimate AP and LAT values.
The mean dose for each tissue or organ (HT) resulting from beam widths of 80–320 mm were then normalized with respect to the corresponding values of the CTDIIEC,w to derive the conversion coefficients (CCT).

The mean doses for organs and tissues were used to evaluate the effective dose (E) using tissue weighting factors (WT) recommended by ICRP 103 (ICRP 2007), and conversion coefficients (CCE) for determining effective doses from values for DWPs were derived as in equation (5).

3. Results
3.1. Assessment of CTDIIEC
Table 2 gives values of the CTDIIEC assessed at centres and peripheries of the phantoms. CTDI100,ref and CTDIFIA,ref were assessed using a reference beam of width 20 mm, from which the correction factors of CTDIFIA,W/CTDIFIA,ref for the beams studied were calculated, and hence CTDIIEC values. For the head scans, peripheral measurements were smaller than those at the centres by 6%. This is because the head phantom was scanned according to the protocol over a partial scan (200°), which is employed at the clinic in order to minimize the dose to the eyes. It delivers higher doses to posterior and lateral peripheral positions in the phantom, but a lower dose at the anterior. For example, CTDIIEC,p at the top of the head phantom (0°) was 1.56 mGy, whereas that at the bottom (180°) was 5.55 mGy. In body scans (thorax, abdomen and pelvic), for which a full rotation 360° was applied, the central values were about 40% less than the peripheral ones due to higher attenuation in the larger body phantom (Abuhaimed et al 2015).
Table 2. Values of CTDIIEC in (mGy/100 mAs) for the scan protocols studied using beams of width 80–320 mm.
| Position | CTDI100,ref | CTDIFIA,W/CTDIFIA,ref | CTDIIEC |
|---|---|---|---|
| Head—100 kV | |||
| Centre | 3.82 | 0.995–1.011 | 3.80–3.86 |
| Periphery | 3.59 | 3.58–3.63 | |
| Weighted | 3.67 | 3.65–3.71 | |
| Body (thorax, abdomen and pelvis)—120 kV | |||
| Centre | 1.89 | 0.990–1.013 | 1.87–1.91 |
| Periphery | 2.71 | 2.69–2.75 | |
| Weighted | 2.44 | 2.41–2.47 | |
Since CTDIFIA,W values for the different beams are assessed free in air, the variations between the correction factors were minimal, within ±1.6% and ±2.3% for the head and body protocols, respectively. This gave CTDIIEC values that are approximately constant over all beam widths (figure 2) (IAEA 2011, Abuhaimed et al 2014).
3.2. Estimation of organ doses
Organ and effective doses of the protocols studied were estimated using beams of width 80–320 mm. The mean doses for some organs and tissues in (mGy/100 mAs) and effective doses in (mSv/100 mAs) resulting from three widths 80, 200, and 320 mm are listed in tables 3–6, and the full width at half maximum (FWHM) of these widths are listed in table 7. FWHM values were assessed with Cavity code at the centre and periphery of 600 mm long CTDI head and body phantoms. For the purpose of brevity, 'organs' is used throughout this study to describe organs and tissues. Only organs that were covered fully or partially by the primary beam were considered. Doses to organs that were near to or partially within the primary beam increased substantially when wider beams were used, through direct irradiation of the organ and increased exposure from scatter radiation. The use of different beam widths for the head scan, for example, increased the brain dose for both phantoms by a factor of ∼6. However, the increase was less significant (≤ 1 mGy) for organs that were completely inside the scan fields, e.g. oral mucosa and salivary glands (table 3). Variations of similar magnitude were also found for organ doses resulting from the other protocols (tables 4–6).
Table 3. Mean organ doses in (mGy/100 mAs) for the ICRP adult male and female reference computational phantoms using the head scan and beams of width 80, 200 and 320 mm.
| Head | Male | Female | ||||
|---|---|---|---|---|---|---|
| Organ | 80 mm | 200 mm | 320 mm | 80 mm | 200 mm | 320 mm |
| Extrathoracic region | 1.19 | 2.44 | 2.64 | 2.57 | 3.78 | 3.93 |
| Oral mucosa | 1.81 | 2.37 | 2.48 | 2.54 | 3.49 | 3.63 |
| Brain | 0.78 | 3.26 | 4.55 | 0.77 | 3.57 | 4.74 |
| Salivary glands | 3.45 | 4.79 | 4.99 | 4.33 | 5.60 | 5.78 |
| Eye lens | 0.27 | 1.00 | 1.09 | 0.77 | 1.05 | 1.12 |
| Eye bulb | 0.34 | 1.18 | 1.29 | 0.75 | 1.13 | 1.21 |
| Effective dose (mSv/100 mAs) | 0.11 | 0.29 | 0.54 | 0.17 | 0.47 | 0.76 |
Table 4. Mean organ doses in (mGy/100 mAs) for the ICRP adult male and female reference computational phantoms using the thorax scan and beams of width 80, 200, and 320 mm.
| Thorax | Male | Female | ||||
|---|---|---|---|---|---|---|
| Organ | 80 mm | 200 mm | 320 mm | 80 mm | 200 mm | 320 mm |
| Lung | 3.54 | 7.20 | 8.21 | 4.55 | 9.05 | 10.22 |
| Breast | 1.68 | 6.87 | 7.35 | 6.10 | 9.26 | 9.73 |
| Heart | 4.96 | 9.45 | 10.47 | 6.22 | 11.76 | 12.88 |
| Spleen | 0.78 | 3.26 | 6.34 | 0.71 | 3.18 | 7.96 |
| Thymus | 1.51 | 10.74 | 13.19 | 2.09 | 12.37 | 13.84 |
| Oesophagus | 2.29 | 5.87 | 8.86 | 2.73 | 7.44 | 11.14 |
| Liver | 0.67 | 3.05 | 6.51 | 0.73 | 3.78 | 8.52 |
| Thyroid | 0.61 | 2.44 | 15.61 | 0.74 | 3.22 | 17.28 |
| Spinal cord | 1.14 | 2.88 | 4.94 | 1.37 | 3.41 | 6.15 |
| Effective dose (mSv/100 mAs) | 1.04 | 3.06 | 4.91 | 1.72 | 3.65 | 5.60 |
Table 5. Mean organ doses in (mGy/100 mAs) for the ICRP adult male and female reference computational phantoms using the abdomen scan and beams of width 80, 200 and 320 mm.
| Abdomen | Male | Female | ||||
|---|---|---|---|---|---|---|
| Organ | 80 mm | 200 mm | 320 mm | 80 mm | 200 mm | 320 mm |
| Colon | 8.57 | 17.67 | 22.38 | 2.22 | 10.83 | 21.76 |
| Stomach | 13.00 | 25.84 | 29.05 | 18.35 | 31.92 | 35.86 |
| Gall bladder | 15.42 | 22.01 | 24.04 | 18.34 | 29.51 | 31.95 |
| Kidneys | 14.47 | 22.98 | 25.41 | 18.73 | 28.11 | 30.57 |
| Pancreas | 17.53 | 25.04 | 27.42 | 25.09 | 33.62 | 35.94 |
| Spleen | 5.68 | 17.40 | 20.61 | 6.39 | 22.34 | 26.61 |
| Liver | 9.24 | 20.79 | 24.04 | 9.87 | 25.56 | 30.97 |
| Effective dose (mSv/100 mAs) | 3.79 | 8.52 | 13.30 | 3.75 | 8.69 | 13.99 |
Table 6. Mean organ doses in (mGy/100 mAs) for the ICRP adult male and female reference computational phantoms using the pelvis scan and beams of width 80, 200 and 320 mm.
| Pelvis | Male | Female | ||||
|---|---|---|---|---|---|---|
| Organ | 80 mm | 200 mm | 320 mm | 80 mm | 200 mm | 320 mm |
| Colon | 5.31 | 10.25 | 15.95 | 10.18 | 25.35 | 38.44 |
| Prostate/uterus | 7.01 | 31.43 | 37.73 | 15.40 | 34.10 | 38.35 |
| Small intestine | 5.44 | 13.82 | 23.96 | 12.12 | 22.76 | 31.62 |
| Testes/ovaries | 0.80 | 3.34 | 18.29 | 15.27 | 33.46 | 38.08 |
| Urinary bladder | 27.08 | 40.83 | 44.14 | 22.18 | 44.28 | 47.94 |
| Effective dose (mSv/100 mAs) | 2.73 | 5.53 | 8.66 | 4.47 | 10.35 | 13.88 |
3.3. Conversion coefficients for organ and effective doses
Organ and tissue doses for each scan protocol (tables 3–6) have been normalized with respected to the weighted values of CTDIIEC,w (table 2) as in equation (5) to obtain the conversion coefficients (CCT), and results for some organs are given in (figures 3–6). In a similar manner to the CTDIvol, CTDIIEC,w gives an average dose within a section of the scan. Results show that CTDIIEC,w can provide an indication of the doses to a small number of organs such as the salivary glands resulting from the head scan (figure 3), but the relationship is limited for the majority of organs as they only lie partially within the primary beam or are at such a depth that the average dose value given by CTDIIEC,w is not appropriate.
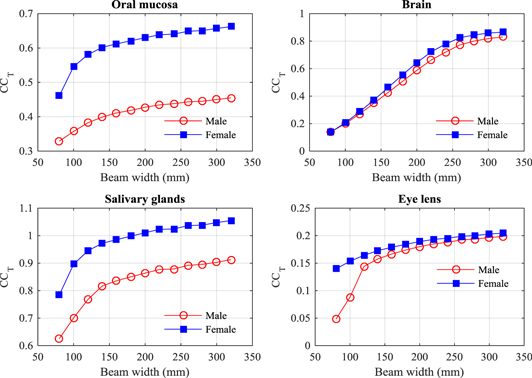
Figure 3. Conversion coefficients (CCT) to give mean doses for a selection of organs resulting from head scans with beams of width 80–320 mm for the ICRP adult male (M) and female (F) reference computational phantoms.
Download figure:
Standard image High-resolution image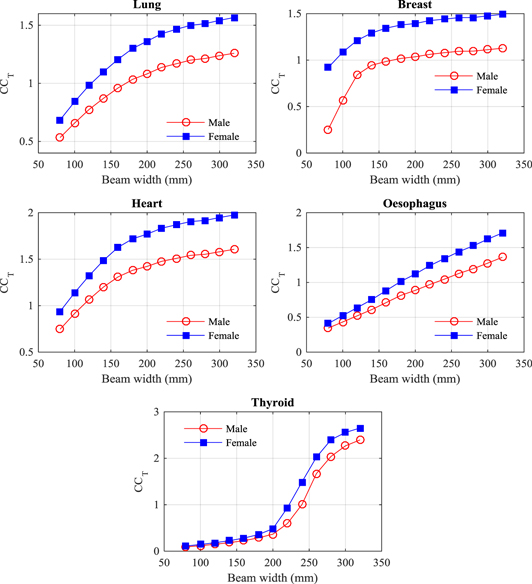
Figure 4. Conversion coefficients (CCT) to give mean doses for a selection of organs resulting from thorax scans with beams of width 80–320 mm for the ICRP adult male (M) and female (F) reference computational phantoms.
Download figure:
Standard image High-resolution image
Figure 5. Conversion coefficients (CCT) to give mean doses for a selection of organs resulting from abdomen scans with beams of width 80–320 mm for the ICRP adult male (M) and female (F) reference computational phantoms.
Download figure:
Standard image High-resolution image
Figure 6. Conversion coefficients (CCT) to give mean doses for a selection of organs resulting from pelvis scans with beams of width 80–320 mm for the ICRP adult male (M) and female (F) reference computational phantoms.
Download figure:
Standard image High-resolution imageAnother factor is that CTDIIEC,w is measured using phantoms with different shapes and diameters from the heterogeneous human body (McCollough et al 2011). This affects organs in the thorax especially, since the attenuation of the lung tissue is lower, so values of CCT for organs in the thorax are greater than 1.0 for most beam widths (figure 4). The coefficients for the lung, breast, and heart rise rapidly initially and then level off once the majority of the organ is within the scan field, while that for the oesophagus rises gradually as the field extends to cover a greater proportion of the length. The dose to the thyroid, which lies in the narrower neck region, rises even more rapidly once the field extends to cover the thyroid. Nevertheless, the CCT values linked to CBCT beam width could be utilized in assessment of organ doses for a reference patient undergoing IGRT procedures using the scan protocols employed in the clinic.
Coefficients for organs covered by the abdominal scan all follow a similar pattern, increasing at a greater rate initially for narrow scan widths (figure 5) and then levelling off once the majority of the organ is within the scan field, although continuing to rise because of the build-up of radiation scattered with field size. A similar pattern is also followed for the bladder, prostate, uterus and ovaries for the pelvis scan, but the colon and small intestine increase linearly as the beam gradually encompasses a greater proportion of the organ. The dose to the testes only rises for wider beams when they fall within the radiation field.
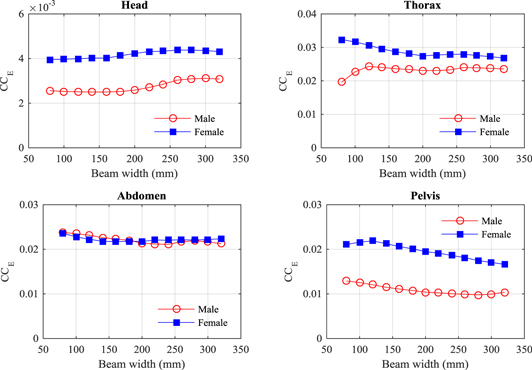
Doses to individual organ have been combined with tissue weighting factors to calculate values of effective dose from which coefficients (CCE) can be derived linking DWP values to effective doses for imaging procedures. Values of CCE, derived as in equation (6), are plotted against beam width for the four protocols in figure 7.
Figure 7. Variation of the conversion coefficients (CCE) to give effective doses for CBCT beams of width 80–320 mm for the ICRP adult male and female reference computational phantoms, for the four scan protocols studied.
Download figure:
Standard image High-resolution image
Values of CCE for scan protocols with the beam widths used in routine clinical practice (180–220) mm are given in (table 8). Uncertainties are given based on values for beam widths within ± 20 mm of the value used 200 mm. Conversion coefficients from DLP to effective dose for MDCT examinations (Shrimpton et al 2016) are included in table 8 for comparison.
Table 8. Conversion coefficients (CCE) for CBCT derived in this study for male and female phantoms, as in equation (6) for effective dose, compared with factors (E/DLP) for adults undergoing MDCT scans (Shrimpton et al 2016). All coefficients are in (mSv/mGy cm).
| Region examined | Male phantom | Female phantom | Average adults | (E/DLP) factors |
|---|---|---|---|---|
| Head | 0.0026 ± 0.0001 | 0.0042 ± 0.0001 | 0.0034 ± 0.0001 | 0.0020a |
| Thorax | 0.0231 ± 0.0002 | 0.0274 ± 0.0003 | 0.0252 ± 0.0003 | 0.027 |
| Abdomen | 0.0214 ± 0.0004 | 0.0218 ± 0.0002 | 0.0216 ± 0.0004 | 0.024 |
| Pelvis | 0.0104 ± 0.0003 | 0.0195 ± 0.0005 | 0.0150 ± 0.0006 | 0.020b |
aThis value relates to a head scan that does not include the neck. bThis value relates to a scan of the abdomen and pelvis.
4. Discussion
4.1. Factors influencing the conversion coefficients
The CCT and CCE values can be influenced by several factors, which lead to an over/underestimation in assessment of organ and effective doses.
4.1.1. Gender and stature
Variations in organ doses of the male and female phantoms (tables 3–6) are mainly due to the height and shape differences of the phantoms with the male being taller (1.76 m) and wider than the female (1.63 m). For example, although the volumes of the colon and small intestine in the female are almost the same as those in the male (ICRP 2009), doses to the colon and small intestine resulting from the pelvic scan for the female were about double those for the male (table 6). This is because a CBCT scan of a fixed field size was selected and centred in the same position at the middle of the pelvis, which resulted in a greater proportion of the abdominal organs lying within the scan field for the female than for the male phantom. In addition, the x-ray beam is more attenuated within the thicker male body than in the female. Such variations are similar to those reported in an earlier study (Martin et al 2016), and for the Elekta XVI system using the same ICRP phantoms (Marchant and Joshi 2017). In general, organ and effective doses for the female phantom were higher than those for the male. An exception to this was that the male colon dose from the abdomen scan, which was higher by up to a factor of ∼4 than that for the female (figure 5). This resulted from the male transverse and descending colon walls being closer to the pancreas, which was the position set as the centre of the abdomen scan (ICRP 2009).
The dose variations between the male and female phantoms led to differences in the CCT values under different conditions, with the female coefficients being generally larger (figures 3–6). The CCE values to give effective doses for head, thorax and pelvic scans were larger for females, but were comparable for abdomen scans (figure 7, table 8), as the contribution from the male colon dose, which accounts for 12% of the effective dose, counterbalanced the higher doses to other organs (table 5).
The CCT values for the two phantoms were within factors of ±0.48, ±0.66, ±0.56 and ±0.86 for the head, thorax, abdomen and pelvis scan protocols, respectively, but there are significant dose differences between the phantoms. These variations indicate that gender and stature play a role in determining the conversion coefficients, particularly when a standard field size is used (AAPM 2011, AAPM 2015). Therefore, the CCT values provided in this study that are based on the ICRP phantoms, which represent the average size for the male and female populations, should not be used to assess organ doses for specific patients. However, derivation of CCT values based on reference phantoms, from which values for effective dose can be derived, are important for providing indicative assessments of the dose contributions from imaging procedures received by patients in general during an IGRT treatment. These can provide useful information relating to optimization of protocols and procedures , and can be used to compare different imaging systems (Choonsik et al 2015).
4.1.2. Software version and kV system
The default scan protocols implemented in the recent software version of the OBI system (V2.5) are different from those used in previous versions. Recently, Abuhaimed et al (2018) compared organ and effective doses from two software versions, V2.5 and V1.6. The main difference between these versions was the field size, where the beam width was extended from 198 mm in V1.6 to 214 mm in V2.5. This difference was found to play a role in increasing organ doses by 3–13%, 10–77% and 13–21% for the head, thorax, and pelvis scans, respectively, thus effective doses were raised by 13–14%, 17–18% and 16–17%, respectively, similar to results from other studies comparing different software versions (Palm et al 2010, Cheng et al 2011).
The organ and effective doses have been normalized with respect to the CTDIIEC to derive coefficients that minimize the influence of the imaging system and scan parameters used in each software version on the doses (Turner et al 2010, Turner et al 2011, ICRU 2012, McMillan et al 2014). The CCE values derived here are based on a Varian OBI V2.5, but may be suitable for other OBI versions and other systems such as the Elektra XVI, if the scan parameters are taken into account, the influence on CCE is less than on the CCT values, since as beam widths are extended and the DWP increases, greater proportions of the radiosensitive organs lie within the radiation field, increasing the effective dose accordingly (figure 7).
4.2. The use of CCT and CCE
Values of conversion coefficients CCT and CCE have been derived to allow organ and effective doses to be calculated for reference patients. Multiplication of the CTDIIEC by the width of the cone beam has been used to derive a DWP to provide a quantity that can be linked to effective dose. The variation in CCE over the range of beam widths likely to be used in clinical practice is ±18%, so these can provide a relatively simple method for obtaining approximate values of effective dose that may be suitable for general use on any CBCT system. Values of CCE are compared with coefficients for determining effective dose from values of DLP for MDCT examinations using the same ICRP reference phantoms in table 8. Although the male and female coefficients are different, the averaged values relating to effective dose from the combined phantom results, are similar to the DLP conversion factors. The values for the male and female head CCE are surprisingly different, but this arises from the difference in angulation of the head (ICRP 2009), which makes the result for the female phantom particularly large. The head CCE is substantially greater than the DLP factor, but, since it includes the neck and thyroid, the comparison is not like for like. The coefficients for the thorax and abdomen are within 11% of the DLP factors derived, while that for the pelvis differed by 33% from the DLP factor, but this was for the abdomen and pelvis, so again it is not a like for like comparison.
This study has been based on the ICRP reference phantoms. As organ doses will vary with patient size, the analyses cannot be applied to individual patients. However, size specific adjustment factors could be developed in the same manner as for MDCT in the future (AAPM 2011, AAPM 2015), although such adjustments would need to take account of differences in patient heights, as well as diameters and beam widths. Effective dose, on the other hand, is based on a reference person representing the average for a population, and portrayed by the ICRP reference phantoms. The values of effective dose obtained could be used in evaluating the contribution from frequent imaging of the patient to treatment doses, and assist in the general optimization of protocols for the whole treatment process.
5. Conclusions
The increased use of frequent imaging in the direction of treatment through IGRT requires careful consideration about the optimal use of imaging. Although imaging has clear benefits in ensuring accurate delivery of treatment, there are many questions to be answered to ensure that procedures are optimized. These include the frequency with which imaging should be performed and whether the same scan field and level of image quality are required for all images. In order to facilitate this, more information is required on doses received by patients from the imaging component. In this study conversion coefficients have been derived that should enable organ doses to be derived from assessments of CTDIIEC for different scan protocols. A DWP calculated by multiplying the CTDIIEC by the width of the CBCT beam is proposed as a quantity that can be used for estimating effective dose. If data on effective doses from imaging procedures are available, these can be used in making judgements on the contributions to patient dose from imaging and thereby assist in optimization of the whole treatment regime. In addition, this will provide information on dose levels that can be employed in converting dosimetry data recorded in patient records into quantities relating directly to patient doses.
Acknowledgments
The authors wish to acknowledge SANAM team at KACST for their support in running MC codes in the cluster.