


Abstract
This letter is motivated by some recent experiments on pan-cake–shaped nano-samples of metallic glass that indicate a decline in the measured shear modulus upon decreasing the sample radius. Similar measurements on crystalline samples of the same dimensions showed a much more modest change. In this letter we offer a theory of this phenomenon; we argue that such results are generically expected for any amorphous solid, with the main effect being related to the increased contribution of surfaces with respect to the bulk when the samples get smaller. We employ exact relations between the shear modulus and the eigenvalues of the system's Hessian matrix to explore the role of surface modes in affecting the elastic moduli.
Export citation and abstract BibTeX RIS
Motivation
This letter is motivated by some experimental measurements of the elastic response of nano-samples of metallic glasses when the radius of cylindrically shaped samples was reduced [1]. In this letter we provide a theoretical explanation of this phenomenon. Since the experiments are performed at temperatures that are much lower than the glass-transition temperature, we can in the following disregard thermal effect, and study the phenomenon in athermal conditions.
Mathematical background
For the sake of concreteness we study theoretically the shear modulus, stressing the difference in its exact calculation between a perfect crystalline sample and an amorphous solid sample of the same physical dimension. In both cases the calculation of the shear modulus starts with the potential energy which for a shear-strained solid can be written as U({ri(γαβ)},γαβ) where {ri}Ni=1 are the positions of the N particles and γαβ is the applied strain. (When possible we treat γαβ as a scalar γ; all the equations can be written in tensorial form if required.) In both cases we can consider the deformation under an infinitesimal shear strain via the parameterized transformation on the particles coordinates J(γ) = I + γh where h determines the imposed deformation. Here comes the important difference between crystalline and amorphous solids [2]. For the former

since the particles remain in mechanical equilibrium also after the deformation, with all the forces fi vanishing on each and every particle. In an amorphous solid, on the other hand, even an infinitesimal deformation gives rise to non-zero forces on the particles, resulting in non-affine displacements ui that are necessary to restore mechanical equilibrium. Thus, for an amorphous solid

This crucial difference translates to a different calculation of the mechanical moduli; in a perfect crystal we can write d/dγ = ∂/∂γ. In an amorphous solid on the other hand

Applying this to the definition of the shear modulus, μ = (1/V )d2U/dγ2 (with V being the volume) we find a different answer,


The shear modulus of the crystalline solid, which is the same as the first term in the shear modulus of the amorphous solid, is known as the Born approximation. This approximation is corrected by the second term which is due to the non-affine response of the amorphous solid.
Equation (5) is brought to final form using the mechanical equilibrium condition dfi/dγ = 0, which, using eq. (3) becomes ∂fi/∂γ + (∂fi/∂rj)·(duj/dγ) = 0 [3]. Identifying the force on the i-th particle with fi ≡ − ∂U/∂ri, we invert the last relation in favor of duj/dγ to write

Using eq. (6) in eq. (5) we get the final result


Noticing that the Hessian matrix H is real and symmetric, the difference between the shear modulus of a crystalline and amorphous solid is negative definite, necessarily reducing the shear modulus in the case of the amorphous solid compared to the crystalline counterpart (with the same inter-particle potential). To understand the experimental observations of the mechanical softening of smaller and smaller samples we need to understand why the correction term increases in absolute magnitude compared to the Born term which is system size independent to a very good approximation. We start by computing eq. (8) using numerical simulations.
Numerical simulations
Glassy amorphous samples were achieved by using a binary mixture of point particles interacting via modified Lennard-Jones potential with three different characteristic interaction lengths σss = 1 and σℓℓ = 1.4 and σsℓ = 1.18. Details of the potentials can be found for example in refs. [4, 5]. Cuboid samples of fixed height (≈ 15 particles) and square cross-section with varying edges (from 50 to 15 particles) were prepared by quenching from the melt using a gradient energy method to cool the system to T = 0 with zero pressure. The boundary conditions were free on all the edges except the two edges that were clamped to produce infinitesimal shear strain. Clamping the upper and lower edges we obtain a strain γxz to measure μxz while clamping two opposite side walls resulted in measuring μxy (cf. fig. 1). For any given system the Born term was computed directly from the partial derivatives [6, 7]. The correction term was obtained by computing the Hessian matrix and the vector Ξ, again directly from their definitions, inverting the Hessian we compute Ξ·H−1·Ξ exactly. Results for both shear moduli as a function of the ratio of width to height are shown in fig. 2.

Fig. 1: (Color online) A cuboid shape. The top and bottom surfaces (green) were clamped to measure μxz, and the opposite side wall (red) for μxy.
Download figure:
Standard image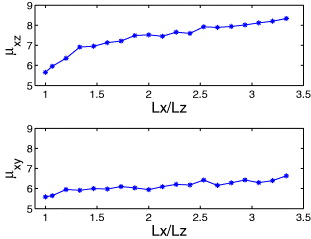
Fig. 2: (Color online) The dependence of the shear moduli μxz and μxy on the ratio of the edge size over the height for systems varying by a factor of 3.5 in this ratio. One observes a change of about 50% in μxz and about 15% in μxy.
Download figure:
Standard imageWe observe a much larger change in μxz (about 50%) than in μxy (about 15%). We will argue below that this difference stems from the contribution of free surfaces. In order to emphasize the role of the free surfaces, we performed the same measurements of the shear modulus in an infinite system made of finite cells which repeat by applying periodic boundary conditions. In this case the shear modulus exhibits the value of the bulk modulus for both directions and for various cell size, cf. fig. 3.
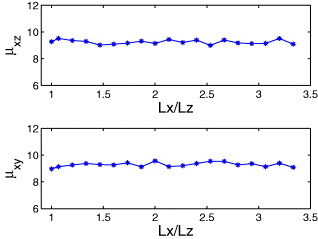
Fig. 3: (Color online) The same as in fig. 2, but with periodic boundary condition.
Download figure:
Standard imageTheoretical explanation
Having observed a tendency towards softening that is very comparable in magnitude to the experimental one, we are now in a position to provide a theoretical explanation. Qualitatively speaking we expect that particles close to the free surfaces should have softer fluctuations in their positions, being less constrained than particles in the bulk. By lowering the volume of the samples we make the contribution of particles at and near the surface more dominant, resulting in an overall softening of the mechanical response. Being equipped with the theory presented above, we can prove this qualitative intuition by examining the eigenvalues and eigenfunctions of the Hessian matrix H and how they depend on the volume. The negative definite term in the amorphous shear modulus can be written in a way that makes the contribution of the eigenvalues of the Hessian explicit by expanding Ξ in the eigenfunctions Ψ(k) of H:

With this in mind we can write the correction term to the Born approximation in the form
where λk is the eigenvalue of the Hessian matrix associated with the eigenfunction Ψ(k).
In ref. [8] it was shown that |ak|2 is roughly system size independent. This is not the case for the eigenvalues. In fig. 4 we show the seven lowest eigenvalues of the Hessian matrix (including the Goldstone mode [2]) multiplied by the volume, and observe the strong decline in these products when Lx/Lz becomes smaller than, say, 1.6. This decline will increase the negative correction term and accordingly will reduce the moduli. It is also obvious why μxz is much more sensitive to this effect than μxy —in the former case, the large top and bottom surfaces are clamped and only the side walls are free to contribute. Upon increasing the ratio Lx/Lz the contribution of the free surfaces decreases, and the shear modulus increases until we reach the value of the bulk. In the latter case, the large top and bottom surfaces are free, contributing to the softening of the system. Clearly, we need large free surfaces to observe a sizeable effect; when we reduce the volume the ratio of surface to volume increases, lowering the overall shear modulus. We can directly prove that the effect is strongly connected to the free surfaces by examining the eigenfunctions associated with the lowest lying eigenvalues. In figs. 5 and 6 we present the first and second eigenfunction by showing the magnitude of elements of the eigenfunctions in real space.
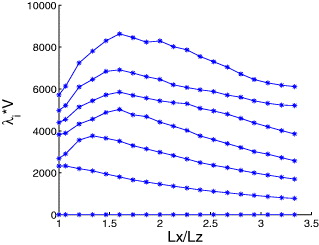
Fig. 4: (Color online) The seven lowest eigenvalues of the Hessian matrix multiplied by the volume of the sample, including the zero eigenvalue which relates to the Goldstone mode. Note the strong decline as Lx/Lz approaches 1.
Download figure:
Standard image
Fig. 5: (Color online) Upper panel: an xz projection by averaging over the y position of the magnitude of the elements of the first nontrivial eigenfunction of the Hessian for the case Lx/Lz = 1.86. Lower panel: the same but for an xy projection, averaging over z. The color code is given on the right. Note the strong concentration on the surfaces.
Download figure:
Standard image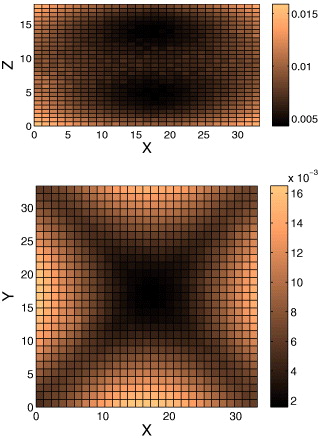
Fig. 6: (Color online) The same as in the previous figure, but for the second nontrivial eigenfunction of the Hessian. Again we see that the lowest eigenvalues belong to eigenfunctions that are strongly concentrated on the surfaces.
Download figure:
Standard imageWe see that both eigenfunctions are strongly concentrated on the surfaces. This is a direct evidence that the lowest eigenvalues of the Hessian, which are responsible for the softest mechanical response, indeed belong to modes that live on the surfaces of our samples as proposed above.
At this point it is interesting to compare the simulation results to similar simulations on crystalline samples of the same range of sizes and the same geometry. We attempted to produce perfect crystalline samples by arranging either "small" or "large" particles on a lattice at zero temperature. We find that when we minimize the energy, surface tension effects destroy the crystalline order near the interfaces, leaving us with bulk crystals with amorphous interfaces, as seen for example in fig. 7.

Fig. 7: (Color online) An example of a crystalline solid in three dimensions. The order of the crystal is distorted due to free surface effect. Note that the blue particles are on the surface and as the color code tends to red we observe bulk crystalline order.
Download figure:
Standard imageWe thus expect to still see an effect of softening when the surface to bulk ratio is reduced, but the effect should be smaller compared to the completely amorphous samples. For the sake of comparison we show normalized values of μxz (normalized to the lowest value) for the three types of samples, amorphous and crystalline with small or large particles. In fig. 8 we see that the crystalline samples show very similar curves for μxz, and the effect is considerably smaller than for the amorphous solid. The relative decrease in the size of the effect is also born out by the values of the lowest eigenvalues of the Hessian matrix (multiplied by the volume) as seen in fig. 9. The eigenvalues times the volume still have a reduction for the largest values of the surface to volume ratio, but the degree of reduction is considerably smaller, cf. fig. 4. We expect that for larger samples (as in the experiment) where the surface to bulk ratio is smaller than in our simulations, the effect will be even smaller than in our present simulations.
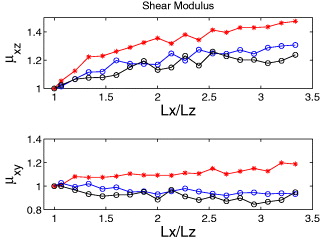
Fig. 8: (Color online) The dependence of the shear moduli on the ratio of the edge size over the height, for an amorphous solid (stars), and a crystalline solid (circles) contains either small or large particles, normalized to the value of the shear modulus of a cube.
Download figure:
Standard image
Fig. 9: (Color online) The same as in fig. 4 but for a crystalline solid. Here the decline is weaker than the case of an amorphous solid.
Download figure:
Standard imageIn summary, we have shown that the main reason that is responsible for the softening of the mechanical response of nano-samples as a function of their size comes from the softer normal modes of the Hessian matrix that are concentrated near the boundaries. These reflect the physics of increased freedom of particles near the surfaces compared to the highly constrained particles in the bulk.
Acknowledgments
This work had been supported in part by an advanced "ideas" grant of the European Research Council, the Israel Science Foundation and the German Israeli Foundation.