


Abstract
Capillary filling dynamics is ubiquitous in biological and natural processes. While capillary imbibition in narrow conduits has been extensively studied in the literature, any generalization in the oscillatory characteristics of the capillary front, typically observed towards the end of capillary filling processes, remains elusive. Considering Newtonian fluids, here, we demonstrate the realization of a unique universal signature of the oscillatory dynamics of the capillary front, by collapsing all relevant data in terms of the pertinent dimensionless parameters, leading to a single master curve. We further delineate the validity of our claim through extensive experiments, using four different fluids, and phase-field numerical simulations. These results may bear far reaching consequences towards explaining the capillary filling processes in a wide variety of applications ranging from nature to energy.
Export citation and abstract BibTeX RIS
Introduction
Capillary filling action, characterized by its passive pumping ability, enjoys the focus of diverse fields of applications ranging from natural science [1–10] to engineering technology [11–19]. With recent focus on modulating reduced scale flows [20–26], surface force generated capillarity transport, thus, forms a favourite tool in cutting-edge microfluidic research [27,28]. Genesis of capillarity holds its inception in the intrinsic interfacial energies of the solid (S), fluid (L) and the vapor (V) phase. While a large number of reported studies on capillary filling dynamics aptly justify its outstanding relevance, the proposition of depicting a universal picture of the oscillatory characteristics of the capillary front, typically observed at the onset of reaching the equilibrium meniscus penetration, remains elusive. This deficit stems from the complexities in generalizing the underlying physical phenomena with the aid of unified normalizing physical parameters.
Here, we bring out a universal depiction of the oscillatory dynamics of capillary filling processes, by appealing to the relevant normalized physical parameters pertinent to Newtonian fluids. We show that the resultant data sets indeed collapse into a signature master curve expressed as a single-valued function of the significant normalized parameters, bearing significant implications towards realizing a generalization in the design principles, thereby encompassing a wide variety of applications ranging from nature to energy. Our comprehensive experiments and computational analysis provide validations to this apparently non-intuitive theoretical proposition.
Reduced-order approach
The most simplistic approach towards predicting capillary filling dynamics follows the classical Lucas-Washburn approach with added inertial effect [1,29,30]. The formulation proceeds with a lumped balance of inertial (FI), surface tension (FS), viscous (FV) and gravitation (FG) forces and its dynamical analysis. Considering a representative cylindrical capillary of radius R  , with the origin located at the capillary entry, the inertial, surface tension and gravitational forces for a capillary rise of z can be written as
  ,
,  and
and  , respectively (see schematics in fig. 1). Here ρ, σ, θ and g represent fluid density, surface tension at the
  interface, contact angle at the
  contact line and gravitational acceleration, respectively. The viscous force may be derived as a first estimation considering a fully developed laminar flow:
  (see the Supplementary Material Supplementarymaterial.pdf (SM)). The balance of these forces essentially predicts the capillary entry dynamics wherein the effect of the vapour phase is usually neglected [3,31].
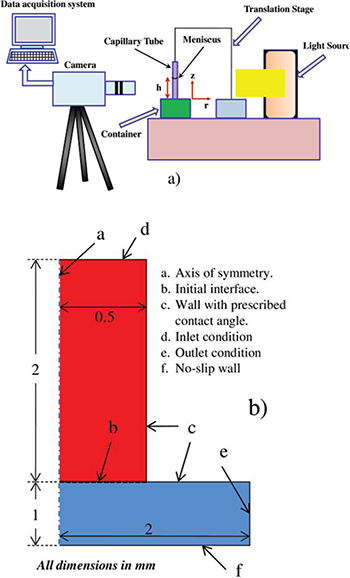
Fig. 1: (a) The schematic of the experimental setup showing the capillary tube with meniscus, imaging apparatus and the coordinate system and (b) the numerical domain (which is 2D axisymmetric) and the boundary conditions.
Download figure:
Standard imageThe simplified analysis as described above lacks the consideration of viscous drag  in the vapour phase (which becomes critical for less viscous fluids and longer channels. [32]) and includes some further idealizations in capturing the details of the capillary filling process. These considerations are as follows: a) loss in the kinetic energy during the downward motion of the capillary front when it is undergoing oscillatory dynamics; b) loss at the entrance region; c) errors incurred due to lack of capturing the capillary meniscus topography; and d) errors for not considering the dynamic contact angle. The loss of kinetic energy can be accounted for through the inclusion of a parameter b (detailed below). The other factors b), c) and d) may be neglected in the model without sacrificing the essential physics of interest. For further details on accounting for the effects from gas viscosity and kinetic energy loss, reported literature can be referred [33,34]. Finally, the modified force balance is non-dimensionalized using the variables
  and
and  . The equivalent dimensionless governing equation for capillary rise, thus, reads (see SM for the derivations)

where  ,
,  and
and  denote the dimensionless Bond number, capillary number and viscosity, while the subscripts f and g denote the quantities for the fluid and vapour phases, respectively.
As mentioned above, during the downward motion of the capillary front, which is undergoing an oscillatory dynamics, the kinetic energy contribution of the liquid column is lost in the effective infinite fluid reservoir [33,34]. This is reflected through the parameter b which holds the value  when
when  (representing the upward motion of the meniscus through a positive velocity) and
  when
when  (representing the downward motion of the meniscus through a negative velocity). Thus, with b = 0, the pure kinetic energy part of the inertial energy, that is now lost in the infinite fluid reservoir, is not accounted for in the resultant force balance while only the instantaneous acceleration of the liquid column contributes to the force balance during the downward motion. From the above governing equation, the dimensionless equilibrium height (or Jurin height,
  ) of the capillary rise, obtained by neglecting the viscous and inertial contributions at the equilibrium state, reads
  . Now, we proceed to obtain the criteria of oscillation during the rise of the capillary front. Therefore, starting from eq. (1) and setting
  , we make the two consecutive transformations via
  and
and  which physically connote the idea of focusing on the dynamics near a magnified region entered around the Jurin height. These transformations recast eq. (1) in the form

that may be recognized as the classical second-order equation for damped oscillator where  and
and  , where
  (details of derivation are in the SM). Equation (2) has a solution of the form
  with the
  . Since the oscillation criterion is given by
  where
where  , one may quickly infer from here that the criterion for the inception of the oscillatory regime of the capillary dynamics is
  . Thus, if the system Bond number exceeds a critical Bond number
  , the system exhibits oscillatory dynamics. Drawing analogies from the dynamics of vibration [35], one finds that in such oscillatory regimes, the ratio of the initial peak overshoot to the equilibrium height (similar to
  , where zp is the maximum height attained by the capillary front during the total oscillatory dynamical process) is given by

where  is the damping factor. The analysis reveals that the argument
  for the function M is only a function of
  (see SM) and, therefore, a plot
  against
  becomes independent of CaM and θ. Considering that one may construct a master curve wherein systems with a wide variety of problem data converge to be represented by a single plot, this realizes an effective generalization. Although not apparent, the dynamical plots related to an annular geometry [36] or a parallel-plate geometry can also be associated with similar master curves through proper non-dimensionalization scheme, thereby, delineating the generalization of the present formulation. Comprehensive experiments and numerical investigations indeed support this apparently non-intuitive conjecture that is reached from an elusively simple theoretical formalism.
Experiments
Our experiments (schematics shown in fig. 1) are performed using capillaries of diameters of the orders of millimeters, while different fluids (with their relevant properties are given in table S1a in the SM) are used in order to explore the various dimensionless numbers appearing in the theoretical formulation. In order to explicitly visualize the oscillation in the filling dynamics, a timeline plot for one experimental set is provided in fig. 2(a). For our experiments, we have used n-heptane, n-hexane, acetone and n-pentane (Merck, 99%) as the wetting fluids and atmospheric air as the non-wetting fluid. Borosilicate glass capillary tubes of 1.1 mm diameter are purchased from Spectrum Marketing (AQCAPS). A cleaning protocol is followed for the capillary tubes where they are first rinsed in isopropyl alcohol and then subjected to ultrasonication for 30 minutes to remove any entrapped moisture [37–40]. Then it is flushed and rinsed with Milli-Q ultra pure water (Millipore India Pvt. Ltd) which is followed by a further ultrasonication of 30 minutes. To enhance the accuracy and reproducibility of the experimental outcomes, each capillary tube is used only once to avoid any chance of contamination. The inner diameters of the capillary tubes are measured from microscopic images of the capillary tube cross-section using standard image processing techniques.
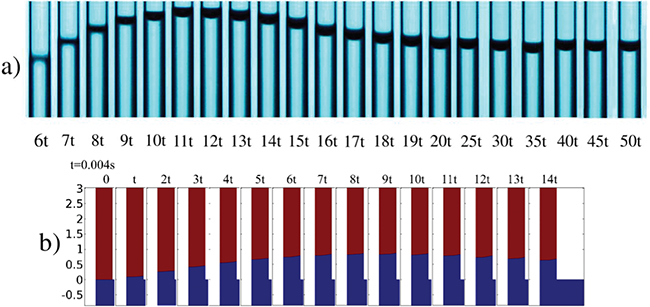
Fig. 2: (a) Capillary filling dynamics of n-hexane through a 1.1 mm capillary tube. Images are taken at 207 frames/s at a resolution of  pixels. Here, the time interval t is 1/207 s, i.e., interval at which the images are captured. (b) Numerical simulation of capillary filling using the phase-field method where the fluid properties used are as follows:
  ,
,  ,
,  ,
,  ,
,  . Such properties are selected to keep the numerical simulation tractable; a larger channel height or higher surface tension would make the domain too large to be able to compute using the present computation resources used. Panel (a) shows the images of the capillary domain as used in the experiments. The images are rescaled to magnify near the equilibrium height region for showcasing the oscillatory response of the capillary front while a supplementary movie Movie_S1.avi for the same case is also presented to display the real-time capillary oscillations. In panel (b) the 2D axisymmetric portion of the domain, where the simulation is carried out, is displayed. The blue coloured section depicts the heavier (displacing) fluid while the red coloured section depicts the lighter (displaced) fluid. An extrapolated 3D version of the above 2D axisymmetric case is presented in the SM while a corresponding movie for the numerical oscillations in the 3D capillary is presented in a supplementary movie Movie_S2.avi.
Download figure:
Standard imageThe spatial movement of the capillary tube is controlled using a high-precision  translation stage (Thorlabs Inc., Newton, New Jersey, United States). The tube is attached to a holder and mounted vertically on the translation stage. The fluid is filled in a glass Petri dish of large diameter to minimize the curvature effects. At the start of the experiment, the capillary tube is lowered slowly towards the Petri dish up to the point of first contact at the interface, from which the rise is measured
  . To capture the time evolution of the capillary meniscus, a high-speed CCD camera (IMPERX: VGA 210), fitted with a macro-lens, is employed along with a diffuse light source. The images are recorded at 207 frames per second at a resolution of
  pixels and the post-processing is carried out using ImageJ software (NIH, MD, USA). The fluids used for the experiments, namely n-heptane, n-hexane, acetone and n-pentane, are known to be volatile in nature, and thus, changes the environmental temperature of the experiments. Since viscosity, density and surface tension are very sensitive to temperature variations, we sought to measure the temperature variation in the experimental conditions. With the ambient temperature around 30 °C, the temperature on the volatile liquid surface on the Petri dish is measured to be 25 °C. We obtained the relevant physical properties of the testing fluids, that is, density
  , surface tension
  and viscosities
  at this temperature and tabulated them with the corresponding references (table S1a in the SM). Moreover, we show that previous experimental data also conforms to our claim (see fig. 3 and table S1b in the SM).
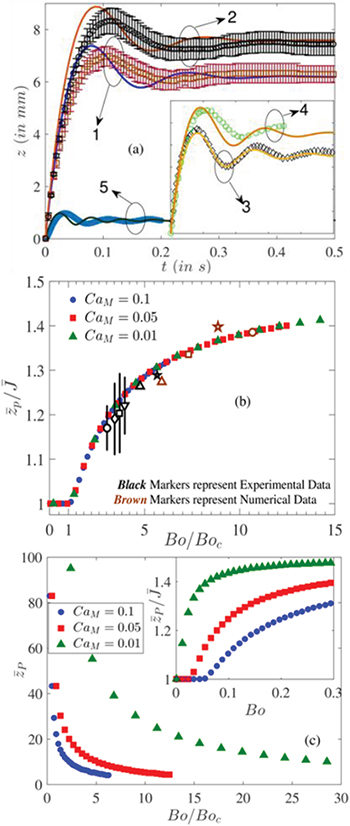
Fig. 3: Collapsing of problem data and assessment with respect to the unified theoretical conjecture. (a) Group 1: n-hexane (with error bar); Group 2: n-heptane (with error bar); Group 3: data from [33]; Group 4: data from [32]; and Group 5: numerical data with  ,
,  ,
,  ,
,  and
and  . The physical properties used in the analytical formalism (results shown by the solid line) are exactly the same as those used in the corresponding experimental and numerical study (results shown using markers). Panel (b) describes the master curve where markers with blue, green and red colours give the plot from the analytical framework having different capillary number. Black markers: diamond —experiment with n-hexane; circle —experiment with n-heptane; square —experiment with n-pentane; inverse triangle —experiment with acetone; pentagon —experiment data from [33]; and triangle —experiments from [32]. Brown markers: circle —data 1; square —data 2; triangle —data 3; and pentagon —data 4 (data for numerical simulations are provided in table S2 of the SM). (c) The variation of the capillary front peak as a function of the ratio
  . Inset: the variation of the
  as a function of the Bond number.
Download figure:
Standard imageTwo-phase modelling
For the computational simulation of capillary rise in the two-phase  system, we employ the phase-field model. Phase-field formalism has been extensively used in studies relating to two-phase systems [41] and finds remarkable matching with analytical [42,43] or experimental results [42,44]. We directly report the dimensionless form for the governing phase-field equations. The dynamics of the phase-field parameter ϕ is given using

where the chemical potential reads as

where Cn and Pe are the dimensionless Cahn number and Peclet number, respectively. The corresponding Navier-Stokes equation governing the two-phase fluid flow reads

along with the continuity of both the phases  . For full details of the formulation, dimensionless numbers and symbols, refer to the SM. For the system domain and corresponding boundary conditions, refer to fig. 1(b) above. We have considered a 2D axisymmetric domain for the 3D simulation which is shown in the SM for visual clarity. The red portion is the cylindrical tube where initially the rarer phase (air) is considered to be present. The Petri-dish–like structure, with blue color, initially houses the denser phase (water) which fills the capillary tube due to the capillarity phenomena. The inlet has the natural pressure gradient due to gravity while the outlet is open to the atmosphere. The other walls (c) have a wetted boundary condition with a specified contact angle. The governing equations along with the boundary relations are solved using the commercial software COMSOL Multiphysics.
Results
Comparison of the experimental and numerical results is pictorially depicted in figs. 2(a) and (b). In fig. 2(a), we delineate the experimental timeline snapshot of the capillary front evolution with time. The figure clearly demonstrates the oscillatory nature of the contact line which eventually attains equilibrium height at large times. Such oscillations are also demonstrated via the phase-field modelling as shown in fig. 2(b) which shows the evolution of the  interface. Since the numerical solutions are solved in axisymmetric configuration, we represent this axisymmetric domain with the idea that it can be easily rotated about its symmetric axis to showcase the 3D viewing of the system. The details of the physical properties used for the experiments and simulation are provided in the caption of figs. 2(a), (b).
Here we begin by describing the physical origin of the oscillations. Although the equilibrium position of the meniscus represents the balance of the gravitational and surface tension forces, the moment when the meniscus approaches the equilibrium position for the first time (when no oscillation has initiated yet), there may be residual inertia forces (due to the initial high kinetic entry energy which is not yet damped by the hindering viscous losses) which propels the meniscus to overshoot the equilibrium position to attain a position that, by virtue of force balance at that section, is unstable. Therefore, the meniscus motion ceases at the point where gravitational forces start to exceed the inertial and surface tension effects and from thereon the meniscus starts to drop due to the action of the gravity. Here the viscous force, by virtue of its nature, opposes the downward motion. Again, the meniscus may have picked up enough inertial force from the gravitational forces that it crosses the equilibrium position. Thus, the phenomenon of oscillation about the Jurin height is observed until the viscous forces quickly dampen out the inertial energy near the equilibrium position. In retrospect, oscillations are not visible for fluids with high viscosity or in channels with very low hydraulic diameter where the viscous effects dominate over inertial effects that are inherently responsible for the occurrence of oscillations. These oscillations are observed in fig. 2(a) (experimental results) and fig. 2(b) (numerical results). An enlarged view around the Jurin height for experimental results and a corresponding video (see supplementary movie Movie_S1.avi) will clearly showcase the above physical expression. For the timeline depiction for the capillary rise in the complete channel, refer to fig. S2b in the SM. Figure 2(b) depicts the phase-field simulation results that have also captured the oscillatory dynamics of the system. The qualitative nature of the oscillations seems similar, which is about the Jurin height. Although these figures present an interesting qualitative understanding of the capillary front oscillations, the intricacies in the underlying physics need detailed attention through proper analysis of the phenomenon and quantification of the same. These will help us to build the base for comprehensive illustration of the characteristic universality that subtly exists across various conditions of the phenomenon.
In fig. 3(a) we attempt to reproduce the experimental observation by employing our analytical framework. The experimental data (depicted using markers) agree reasonably well with the results obtained from the corresponding analytical formalism (depicted by solid lines; the oval structure groups the experimental plot with the corresponding analytical plot). The plots in the main figure reflect in-house performed experimental analysis while those in the inset are data obtained from previous studies. Finally, the plot of group 5 demonstrates the matching between the numerical data and the analytical formulation. All these data points depict a clear impression of the oscillatory nature of the capillary front.
With reasonable good agreement among the generalized analytical approach, comprehensive numerical analysis and experimental data, we next explain the generalization in the master curve. In this curve, plots with blue, green and red markers describe the variation in  as a function of
  . With a given choice of this combination of the coordinate axes, all the data points collapse into a single unique characteristic curve. However, for any other combinations of the coordinate axes, such a master curve will not be observed (as detailed above and explicitly demonstrated in the SM).
One subtle aspect of the master curve shows that as long as  ,
,  remains equal to unity. It shows that until the Bond number exceeds the critical Bond number, the maximum peak attained by the capillary front remains equal to the Jurin height; or, in other words, no oscillation of the capillary front is observed. As soon as
  ,
,  becomes greater than unity showing the oscillatory nature of the curve. At large
  ratios, the oscillation of the capillary front becomes very prominent. The capillary number and contact angle independence of the master curve is not a mere artefact of the analytical formalism but is also reflected in the realistic situations. This is delineated from the experimental and numerical data in a sense that, although performed in completely different dimensional scales, the resultant characteristics closely coincides with the master curve. In the literature, a criterion of oscillation was obtained numerically from numerous simulation results [34] which showed that above a critical ω, expressed by
  , oscillations start occurring. They found that
  . Now, referring back to the present work, we find that the oscillation criterion is
  where the critical Bo is dependent on the capillary number of the flow. Rearranging in terms of the physical parameters
  ,
,  ,
,  , we find
  . Now, the expression on the left-hand side is identical to the parameter ω defined by Masoodi et al. [34]. Thus,
  (since this form came from the criterion equation, we have replaced ω by critical
  ).
).
The slight discrepancy between the analytical and experimental results may be attributed to the fact that phenomena such as entrance effects and capillary interface geometry are not accounted for in the simplistic theoretical analysis [32]. The entrance effect usually acts in a way to dampen the initial inertial energy that the liquid column may gain from the actuating surface tension forces. This is reflected in the first oscillatory dynamics where the maximum attained Jurin height is reduced as compared to that anticipated from the present formalism. Further, such an effect will cause the capillary entry rate to reduce, thereby decreasing the slope of the z vs. t plot (details in the SM). Interestingly, this is exactly the value of critical ω that was obtained numerically, and, thus, it establishes the consistency and universality of our formulation. However, it must be noted that their work has neglected the effect of the viscous drag, which may need to be accounted for while predicting the experimental or numerical trends.
Thus, the actual peak overshoot observed remains slightly below the one predicted analytically (fig. 3(a)). Nevertheless, we comment here that including such higher-order complexities in the analytical solution will compromise on the elegant nature of the theoretical paradigm without adding much to the essential physics governing the oscillatory regimes about the equilibrium (Jurin) height.
As mentioned above, with the choices of the axes  and
and  , the plot portrays a universal depiction of the oscillatory dynamics of the capillary filling phenomenon by collapsing all data, as aptly justified by eq. (3). Our analytical derivations of the dimensionless system characteristics justify that other ways to group the dimensionless number may fail to generate the master curve under the present configuration. To follow up the logic, we proceed with an example to plot with different groupings of the dimensionless numbers. As seen in fig. 3(c), a plot with
  against
  fails to reproduce the universality nature of the problem since the curves show to vary with CaM. Again in the inset of fig. 3(c), we consider the other choices of the dimensional groups, namely,
  plotted against Bo. Yet again, we find that the above choice fails to collapse the different CaM data in a single universal curve.
Conclusion
To summarize, we have discovered a unique universal characteristic of the oscillatory regime observed in capillary filling processes of Newtonian liquids. With a suitable normalization of the relevant parameters having inception from a simple analytically based theory, we show that the resultant generalization can collapse the problem data in the form of a single master curve that remains invariant across experiments. This may turn out to be of profound importance in developing a universal design paradigm for engineered capillary systems having a wide variety of applications ranging from oil recovery to medical diagnostics.