


Abstract
A plasma brush excited by DC voltage is developed with argon as working gas in the ambient air. The time evolution of the discharge current, the light emission, and the sustaining voltage are analyzed under different conditions. The self-pulsing phenomenon of the discharge is observed with oscillated voltage and intermittent current. The self-pulsing frequency ranges from several tens hertz to several hundred hertz depending on the output power and the gas flow rate. It increases with the increasing of the gas flow rate, while it decreases as the output power increases. The phenomenon is explained qualitatively based on a spatially resolved measurement about the discharge.
Export citation and abstract BibTeX RIS
Introduction
Low-temperature plasmas generated at atmospheric pressure attract increasing interest because they can be used in a rich variety of application fields without the need for a vacuum system [1,2], such as low-temperature deposition, etching of thin films, surface modification, biosterilization, generation of ozone, synthesis of carbon nanotubes and aircraft stealth, etc. [3,4]
The electric field required to initiate a discharge at atmospheric pressure is relatively high [5]. Under this circumstance, the discharge is prone to transit to a filament discharge because of instabilities. Therefore, it has become a hot issue to generate a filament-free discharge (diffuse discharge, or homogeneous discharge) at atmospheric pressure, which is called the atmospheric-pressure uniform discharge (APUD) [6–8]. APUD has been investigated in several kinds of discharge devices.
In the late 1980s Okazaki et al. demonstrated the possibilities of generating APUD in dielectric barrier discharge (DBD) configurations [9]. Massines et al. [10] pointed out that APUD in helium could operate in glow mode, which had similar characteristics with the glow discharge at low pressure. In order to prevent the onset of instabilities and prevent the transition from APUD to filamentary discharge, many efforts had focused on lowering the critical electric field for gas breakdown in DBD configurations. APUD was realized in air in a DBD device by inserting a fine mesh into the electrode and the barrier layer [11]; Wang et al. believed that corona discharge around the mesh provided seed electrons for APUD [12]. Park et al. [13] used UV radiation produced in a low-pressure chamber to realize APUD in a high-pressure chamber. Qi et al. [14] employed a spark discharge as an UV preionization source to generate APUD in a 4 mm air gap. Jiang et al. [15] found that air discharge was launched at much reduced voltages by the help of the UV emission from a helium corona. Generally speaking, DBD could easily generate a laminar APUD with a large area, however, the plasma length (gap width) was not large enough for material processing. The applications of APUD in DBD configurations were restrained because only small-scale materials could be processed in the plasma between the narrowly separated electrodes.
In order to eliminate the scale confinement of the materials to be processed, a variety of plasma jets were proposed. Plasma jets generated a uniform plasma plume by blowing plasma out of its generation zone. According to the configurations, plasma jets were divided into two categories [16]. One was the cross-field jet whose electric field was mainly perpendicular to its flow field. The other was referred to as linear-field jet with the electric field parallel to its flow field. Investigation results showed that the APUD in the helium jet was a discharge phenomenon rather than a flow phenomenon [17]. A streamer discharge mechanism was involved to explain the plasma bullet found in the uniform plume [18]. Lu et al. [19] revealed that a N2 plasma plume was driven by the gas flow instead of being driven by the electric field. Plasma jet easily generated APUD with a desirable length, however, the cross-sectional area of the APUD typically covered only a few square millimeters, which was too small for largescale surface treatments. Operating many jets in parallel may be a good idea to generate a uniform plasma with large cross-sectional area, however, only some separated plasma arrays were generated in argon [20].
A uniform plasma plume with relative large area was realized by Li et al. [21], the uniform discharge plume was a superimposition of radially streamers that appeared at different cycles of the applied voltage. The temporal duty ratio of the uniform plume is too low to expect a high efficiency in plasma chemical reactions. A quasi-diffuse plasma jet, originating from a planar dielectric duct with a rectangular exit and issuing a helium APUD plume into ambient air at atmospheric pressure, was reported by Li et al. [22]. Although a diffuse plume was with fairly large cross section area, expensive helium was needed. Obviously, it is desirable to generate a uniform plume in a less expensive gas, such as argon or air. A brush-shaped uniform plasma plume was generated by blowing air through the region between two electrodes, however, the air needed to be preheated to about 2000 K [23].
In this letter, a brush-shaped plasma plume is realized in ambient air with flowing argon as working gas by using a cross-field jet. Although a DC power source is used to initiate the discharge, a self-pulsing phenomenon is observed with oscillated voltage and discharge current. By spatially resolved measurement of the light emission signal, the mechanism of the APUD is investigated.
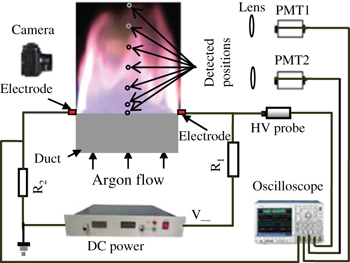
Fig. 1. (Colour on-line) The schematic diagram of the experimental setup.
Download figure:
Standard imageExperimental setup
Figure 1 is a schematic diagram of the experimental setup used for creating the brush-shaped APUD. Two tungsten rods with a diameter of 1.5 mm placed 15 mm apart are connected with a DC power supply (Glassman 15R40) with absolute maximal voltage of 15 kV and maximal current of 40 mA. The two tungsten rods are placed at the outlet of a quartz duct, which has a narrow slit outlet. Argon (99.99%) flows along the duct ( ) and goes into the ambient air through the outlet where the two tungsten electrodes are placed. A ballast resistor (70 kΩ) is connected in series with the cathode. The discharge voltage across the two electrodes is detected by a high-voltage probe (Tektronix P6015A). The discharge current is measured via a shunt resistor (50 Ω) in series with the discharge device. Both the discharge voltage and the current are recorded with a digital oscilloscope (Tektronix DPO4104). Spatially resolved measurements are conducted on the light emission signals (772.4 nm emitted from the argon atom, 4p → 4s transitions) from the APUD. The discharge is firstly imaged by two lens and two apertures are placed on the image planes. The dimension of the image equals to that of the discharge. Two PMTs equipped with optical filters are used to detect the light emission (772.4 nm spectral line from Ar I) behind the apertures (diameter of about 1 mm). By this method, the light emission signals at different positions (detected positions in fig. 1) can be recorded by the oscilloscope simultaneously. The spectral intensity emitted from the discharge can be detected by a spectrometer equipped with a CCD detector (ACTON SP2758, 1340 × 400 pixels) with a grating of 2400 grooves mm−1. The entrance slit opening and the integration time of the CCD detector are maintained at 0.1 mm and 1 s, respectively. By moving the position of an optical fibre that is connected with the spectrometer on the image plane of the discharge, a spatially resolved measurement of the spectral intensity (772.4 nm from Ar I) can be obtained. A digital camera (Canon EOS 7D) is used to record the discharge images, and the exposure time is 40 ms.
Results and discussions
With increasing the voltage across the two electrodes to some extent (about 4 kV), breakdown occurs between the two electrodes. By increasing the discharge current (the output power of the source also increases), a stable discharge can be observed and a brush-shaped plasma plume formed in the vicinity of the outlet. Figure 2 presents the front view (left image) and side-on view (right image) of the discharge with an output power (P) of 200 W. It will be pointed out later that the discharge is self-pulsed. Figure 2 is a time-averaged result in about 10 discharge periods, which corresponds to the exposure time of 40 ms A coordinate (X-axis) is established along the electric field between the two electrodes and the middle point of which is chosen as the X-axis zero. The Y-axis is along the gas flow field and the outlet is chosen as zero.
The spatially resolved intensity of the emission spectrum (772.4 nm from Ar I) is examined and shown in fig. 3. Figure 3 also shows a time-averaged result in about 250 discharge periods. From fig. 3(a), it can be found that the maximal intensity appears at the edge of the discharge and the discharge is almost uniform in the middle. The emission intensity decreases with increasing distance from the outlet. Obviously, a brush-shaped plasma plume with length more than 15 mm is formed in the ambient air.

Fig. 2. (Colour on-line) Front view (left image) and side-on view (right image) of the discharge Other parameters: P = 200 W, 5 L/min gas flow rate and 40 ms exposure time.
Download figure:
Standard image
Fig. 3. The intensity distribution of the spectral line (772.4 nm) along the X-axis (a) and the Y-axis (b). The gas flow rate is 5 L/min, P = 200 W.
Download figure:
Standard imageFigure 4 shows the typical time evolution of the discharge voltage and the discharge current as well as the light intensity emitted from the whole discharge region. It can be found that both the discharge current and the discharge voltage as well as the light emission intensity oscillate. The voltage increases to a maximal value (about 1.8 kV) and abruptly decreases to a minimal value (about 0.2 kV). At the same time, both the discharge current and the light emission present a pulse. The peak time of the discharge current pulse is the same with that of the light emission pulse. The duration time and peak value of the discharge current pulse are about 0.4 ms and 40 mA, respectively, which are almost constant when the output power of the source is changed. The discharge current almost falls to (or close to) zero between two discharge pulses, while the light emission is almost continuous (does not fall to zero between discharge pulses). The light emission has a pulse and a hump which lasts until the forthcoming pulse. Obviously, although a DC power source is used, the discharge voltage and the discharge current as well as the light emission signal have a repetitive pulsed characteristic.
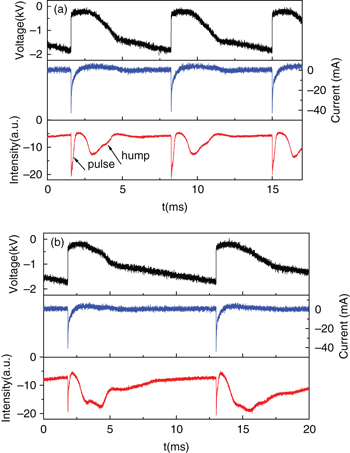
Fig. 4. (Colour on-line) Waveforms of the applied voltage across the two electrodes, the discharge current and the total light emission from the discharge under different I: (a) P = 100 W; (b) P = 380 W, 3 L/min gas flow rate.
Download figure:
Standard imageIt has been checked that the self-pulsing effect does not depend on the ballast resistor or on the output power of the source. However, the oscillation frequency of the discharge does depend on the output power of the source. Figure 5 shows the oscillation frequency as a function of the output power. It can be found that the oscillation frequency decreases in the range from several hundred Hz to several tens of Hz with increasing the output power of the source, furthermore, it increases with increasing the gas flow rate.

Fig. 5. (Colour on-line) The discharge frequency as a function of P.
Download figure:
Standard image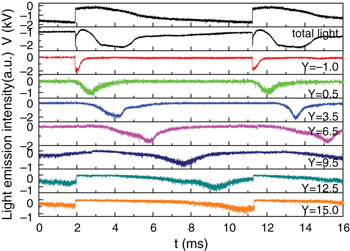
Fig. 6. (Colour on-line) The voltage waveform, the total light waveform and the spatially resolved measurement of the light emission along the Y-axis.
Download figure:
Standard imageSpatially resolved measurements on the light emission signals are conducted along the Y-axis by the optical method mentioned in the experimental setup section, and the result is shown in fig. 6. The peak time of the intraelectrode discharge (Y = −1) corresponds to that of the pulse of the total light emission. The light emission signals at different positions in the plasma plume correspond to the discharge hump of the total light emission. The light emission from the intraelectrode region is used to synchronize the signals at different positions as shown in fig. 6.
Obviously, there will be a peak in the light emission signal in fig. 6 if the discharge passes the position. Therefore, the time lag of the signals at different positions indicates that a light emission zone propagates away from the gas outlet. This phenomenon proves that the APUD plume shown in fig. 2 is actually formed by a moving layer of light emission zone (plasma zone). The plasma leaves the gas outlet after the pulse of the light emission signal and propagates along the Y-axis in the time interval between the discharge pulses (which correspond to the hump of the light emission signal). For the discharge in the position with large Y value (Y > 9), the plasma quenches when the forthcoming pulse comes.

Fig. 7. (Colour on-line) Spatial distribution of the propagating velocity of the discharge along the Y-axis under different gas flow rates (a) and under different P of the power source (b) The gas flow rate in (b) is 3 L/min.
Download figure:
Standard imageThe propagating velocity of the plasma in the plume region can be calculated through dividing the distance of the adjacent positions by its time lag. Consequently, spatial distribution of the plasma propagating velocity can be obtained, as shown in fig. 7. It can be found that the propagating velocity of the plasma is in the order of m/s and it is slightly decreasing with increasing distance from the gas outlet. The propagating velocity of the plasma at the gas outlet equals the gas flow velocity, while it almost has nothing to do with the output power of the source in the range of error. Because the propagation velocity almost equals the gas flow velocity and it varies with changing the gas flow rate, we deduce that the propagation of the plasma in the plume region should result from the gas flow. Consequently, the plasma generated in the intraelectrode region (which corresponds to the pulse in the total light emission signal) is blown out and propagates away from the gas outlet along the gas flow. During its movement, the plasma bends to bridge the two electrodes and to keep the plume discharge. That is to say, the discharge plasma forms an arch, which is similar with that in ref. [23]. As the Y-value increases, the electric field decreases. Therefore, the plasma decays during its propagation along the gas flow in the plume region. Consequently, the light emission intensity decreases along the Y-axis, as shown in fig. 3(b).
It can be deduced from the analysis mentioned above that breakdown in the intraelectrode region firstly occurs when the applied voltage reaches a certain value. The plasma in the intraelectrode region shortens the two electrodes, resulting in a sharp decrease in the discharge voltage across the two electrodes. The plasma column generated in the intraelectrode region is blown out by the gas flow and propagates away from the gas outlet. During its propagation in the plume region, the plasma bends itself to keep the discharge continued. The applied electric filed decreases with increasing the distance from the gas outlet. Consequently, the plasma decays and the plasma impedance increases as the plasma moves along the gas flow. Then the voltage across the two electrodes increases. When the electric field in the intraelectrode region reaches its critical value for the gas breakdown, the next breakdown occurs in the intraelectrode region. The two electrodes are shortened and the voltage decreases sharply again. Therefore, the process mentioned above will repeat.
The voltage across the electrodes is lower for the plume discharge (which corresponds to the hump in fig. 4) than that for the introelectrode discharge (discharge pulse in fig. 4). Even if the intraelectrode discharge and the plume discharge have the same voltage, the electric field is strongest in the intraelectrode region. Therefore, the current value for the intraelectrode discharge is much higher than that for the plume discharge. In fact, the plume discharge current cannot be discerned in fig. 4.
With increasing the output power of the source, more energy is coupled into the decaying plasma in the plume region. The plasma has a higher electron density and a lower plasma impedance when more energy is coupled into. Therefore, the voltage across the two electrodes increases more slowly. Consequently, the oscillation frequency decreases with increasing the output power of the source. With increasing the gas flow rate, the plasma column moves faster to the low electric field region, which means the plasma decays faster. The plasma impedance increases faster too. Consequently, the oscillation frequency increases with increasing gas flow rate.
Conclusions
In conclusion, a uniform plasma plume in a brush shape is generated in the ambient air by blowing argon through two discharge electrodes. Results show that the discharge current and voltage as well as the total light emission oscillate with time. The oscillation frequency decreases with increasing the output power of the source, and increases with increasing gas flow rate. By the spatially resolved measurement of the light emission from the discharge, it is found that the discharge is ignited firstly in the intraelectrode region, which results in a sharp decrease in the voltage across the electrodes. Then the discharge plasma is blown out of the introelectrode region into the plume region. The uniform plume results from the movement of the decaying plasma along the gas flow direction.
Acknowledgments
This paper is sponsored by the National Natural Science Foundation of China under Grant Nos. 10805013, 51077035, Funds for Distinguished Young Scientists of Hebei province under Grant No. A2012201045, the Natural Science Foundation of Hebei province under Grant No. A2011201132, the Key Project of Chinese Ministry of Education under Grant No. 210014, Department of Education for Outstanding Youth Project (Y2011120) and Hebei University Funds for Distinguished Young Scientists (2010-J02).