


Abstract
The TOTEM experiment at the LHC has measured the inelastic proton-proton cross-section at  in a β* = 90 m run with low inelastic pile-up. The measurement was based on events with at least one charged particle in the T2 telescope acceptance of 5.3 < |η| < 6.5 in pseudorapidity. Combined with data from the T1 telescope, covering 3.1 < |η| < 4.7, the cross-section for inelastic events with at least one |η| ⩽ 6.5 final-state particle was determined to be (70.5 ± 2.9) mb. This cross-section includes all central diffractive events of which maximally 0.25 mb is estimated to escape the detection of the telescopes. Based on models for low mass diffraction, the total inelastic cross-section was deduced to be (73.7 ± 3.4) mb. An upper limit of 6.31 mb at 95% confidence level on the cross-section for events with diffractive masses below 3.4 GeV was obtained from the difference between the overall inelastic cross-section obtained by TOTEM using elastic scattering and the cross-section for inelastic events with at least one |η| ⩽ 6.5 final-state particle.
Export citation and abstract BibTeX RIS
Introduction
Inelastic hadron-hadron collisions and their cross-sections [1] have been studied for the last 50 years to understand the soft strong interaction processes governing these interactions. Models for these non-perturbative and diffractive processes have been made and implemented into Monte Carlo (MC) event generators [2] to describe the interactions and the hadronization of the partonic final state. The measurement of the inelastic proton-proton (pp) cross-section at the highest possible collision energy is essential for testing the validity of such models. This paper describes the measurement of the pp inelastic cross-section at  by the TOTEM experiment [3] at CERN's Large Hadron Collider (LHC).
The inelastic cross-section at  has been previously measured by the ALICE [4], ATLAS [5] and CMS [6] experiments. Although these measurements adequately cover the non-diffractive pp final states, they suffer from limited forward acceptance, where events with diffractively excited protons at low masses escape detection. The diffractive mass, Mdiff, coverage of an experiment depends on the maximal |η| coverage of the detectors. In the case of ALICE pseudorapidities |η| ⩽ 5.1, and Mdiff ⩾ 7 GeV were covered, for the one of the CMS measurement |η| ⩽ 2.4, and Mdiff ⩾ 26 GeV, whereas for the ATLAS and the second CMS measurement the analyses were restricted to events with Mdiff ⩾ 16 GeV. For obtaining the overall inelastic cross-section, the fraction of events where all final-state particles are beyond the instrumented region, have been estimated using phenomenological models for low mass diffraction. In the present TOTEM analysis, the model dependence is minimal due to the excellent pseudorapidity coverage: the T2 telescope covers up to |η| = 6.5, allowing the detection of diffractive masses of Mdiff ⩾ 3.4GeV [7].
TOTEM has recently measured the inelastic cross-section at  from elastic scattering using the optical theorem [8, 9]. The inelastic cross-section measurement [9] that includes no assumption on low mass diffraction was used to constrain the contribution of low mass diffraction (Mdiff < 3.4GeV) in this paper.
Experimental setup
The focus of the TOTEM experiment [3] is on the measurement of the total proton-proton (pp) cross-section as well as studies of elastic scattering and diffraction at LHC. The experimental apparatus of TOTEM consists of Roman Pot detectors for measuring leading protons and the forward tracking telescopes T1 and T2 for measuring charged particles produced in inelastic pp collisions [10]. The present analysis is based on data recorded by T1 and T2.
The T1 telescope covers the pseudorapidity range 3.1 ⩽ |η| ⩽ 4.7 and the T2 telescope the range 5.3 ⩽ |η| ⩽ 6.5. Together these telescopes detect about 95% of the inelastic events, with low mass diffraction constituting the dominant missing event category [11, 12].
The T1 telescope is based on cathode strip chambers (CSC) and consists of two arms placed symmetrically at ≈ ± 9 m from the interaction point 5 (IP5). Both arms consist of five planes of six CSCs. These planes are divided into two vertical halves to facilitate the installation around the vacuum chamber. Each CSC covers a region of 60° in the azimuthal angle ϕ. An overlap between any two adjacent CSCs ensures a continuous ϕ coverage for each telescope plane. Each CSC contains a layer of anode wires and two sets of cathode electrodes at a 60° angle with respect to the anode wire direction. This yields a 1 mm precision for the three coordinates for each particle track within a plane and at the same time an important discrimination against electronic noise [10].
The T2 telescope is based on gas electron multiplier (GEM) chambers placed in two arms, consisting of two half-arms each, at ≈ ± 13.5m from IP5. Each half-arm contains 10 semicircular GEM chambers that provide two-dimensional information of the track position covering an azimuthal angle of 192° with a small overlap of two neighboring half-arms along the vertical axis. The chambers have read-out boards with 256 concentric strips each for the radial coordinate measurement and matrices of 1560 pads for the measurement of the azimuthal coordinate and for triggering. The radial and azimuthal coordinate resolutions are 110 μm and 1°, respectively. Read-out of both T1 and T2 is based on VFAT front-end ASICs providing digital output signal and trigger [13].
Detector simulation, reconstruction and alignment
Descriptions of the T1 and T2 telescopes and the material in the forward region as well as the offline reconstruction has been implemented into the TOTEM software [14] that is based on the CMS framework [15] and includes the interfaces to the GEANT4 simulation toolkit [16]. For the inelastic rate measurement, it is vital to understand and quantify the secondary particles produced by the interaction of primary particles with the material in the forward region, especially in front of and around T2, since these secondary particles will enhance the observed inelastic rate. Therefore special emphasis was given to properly tune the simulation of the forward region [17].
The T1 track reconstruction was divided into two steps. A pattern recognition algorithm searched for Δη × Δϕ = 0.1 × 0.2 rad roads containing between 4 and 30 hits on at least 3 different planes, where a hit is defined as a triple coincidence of anodes and cathodes in one chamber. The number of hits and road size had been optimized with simulation to have the best compromise in terms of tracking efficiency and computing time. An iterative track fitting algorithm was then applied to each road [18]. A straight-line fit, separate for xz and yz projections, was successfully used to reconstruct the trajectories of particles with transverse momentum pT ⩾ 100 MeV. The event reconstruction efficiency for an individual T1 arm was estimated to be about 98% using simulations with data-tuned CSC efficiencies.
The T1 telescope alignment was done in three steps using reconstructed hits and tracks. The first step was a χ2 minimization aligning the transverse coordinates of the 5 chambers of each T1 sextant with respect to each other. The second step aligned the 6 sextants of each T1 arm with respect to each other, using the tracks reconstructed in the overlap regions between adjacent sextants. The final step aligned the two arms with respect to each other and with the beam using the capability of T1 to reconstruct the three coordinates of the primary vertex [10]. The position of each chamber was known to about 4 mm and <100 μm precisions in z and in the xy-plane, respectively.
Track reconstruction in T2 [19, 20] was done using a simplified Kalman filter-like algorithm. Trajectories of particles with pT of 40 MeV and above were successfully reconstructed using a straight-line fit because of the low magnetic field and the small amount of matter traversed in T2. The minimum requirement for the straight-line fit was 4 hits (pad clusters with or without an overlapping strip cluster), of which at least 3 had a pad/strip cluster overlap. The event reconstruction efficiency for an individual T2 arm was estimated to be about 99% using simulations with data-tuned chamber efficiencies.
Both the relative alignment of the chambers within a T2 half-arm (internal alignment) and the overall alignment of the chambers with respect to their nominal position (global alignment) had been carefully investigated; the transverse positions of chambers inside each T2 half-arm were known with <30 μm precision, the shifts in the transverse plane of each T2 half-arm with about 1 mm precision and the tilts with respect to the beam axis with about 0.4 mrad precision.
Data taking and trigger
The inelastic cross-section measurement is based on ≈82.8 μb−1 of pp collisions at  recorded in October 2011 during a special β* = 90 m optics fill with low inelastic pile-up (about 3%) conditions. During this fill, each beam consisted of one high-intensity (6·1010 protons) colliding bunch, one non-colliding bunch of similar intensity and thirteen low-intensity (1–2·1010 protons) colliding bunches. Only events recorded during the collisions of the high-intensity bunches were considered for the present analysis to minimize the systematics in the luminosity measurement. The non-colliding bunches were used for determining the beam-gas background and the four low-intensity colliding bunch pairs with highest instantaneous luminosity for cross-checks of various analysis steps.
The runs analyzed included events triggered by the T2 detector as well as a zero-bias (bunch crossing) trigger stream. The requirement of having at least one charged particle in any T2 half-arm was achieved by a trigger road consisting of at least 3 "superpads", each with 3 radial and 5 azimuthal neighboring pads, firing in the same r-ϕ sector of different planes of the same T2 half-arm. The zero-bias trigger stream provided an unbiased sample to estimate the trigger inefficiencies, the pile-up probability and the relative fraction of inelastic events with tracks in T1 but no tracks in T2.
The data sample was grouped into five data subsets (DS): 1a, 1b, 1c, 2 and 3. This grouping was chosen to be compatible with the elastic analysis [9] for the luminosity-independent total cross-section measurement as well as to measure the time-dependent behavior in the data due to the decreasing beam intensity during the data taking. The number of T2 triggered inelastic events and the integrated luminosity of each subsample is shown in table 1. In this paper, a 4% uncertainty is used for the luminosity measured by CMS. The luminosity determined from the elastic and inelastic rates using the optical theorem together with the luminosity-independent total pp cross-section is the subject of another paper [21].
Table 1:. Description of the five data subsets. The second column gives the number of observed inelastic events and the third one shows the integrated luminosities of the different subsets.
| Subset | Inelastic events |
 [μb−1] [μb−1] |
|---|---|---|
| DS 1a | 1.14M | 17.0±0.7 |
| DS 1b | 1.78M | 26.6±1.1 |
| DS 1c | 1.64M | 24.5±1.0 |
| DS 2 | 0.55M | 8.2±0.3 |
| DS 3 | 0.44M | 6.6±0.3 |
| Total | 5.54M | 82.8 ± 3.3 |
Selection and analysis
Inelastic-rate measurement
The observed inelastic rate was given by the number of T2 triggered events. Several corrections had to be applied to obtain the true inelastic rate and these were made in three steps. In a first step, all corrections necessary to obtain the inelastic rate corresponding to the cross-section of events with at least one particle in the |η| acceptance of T2, σinel,T2vis, were made. In the next step, all corrections needed to acquire the rate corresponding to the cross-section of events with at least one final-state particle with an |η| lower than the maximal T2 |η| acceptance of 6.5, σinel,|η|⩽6.5, were applied. In a final step, the correction for events with all final-state particles beyond an |η| of 6.5 was made to attain the rate corresponding to the total inelastic cross-section, σinel.
For the analysis, the events were divided into three categories: events with tracks in both hemispheres ("2h"), i.e. with tracks in both T2 arms on opposite sides of the interaction point, constituted mostly by non-diffractive minimum bias and double diffractive events, and events with tracks in only the negative T2 hemisphere ("1h − ") or the positive T2 hemisphere ("1h + "), dominated by single diffractive events. Beyond the physics motivation, this classification was dictated by different trigger efficiency and beam-gas background corrections to be applied to the three categories.
Corrections for obtaining the T2 visible inelastic rate
The beam-gas background was estimated by performing an identical analysis on the events corresponding to the two non-colliding bunches. This estimate was done separately, as a function of the event T2 track multiplicity, for each event category and data subset, since the intensities of both the colliding and non-colliding high-intensity bunches of each beam were slightly different and the relative fraction of beam-gas background increased with a decreasing instantaneous luminosity during the data taking. The correction to the event rate with a certain T2 track multiplicity, nT2, was −0.9·(N(nT2)T2tr,non−coll/N(nT2)T2tr,coll), where N(nT2)T2tr,coll (N(nT2)T2tr,non−coll) was the number of T2 triggered events with nT2 for the (non-)colliding high-intensity bunch. The factor 0.9 was to take into account the bunch intensity difference. The average correction, weighted with the observed nT2 distribution of the data, is shown for the different data subsets in fig. 1 for "1h" events. No correction was applied to "2h" events since the beam-gas background is only significant for "1h" events due to its fixed target nature. On the overall rate, the subtraction of the beam-gas background gave a 0.6% relative correction.
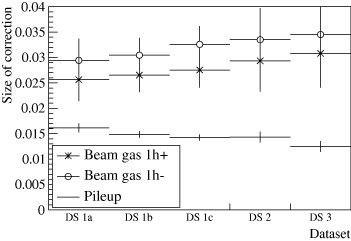
Fig. 1: The size of the beam-gas background and pile-up corrections in the different data subsets. The beam-gas correction for the event category with tracks only in the positive T2 arm ("1h + ") and only in the negative T2 arm ("1h − ") is shown with stars and circles, respectively. The pile-up correction applied to the overall event rate is shown without markers.
Download figure:
Standard imageAs a cross-check, the same analysis was performed on the events triggered by the four low-intensity colliding bunches described above. After applying all corrections that alter the fraction of "1h" events, this fraction was found to be consistent in the two samples giving confidence on the method to estimate the beam-gas background. The relative systematic uncertainty of the beam-gas correction was estimated to be 0.4% that corresponded to the maximal variation of the background that gave a compatible fraction of "1h" events in the two samples.
A correction factor for the trigger inefficiency was determined, per event category as a function of nT2, in the zero-bias triggered event sample as N(nT2)0bias/N(nT2)T2tr,0bias, where N(nT2)0bias (N(nT2)T2tr,0bias) was the number of T2 (triggered) events with nT2. The trigger inefficiency correction for the different event categories as a function of nT2 is shown in fig. 2. The correction was significant for events with nT2 of one, rapidly decreasing to zero for nT2 of 10 or more. About half of the trigger efficiency loss was due to events containing only secondaries that entered T2 at large angles and thus did not satisfy the trigger-road condition. As seen from fig. 2, the correction was significantly different for the two arms and the "2h" correction lay between the single-arm ones since it was a combination of the two individual arms. The trigger inefficiency gave a 2.3% relative correction to the total rate. The T2 trigger inefficiency correction was applied to the beam-gas background corrected inelastic rates.
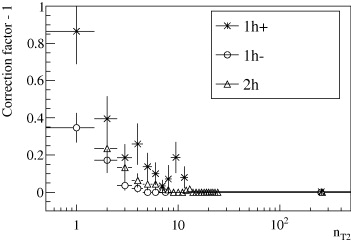
Fig. 2: The correction factor for the T2 trigger inefficiency as a function of the T2 track multiplicity, nT2, for the different event categories. The correction factor for events with tracks in both T2 arms ("2h") is shown as triangles, with tracks only in the negative T2 arm ("1h − ") as circles and with tracks only in the positive T2 arm ("1h + ") as stars.
Download figure:
Standard imageTo determine the systematics of the trigger inefficiency correction, the T2 trigger performance and efficiency with a pointing track requirement were studied on zero-bias triggered data. In the trigger performance study, the trigger roads were reconstructed offline from the pad data to examine the correspondence between the T2 data and the T2 trigger. To remove events with only secondaries, a pointing track requirement of |Zimpact| [19] less than 8 m was used. Both studies and their differences with the applied correction for the T2 trigger inefficiency indicated that the systematics of the trigger inefficiency correction to the overall rate were not larger than 0.7%. After the T2 trigger inefficiency correction, the different event categories in each data subset were summed, since the remaining corrections to the inelastic rate were made with respect to the overall inelastic event rate.
The measured inelastic rate was affected by pile-up and a correction factor was determined using the zero-bias trigger stream. By calculating the fraction of bunch crossings with no T2 tracks in the zero-bias triggered event sample, the average probability to have a bunch crossing with tracks in T2, νT2, was determined to be ≈ 0.029 assuming a Poisson probability. Then the pile-up correction factor was 1 + [f(n ⩾ 2,νT2)/f(n ⩾ 1,νT2)], where f(n,νT2) is the Poisson probability for n inelastic pp collisions with tracks in T2 in the same bunch crossing with νT2 being its mean. The pile-up correction was determined for each data subset separately to take into account the decrease of the correction with decreasing beam intensity as shown by fig. 1. On the overall rate, the pile-up gave a 1.5% relative correction. The systematic uncertainty of the pile-up correction was estimated to be 0.4% from the combination of the variation of νT2 within the zero-bias triggered data sample of each subset and the systematic uncertainty on νT2 due to the T2 event reconstruction efficiency.
The T2 event reconstruction inefficiency was estimated using three different Monte Carlo (MC) event generators: PYTHIA8 [22], PHOJET [23] and QGSJET-II-03 [24]. The observed inefficiencies in MC were scaled to obtain a fraction of "1h" events consistent with data. The fraction of "1h" events in data, after correcting for the effects of beam-gas background, trigger inefficiency and pile-up, was 0.222 ± 0.007. The average probability of not reconstructing events with simulated particles in the geometrical acceptance of T2 was found to be 1.0%. This included two effects: the charged-particle reconstruction inefficiency in T2 and the fraction of events with only neutral particles within the T2 acceptance. Since the largest part of the correction was due to the latter that, in addition, is model dependent, the corresponding systematic uncertainty was taken to be half of the correction, i.e. 0.5%, so that it also included the variations between the different MCs.
Further corrections to obtain the inelastic |η| ⩽ 6.5 rate
Since the T1 detector was not used for triggering, an additional correction had to be applied for the fraction of events with no final-state particle in T2, but one or more in T1. This "T1-only" correction was estimated by looking at the zero-bias trigger stream, where the ratio of the number of events with tracks in T1 but none in T2 over the number of events with tracks in T2 was estimated to be (1.6 ± 0.4)%. The zero-bias trigger stream for the non-colliding bunches was checked to verify that these events did not include any significant fraction of beam-gas events. In addition, the T2 reconstruction inefficiency correction part, 0.5%, that would be recovered by the "T1-only" correction was subtracted to avoid double counting. This reduced the uncertainty due to T2 reconstruction inefficiency to 0.25%, half of the remaining correction.
Some events have an internal rapidity gap covering one whole T2 arm and are missing from the inelastic rate if, in addition, they have no track in the other T2 arm and in neither T1 arm. The fraction of such events was estimated from data by first examing events with tracks in only one T2 arm and also in the opposite T1 arm. The probability of an internal rapidity gap covering the T1 arm in between was determined to be (5.6 ± 0.5)% from this event sample. The observed T1 gap probability is compatible with predictions [25] when the 100 MeV pT threshold of T1 is taken into account. To estimate the equivalent probability of a rapidity gap covering T2, the T1 gap probability was rescaled [26] according to the different η ranges of the two detectors. In addition, the reduction of the average multiplicity in the T2 region [19] with respect to the T1 region [27], the lower effective transverse momentum threshold (≈40 MeV in T2, ≈100 MeV in T1) and the reduction of the gap survival in the T2 region due to interactions with surrounding material, were taken into account. Finally, to obtain the overall rate correction, the estimated T2 gap probability, (15 ± 5)%, was scaled to the fraction of events in data with tracks covering one whole T2 arm but no tracks in T1, to avoid double counting with the "T1-only" correction, giving a correction of (0.35 ± 0.15)%.
The measurement of the inelastic rate still misses part of the central diffractive (CD) events, because the final-state particles in these events are very forward particles or particles produced in the central region |η| < 3.1. Based on a PHOJET [28] simulation and taking into account the uncertainties of the description of low mass CD cross-section and rapidity distribution of the centrally produced hadronic system, maximally 25% of CD events are estimated to give no tracks in neither T2 nor T1. The predicted CD cross-section at LHC ranges approximately between 0.1 and 1 mb [28–30]. Since the CD cross-section is not known, a relatively large CD prediction of 1 mb was used to give a 0.25 mb upper limit for the missing CD part corresponding to 0.35% of the inelastic rate. As this is only an upper limit and the uncertainties are large, no correction was applied to the inelastic rate but the upper limit was taken as an additional source of systematic uncertainty.
To be able to estimate the low mass diffraction contribution correctly, the amount of events with all primary particles produced at |η| > 6.5 and detected by T2 due to secondaries, was estimated using QGSJET-II-03. The correction, 0.4%, has been applied to the T2 visible inelastic rate. Due to significant model dependence, its uncertainty was estimated to be half of the correction, i.e. 0.2%.
Additional correction to obtain the full inelastic rate
To obtain the full inelastic rate, an additional correction for low mass diffraction with all final particles at |η| > 6.5 had to be applied to the T2 visible rate. The importance is illustrated by fig. 3 that shows both the diffractive mass Mdiff distribution for one MC (QGSJET-II-03) as well as the combined T1 and T2 acceptance as a function of Mdiff for all the three MCs used. The Mdiff distribution is expected to peak at masses of 1–2 GeV, whereas the acceptance is smoothly changing from 0% to 100% from about 2 GeV to 10 GeV, and thus implying that a majority of the events below 3 GeV will not be detected. The T2 acceptance edge of |η| = 6.5 corresponds to a diffractive mass of about 3.4 GeV (at 50% efficiency). The contribution of low mass diffraction has been estimated with QGSJET-II-03 [24], which can well describe the measurements of low mass diffraction at lower energies [31]. The prediction was scaled to the observed fraction of "1h" events as for the T2 event reconstruction correction and gave a correction of 4.2%, resulting in the largest correction to the inelastic rate. Due to the large uncertainty of low mass diffraction, the systematic uncertainty was estimated to be half of the correction, 2.1%. This uncertainty covers also the other predictions studied [22, 23, 26].

Fig. 3: The acceptance of the combined T1 and T2 detector as a function of the diffractive mass for PYTHIA8, PHOJET and QGSJET-II-03 and the diffractive mass distribution (dN/dMdiff) for QGSJET-II-03 in single diffractive events.
Download figure:
Standard imageA summary of all corrections and all uncertainties is shown in table 2.
Table 2:. Summary of corrections and systematic uncertainties. The first column gives the source, the second column the size of the correction, the third column the systematic uncertainty related to the source and the fourth column for which rates and cross-sections (σ's) the correction and/or uncertainty has to be applied.
| Source | Correction | Uncertainty | Applies to |
|---|---|---|---|
| T2 trigger | 2.3% | 0.7% | all rates and σ's |
| Beam gas | 0.6% | 0.4% | all rates and σ's |
| Pile-up | 1.5% | 0.4% | all rates and σ's |
| T2 reconstruction | 0.5% (1.0%) | 0.25% (0.5%) | |η|⩽6.5 and full inelastic (T2 visible) rates and σ's |
| T1 only | 1.6% | 0.4% | |η|⩽6.5 and full inelastic rates and σ's |
| Internal gap covering T2 | 0.35% | 0.15% | |η|⩽6.5 and full inelastic rates and σ's |
| Central diffraction | 0% | 0.35% | |η|⩽6.5 and full inelastic rates and σ's |
| Low mass diffraction (seen) | 0.4% | 0.2% | |η|⩽6.5 rate and σ |
| Low mass diffraction | 4.2% | 2.1% | full inelastic rate and σ |
| Luminosity | – | 4.0% | all σ's |
Results
The inelastic pp cross-section at  has been measured using the inelastic rate together with the luminosity determination from CMS. The uncertainty on the luminosity, estimated to be 4%, constituted the largest uncertainty on the cross-section determination. The measured inelastic cross-sections are summarized in table 3. The inelastic cross-sections obtained from the different data subsets are well within the uncertainties of the analysis. Therefore, the values given in table 3 are the luminosity weighted averages of the cross-sections obtained from the different data subsets.
Table 3:. Result summary with detailed uncertainty estimates. σinel,T2vis, σinel,|η|⩽6.5 and σinel,|η|>6.5 refer to the cross-sections for events with at least one final-state particle within the T2 acceptance, with at least one final-state particle in the range |η| ⩽ 6.5 and all final-state particles in the range |η| > 6.5, respectively. The statistical uncertainty includes also the statistical precision of the corrections to the rate when data was used. The systematic uncertainties on the rates and luminosities correspond to those presented in table 2. The right-most column gives the full uncertainty, combining the uncertainties in quadrature. For σinel,|η|>6.5, deduced from the difference between the TOTEM σinel measurement [9], obtained from elastic scattering, and the present direct σinel,|η|⩽6.5 measurement, the correlations of the systematic uncertainties have been taken into account.
| Cross-section [mb] | Value | Statistical | Systematic rate | Systematic lumi | ⇒ Full |
|---|---|---|---|---|---|
| σinel,T2vis | 69.73 | ±0.08 | ±0.72 | ±2.79 | ⇒±2.88 |
| σinel,|η|⩽6.5 | 70.53 | ±0.08 | ±0.77 | ±2.82 | ⇒±2.93 |
| σinel | 73.74 | ±0.09 | ±1.74 | ±2.95 | ⇒±3.43 |
| σinel [9] | 73.15 | ±1.26 | |||
| σinel,|η|>6.5 | 2.62 | ±2.17 |
Summary and interpretation
Based on inelastic events triggered by the T2 telescope, complemented by T1 telescope data, TOTEM determined the inelastic proton-proton cross-section to be σinel = (73.7 ± 3.4) mb during a β* = 90 m optics run at  in October 2011. This is well in agreement with the previous TOTEM measurements [8, 9], deduced from the difference of the total and elastic cross-sections. The new measurement is also compatible with the measurements by ALICE [4], ATLAS [5] and CMS [6] experiments with the additional advantage of measuring events down to lower diffractive masses (⩾3.4 GeV compared to ⩾7, 16 and 26 GeV, respectively) and thus has less model dependence.
Albeit the large pseudorapidity coverage, low mass diffraction remains the second largest uncertainty of the inelastic cross-section measurement after the luminosity. An estimate of the contribution of low mass diffraction was obtained by comparing the full inelastic cross-section measurement, σinel = (73.15 ± 1.26) mb [9], obtained from elastic scattering, that by construction includes no assumptions about low mass diffraction, with the present inelastic cross-section measurement of non-diffractive and diffractive events with Mdiff ⩾ 3.4 GeV, i.e. σinel,|η|⩽6.5 = (70.5 ± 2.9) mb. From their difference, σinel,|η|>6.5 = (2.62 ± 2.17) mb, an upper limit of 6.31 mb for the cross-section for diffractive events with Mdiff < 3.4 GeV was obtained at 95% confidence level using Bayesian statistics with a prior equal to zero for non-physical values and constant elsewhere [1].
Outlook
The luminosity-independent total pp cross-section is the subject of another article [21]. Furthermore, using the same data the cross-sections of the individual diffractive processes will be determined. In addition, with the data taken during 2012 the total, inelastic and elastic pp cross-section will be determined at  .
.
Acknowledgments
We thank M. Ferro-Luzzi and the LHC machine coordinators for scheduling and providing us the dedicated TOTEM runs. We are very grateful to the CMS Collaboration for providing us the software framework where all the toolkits used for the analysis reported here have been developed as well as their luminosity determination for the October 2011 β* = 90 m run. We express our gratitude to the CERN PH-ESE and TE-MPE-EM groups (in particular R. De Oliveira) for the production of the GEM chambers and the PNPI for the production and testing of the CSC chambers. We are grateful to V. Khoze and S. Ostapchenko for valuable discussions, especially on low mass diffraction, and to R. Ulrich and C. Baus for their help with QGSJET-II-03. This work was supported by the institutions listed on the front page and partially also by NSF (US), the Magnus Ehrnrooth Foundation (Finland), the Waldemar von Frenckell Foundation (Finland), the Academy of Finland, the Finnish Academy of Science and Letters (The Vilho, Yrjö and Kalle Väisälä Fund), the OTKA grant NK 101438, 73143 (Hungary) and by the NKTH-OTKA grant 74458 (Hungary).