


Abstract
We use the hard (Lipatov) pomeron for the low-x gluon distribution and provide a compact formula for the ratio  that is useful to extract the charm structure function from the reduced charm cross-section, in particular at DESY HERA. Our results show that this ratio is independent of x and independent of the DGLAP evolution of the gluon PDF. As a result, we show that the charm structure function and the reduced charm cross-section exponents do not have the same behaviour at very low x. This difference is independent of the input gluon distribution functions and predicts the non-linear effects and some evidence for shadowing and antishadowing at HERA and RHIC.
Export citation and abstract BibTeX RIS
Introduction
Precise measurements of the charm inclusive scattering cross-section at the ep collider are important for the understanding of charmed meson production. In the one-photon exchange approximation the neutral current, charmed meson production in deeply inelastic ep scattering is via this reaction

In the case of pure photon exchange, the totally inclusive cross-section of the deep inelastic lepton-proton scattering (DIS) has the form

where the reduced cross-section is defined as

and Y+ = 1 + (1 − y)2. Here Q2 is the squared four-momentum transfer, x denotes the Bjorken scaling variable, y = Q2/sx is the inelasticity, with s the ep center-of-mass energy squared, and α is the fine-structure constant. The structure functions F2 and FL are related to the cross-sections σT and σL for the interaction of transversely and longitudinally polarized virtual photons with protons [1]. At small values of x, FL becomes non-negligible and its contribution should be properly taken into account when the F2 is extracted from the measured cross-section. However, the contribution of the longitudinal structure function FL to the cross-section is sizeable only at large values of the inelasticity y, in most of the kinematic range the relation σr ≈ F2 holds to a very good approximation. The same is true also for the contributions  and
and  to F2 and FL due to the charm quarks.
In perturbative QCD (pQCD) calculations, the production of heavy quarks at HERA proceeds dominantly via the direct boson-gluon fusion (BGF) where the photon interacts with a gluon from the proton by the exchange of a heavy-quark pair [2]. The charm production contribution to the DIS cross-section data was found to be around 30% F2 at HERA [3, 4]. The deeply inelastic heavy-flavour structure function contribution to the cross-section is given by

A measurement of the longitudinal charm structure function at low x at HERA is important because the  contribution to the charm cross-section can be sizeable. At small values of x,
  becomes non-negligible and its contribution should be properly taken into account when the
  is extracted from the measured charm cross-section. This has been done, for example for the H1 charm data, by making an NLO QCD fit in the DGLAP formalism such that the correction necessary for
  is calculated in this formalism. Instead of this procedure, we propose to use the expression 4 with the quantity Rc determined in NLO approximation, which has the advantage of being independent of the gluon PDF. This simplifies the extraction of
  from the measurements of
  .
.
In this paper, the charm structure function is evaluated from the charm reduced cross-section (4) where the ratio of the charm structure functions, Rc, is calculated in a more robust NLO approximation. We propose to use the hard (Lipatov) pomeron behaviour of the charm structure functions and determine the ratio of the charm structure functions  from this behaviour in the limit of low
  . Assuming the low x asymptotic behaviour of the gluon PDF to be of the type G(x,Q2)∝1/xδ
(G(x,Q2) = xg(x,Q2)), we provide numerical results for the ratio
. Assuming the low x asymptotic behaviour of the gluon PDF to be of the type G(x,Q2)∝1/xδ
(G(x,Q2) = xg(x,Q2)), we provide numerical results for the ratio  for values of the parameter δ = 0 or δ = 0.5, the first value corresponds to the soft pomeron and the second value is corresponding to the hard (Lipatov) pomeron intercept. However, our analysis shows that the predictions for Rc with hard-pomeron intercept describe with good accuracy the low-x predictions to NLO, and this analysis is independent of the DGLAP evolution of the gluon PDF. In this method, the charm structure function is determined without the prior knowledge of the longitudinal charm structure function.
Finally, our predictions show that the charm structure function exponents have the same behaviour as the reduced charm cross-section exponents only for a particular range of x values. The structure of this article is as follows. In the second section we present the basic formalism of our approximation method with a brief review of the calculational steps. The connection of the ratio of the charm structure functions with the hard (Lipatov) pomeron intercept is also given. We then present the results for the charm structure function with NLO corrections and show that our method reproduces the HERA results for the charm structure function obtained by the H1 Collaboration with the help of more cumbersome NLO estimations. In the third section we give the predictions for the charm structure function exponents with respect to the reduced charm cross-section exponents at low x. These results are discussed in the last section.
The hard (Lipatov) pomeron approach to the charm structure functions
In the low-x range, where the gluon contribution is dominant, the charm quark contribution Fck(x,Q2,m2c)(k = 2,L) to the proton structure function is given by this form
where  and we neglect the
  fusion subprocesses. Here G(x,μ2) is the gluon distribution function and the mass factorization scale μ, which has been put equal to the renormalization scale, is assumed to be either μ2 = 4m2c or μ2 = 4m2c + Q2. In the above expression Ccg,k is the charm coefficient function expressed in terms of LO and NLO contributions as follows:
where  and in the NLO analysis

with  (nf is the number of active flavours).
In the LO analysis, the coefficient functions BGF can be found [5–7], as
and

where  .
.
At NLO, O(αemα2s), the contribution of the photon- gluon component is usually presented in terms of the coefficient functions  . The NLO coefficient functions are only available as computer codes [8,9]. But in the high- energy regime (ζ ≪ 1) we can use the compact form of these coefficients according to refs. [10, 11].
Applying the low-x behaviour of the gluon distribution function according to the hard (Lipatov) pomeron [12–14]

in eq. (5), integrating the gluon kernel over  and finally summing over the gluon distribution function yields
where

Therefore the ratio of the charm structure functions is given by
In fact, this equation which is independent of the gluon distribution function, is very useful for practical applications.
We insert this expression in eq. (4) to find

or

This equation relates the charm structure function to the reduced charm structure function via BGF kernels. We observe that the right-hand side of eq. (15) is independent of the longitudinal charm structure function and gluon distribution function, and this formula can reproduce the HERA results for the charm structure function from the reduced charm cross-section.
The charm structure function exponent behaviour
A striking discovery at HERA [2] for the charm productions has been the rapid rise of  with the energy W2 at each fixed Q2 and small x values. This rapid rise is associated with the exchange of an object known as the hard (Lipatov) pomeron. In this powerful approach the charm structure function has been found to have the same hard (Lipatov) pomeron behaviour [15–17]. This rise has been quantified by a study of the observable
where the brackets mean that this effective intercept ( ) is obtained from a fit of the form
  at fixed Q2 and small values of x. We analyse the H1
  data with a view to extracting such an x dependence. For this purpose, from eq. (4), we have the following form:
We would to like to remark that

where
or

Here s is the square of the total c.m. energy (which is constant at HERA). As shown in fig. 1, the Rc behaviour is almost independent of x at all Q2 values. Δλ is independent of the gluon distribution, depending only on the BGF kernels. We shall analyse it for both small- and large-y data.

Fig. 1: The ratio  as a function of x for different values of Q2 at δ ≃ 0 and δ ≃ 0.5.
Download figure:
Standard imageResults and conclusions
We have analysed H1 data on charm production [3] and compared with DL model [15–17] based on the hard-pomeron exchange and also with the color dipole model [18] and the GJR parametrisation [19]. Our numerical predictions are presented as functions of x for Q2 = 12, 20, 35, 60, 120 and 200 GeV2. The ep center-of-mass energy is  , with a proton beam energy of Ep = 920 GeV and electron beam energy of Ee = 27.6 GeV and also the average value Λ in our calculations is corresponding to 224 MeV.
In figs. 1 and 2 we show the predicted ratio of the charm structure functions, Rc, as a function of x and Q2. As can be seen from these figures Rc is almost independent of x for x < 0.01 in all Q2 region. Also it is independent of the choice of the gluon distribution function, where approaches based on perturbative QCD and on kT factorization give similar predictions [20–22]. The effect of Rc on the corresponding differential charm cross-section should be considered in the extraction of Fc2, so in table 1 we give the average of this ratio for various Q2 values. We see 〈Rc〉 ≈ 0.1 for a wide region of Q2. In principle, the parameter δ has two value δ = 0.08 and δ = 0.44. The first one is corresponds to the soft-pomeron exchange and the second one is corresponds to hard-pomeron exchange. Our analysis shows that the predictions for Rc depend weakly on δ, as it is less than 15% in the entire region of Q2. Therefore, our approximation method for Rc with hard-pomeron behaviour describes with good accuracy the low-x predictions for Rc when compared with results ref. [10] at NLO analysis (fig. 1 in ref. [10]).

Fig. 2: The ratio  as a function of Q2 values at δ ≃ 0 and δ ≃ 0.5.
Download figure:
Standard imageTable 1. The predictions for the ratio  as a function of Q2 corresponding to the cases of hard and soft pomeron.
| Q2 (GeV2) | 〈Rc〉 (δ≃0.5) | 〈Rc〉 (δ≃0) |
|---|---|---|
| 12 | 0.078 | 0.066 |
| 20 | 0.092 | 0.078 |
| 35 | 0.103 | 0.089 |
| 60 | 0.109 | 0.094 |
| 120 | 0.111 | 0.097 |
| 200 | 0.109 | 0.096 |
| 300 | 0.106 | 0.094 |
| 600 | 0.101 | 0.090 |
| 1000 | 0.096 | 0.086 |
| 10000 | 0.078 | 0.071 |
| 100000 | 0.065 | 0.061 |
Now we use the analytic expression (15) for the extraction of the charm structure function Fc2(x,Q2) from the H1 measurements of the reduced cross-section using the NLO results for Rc derived in the second section. Our results for the charm structure function are presented in table 2 and shown in fig. 3, where they are compared with the values determined by the H1 analysis and with results obtained with the help of other standard models (DL fit [15–17], color dipole model [18] and GJR parametrization [19]). The agreement between our predictions with the results obtained by the H1 Collaboration is remarkably good. Also we observed that the theoretical uncertainty related to the renormalization scales μ2 = 4m2c and μ2 = 4m2c + Q2 is negligibly small. Our results for extraction of the charm structure function from HERA measurements of the reduced charm cross-section are given for both the hard- and soft-pomeron behaviour for δ. One can see that the predictions of our NLO analysis for the hard- and soft-pomeron behaviour agree with the H1 data with an accuracy better than 1%. This is because the contributions of the longitudinal charm structure function to the reduced charm cross-section are very small. The numerical results show that a rough estimate of the uncertainty in the charm structure function due to the difference between the assumptions of a soft or a hard pomeron is less than 0.2%.
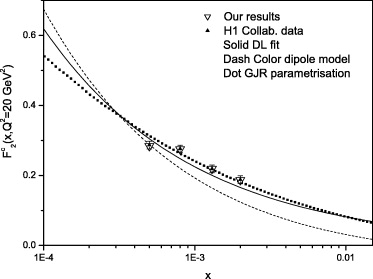
Fig. 3: The structure function Fc2(x,Q2) as a function of x at Q2 = 20 GeV2 compared with HERA data that are accompanied with total errors (see paper by Aaron et al. in ref. [3]), DL fit [15–17], color dipole model [18] and GJR parametrisation [19].
Download figure:
Standard imageTable 2. The values of Fc2(x,Q2) corresponding to the hard-pomeron behaviour extracted from the  at low and high Q2 for various values of x are compared with H1 results [3] that are accompanied with total errors (Δ%).
| Q2 (GeV2) | x | y |
 |
 |
 (ref. [3]) (ref. [3]) |
 |
 (δ≃0.5) (δ≃0.5) |
 (δ≃0) (δ≃0) |
|---|---|---|---|---|---|---|---|---|
| 12 | 0.00130 | 0.091 | 0.150 | 18.7 | 0.150 | 1.0 | 0.1500 | 0.1500 |
| 12 | 0.00080 | 0.148 | 0.177 | 15.9 | 0.177 | 1.1 | 0.1772 | 0.1771 |
| 12 | 0.00050 | 0.236 | 0.240 | 11.2 | 0.242 | 1.0 | 0.2407 | 0.2405 |
| 12 | 0.00032 | 0.369 | 0.273 | 13.8 | 0.277 | 1.1 | 0.2751 | 0.2747 |
| 20 | 0.00200 | 0.098 | 0.187 | 12.7 | 0.188 | 1.1 | 0.1871 | 0.1871 |
| 20 | 0.00130 | 0.151 | 0.219 | 11.9 | 0.219 | 1.1 | 0.2193 | 0.2192 |
| 20 | 0.00080 | 0.246 | 0.274 | 10.2 | 0.276 | 1.0 | 0.2750 | 0.2748 |
| 20 | 0.00050 | 0.394 | 0.281 | 13.8 | 0.287 | 1.1 | 0.2840 | 0.2834 |
| 35 | 0.00320 | 0.108 | 0.200 | 12.7 | 0.200 | 1.1 | 0.2001 | 0.2001 |
| 35 | 0.00200 | 0.172 | 0.220 | 11.8 | 0.220 | 1.0 | 0.2204 | 0.2203 |
| 35 | 0.00130 | 0.265 | 0.295 | 9.70 | 0.297 | 1.0 | 0.2964 | 0.2962 |
| 35 | 0.00080 | 0.431 | 0.349 | 12.7 | 0.360 | 1.1 | 0.3541 | 0.3533 |
| 60 | 0.00500 | 0.118 | 0.198 | 10.8 | 0.199 | 1.1 | 0.1982 | 0.1981 |
| 60 | 0.00320 | 0.185 | 0.263 | 8.40 | 0.264 | 1.0 | 0.2636 | 0.2635 |
| 60 | 0.00200 | 0.295 | 0.335 | 8.80 | 0.339 | 1.0 | 0.3372 | 0.3368 |
| 60 | 0.00130 | 0.454 | 0.296 | 15.1 | 0.307 | 1.0 | 0.3012 | 0.3004 |
| 120 | 0.01300 | 0.091 | 0.133 | 14.1 | 0.133 | 1.2 | 0.1331 | 0.1330 |
| 120 | 0.00500 | 0.236 | 0.218 | 11.1 | 0.220 | 1.1 | 0.2190 | 0.2187 |
| 120 | 0.00200 | 0.591 | 0.351 | 12.8 | 0.375 | 2.9 | 0.3630 | 0.3612 |
| 200 | 0.01300 | 0.151 | 0.161 | 11.9 | 0.160 | 2.7 | 0.1602 | 0.1612 |
| 200 | 0.00500 | 0.394 | 0.237 | 13.5 | 0.243 | 2.9 | 0.2400 | 0.2396 |
| 300 | 0.02000 | 0.148 | 0.117 | 18.5 | 0.117 | 2.9 | 0.1171 | 0.1171 |
| 300 | 0.00800 | 0.369 | 0.273 | 12.7 | 0.278 | 2.9 | 0.2760 | 0.2755 |
Finally, we analyse the behaviour of the exponents for the charm structure function and the reduced charm cross-section. To begin with, we recognise that the behaviour of Δλ (eq. (20)) is independent of the input gluon distribution function. The behaviour of this expression as a function of x (or y) is shown in fig. 4 for several values of Q2 (Q2 and s are constant). We observe that the behaviour of Δλ at low y (or high x) values is linear, Δλ is very small so that  , and this quantity can be determined from derivatives of the
  experimental data with respect of ln 1/x at Q2 fixed. But in the large-y region (low x), Δλ can no longer be neglected. The deviation of this expression from zero shows the importance of non-linear effects. Thus we observe that for large x (low y) there are not saturation effects. In this region the behaviour of the charm structure function exponent and reduced charm cross-section exponent is the same and the hard (Lipatov) pomeron picture gives a good fit to all data. A depletion at low x (high y) is called shadowing whereas an enhancement is called antishadowing [23].
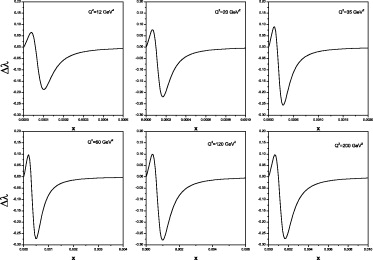
Fig. 4: The non-linear behaviour of the exponents ( ) as a function of x at different Q2 values.
Download figure:
Standard imageThe oscillating behaviour for Δλ in fig. 4 can be explained by new effects at low x, such as the behaviour of the gluon distribution evaluated with the non-linear recombination. The negative shadowing corrections to this behaviour can be explain by the gluon recombination. This negative screening effect in the recombination process originally occurs in the interferant cut diagrams of the recombination amplitudes. But the positive anti-shadowing corrections comes from a general application of momentum conservation. This antishadowing effect always coexists with the shadowing effect in the QCD recombination processes. Therefore we observe that significant non-linear effects to the modified DGLAP equation for the charm structure function can be apparent in the behaviour of the charm structure function exponent. These shadowing and antishadowing effects in the Δλ behaviour have different kinematic regions. The net effects for Δλ behaviour depend not only on the size of gluon distribution at this value of x in the modified DGLAP equation for the charm structure function, but also on the shape of the gluon distribution when the Bjorken variable goes from x to x/2. In consequence, the shadowing effects in the exponents behaviour will be obviously weakened by the antishadowing effects as the gluon distribution has a steeper behavior at low x values. This transition for Δλ is shown in fig. 4. The main prediction is a transition from the linear regime described for the exponents to a non-linear regime where the parton recombination becomes important in the parton cascade. In view of these results for the exponents, we may infer some evidence for non-linear effects at HERA and RHIC.
In summary, we have used the hard (Lipatov) pomeron for the low-x gluon distribution to predict the charm structure functions (Fc2 and FcL). We derived a compact formula for the ratio  that is valid through NLO at small values of Bjorken's x variable, as it is independent of the input gluon distribution function. We have checked that this formula gives a good description of the charm structure function from the reduced charm cross-section data without the prior knowledge of the longitudinal charm structure function. Careful investigation of our results shows a good agreement with the previously published charm structure functions and other models. Then we have used it to predict the behaviour of the charm structure function and the reduced charm cross-section exponents in the perturbative Q2 region at small x. Our predictions indicate that the behaviour of Δλ can be explained by non-linear effects at very low x. These numerical results show that the correction of the modified DGLAP equation due to gluon recombination incorporates both shadowing and antishadowing effects, as the influence of the antishadowing effect to the pre-asymptotic form of the gluon distribution is non-negligible.
Acknowledgments
GRB thanks Prof. A. Cooper-Sarkar for interesting and useful discussions.