


Abstract
We obtain the Paris law of fatigue crack propagation in a fuse network model where the accumulated damage in each resistor increases with time as a power law of the local current amplitude. When a resistor reaches its fatigue threshold, it burns irreversibly. Over time, this drives cracks to grow until the system is fractured into two parts. We study the relation between the macroscopic exponent of the crack-growth rate —entering the phenomenological Paris law— and the microscopic damage accumulation exponent, γ, under the influence of disorder. The way the jumps of the growing crack, Δa, and the waiting time between successive breaks, Δt, depend on the type of material, via γ, are also investigated. We find that the averages of these quantities,  and
and  , scale as power laws of the crack length a,
  and
and  , where
  is the average rupture time. Strikingly, our results show, for small values of γ, a decrease in the exponent of the Paris law in comparison with the homogeneous case, leading to an increase in the lifetime of breaking materials. For the particular case of γ = 0, when fatigue is exclusively ruled by disorder, an analytical treatment confirms the results obtained by simulation.
Export citation and abstract BibTeX RIS
Fatigue failure is relevant in many situations [1, 2]. Due to its non-linear and critical behavior, it is mostly catastrophic and insidious, occurring very suddenly and without warning if the crack is not noticed, since it is brittle-like even in normally ductile materials [3, 4]. So far, theoretical understanding of crack-growth phenomena is far from complete, and fatigue-life prediction remains essentially empirical [5].
Generally speaking, failure is the result of accumulated microscopic damage due to cyclic loads. Sometimes failure for constant external load is called creep [6, 7]. In a mesoscopic description, when the accumulated microscopic damage reaches a local threshold, cracks are initiated and grow through the system, leading to macroscopic fracture. Under fatigue, local damage increases and cracks grow with the number of cycles N, even for external loads below the limit strength of the material. Crack growth in this sub-critical regime, for an intermediate crack length a, is usually described by the empirical Paris law [8],

which relates the crack-growth rate da/dN with the stress-intensity amplitude  , for a sample subject to an external stress amplitude Δσ. The constants C and m depend on the material and on the loading conditions [1]. The divergence of the stress field around the crack tip seems to play an essential role in the phenomenology of the Paris law. Thus, attempts at a theoretical description of the corresponding behavior must involve models which reproduce such divergence.
Due to the intrinsic characteristics of random microscopic defects in fracturing materials [9–16], statistical models such as the random spring model [17–19], the random beam model [5, 20], and the random fuse model [4, 21–25] have been successfully applied to study fracture. The role of disorder in these systems is to induce a transition from brittle to ductile behavior [4, 26–29]. As already mentioned, the presence of fatigue can also lead to brittleness, although the physical mechanism responsible for this behavior so far remains unknown [30]. Vieira et al. [31] have shown analytically and confirmed numerically the dependence of the Paris-law exponent m on microscopic damage-accumulation phenomena in homogeneous materials. In the same study, first attempts have been made to analyze the stability of the obtained results towards the introduction of disorder. The aim of the present work is to provide the full picture, using fuse-model simulations and analytical arguments, of the role of disorder in fatigue crack-growth phenomena, including the Paris as well as the catastrophic (post-Paris) regime.
In our implementation, the random fuse model consists of resistors (with the same conductance) located on the bonds of a tilted square lattice, mimicking springs in the more complicated case of fracture mechanics [4, 27]. In this scalar version of elasticity, the current (voltage) in the electrical system is analogous to the magnitude of the stress (strain) in the mechanical system. In order to simulate heterogeneous microscopic defects commonly found in real materials, we assign to each resistor a random fatigue threshold Fth, chosen from a uniform probability distribution between 1 − b and 1 + b, where b gauges the strength of disorder. Initially, the system has a notch, formed by removing two contiguous bonds, placed symmetrically at the center of the system, with periodic boundary conditions along the notch direction. A global transverse current is imposed across the system from top to bottom and the local currents are numerically calculated by applying Kirchhoff's law to each node1 (nodes being the points where four resistors meet). We then compute, for each resistor i, the fatigue damage history up to time t by using a power-law damage-accumulation function,
where Ii(t) is the current in resistor i at time t, and the stress amplification exponent γ is a phenomenological microscopic parameter, dependent on the material. It is expected to represent the effect, over a suitable representative volume, of the complex atomistic processes, such as dislocation motion and plasticity, involved in fatigue crack propagation. The power-law form of the damage-accumulation function can be heuristically justified by invoking ideas of self-similarity [32]. Below the fatigue threshold, a resistor follows Ohm's law, but once fatigue damage reaches the corresponding threshold, fi = Fthi, the resistor burns irreversibly, like an electrical fuse. The system here is operated in the quasi-static limit, i.e., the period of the current cycle is much larger than the time required for the rearrangement of the current distribution following the burning of a fuse, but much smaller than the time between two consecutive burning events. This is equivalent to assuming a well-defined current amplitude ΔIi in each resistor during that time. Therefore, the damage increment at resistor i between two consecutive burning events occurring at times t and t + Δt is simply given by

where  is the current amplitude in resistor i between events and the constant A sets the time scale so that the damage fi becomes dimensionless. Notice also that, in the quasi-static limit, many current cycles occur between subsequent breaking events, so that we can focus on the crack velocity rather than on the crack-growth rate when investigating the Paris law.
Only the L resistors in the midline of the system, which includes the initial notch, are allowed to burn (see fig. 1). Thus, the results reported here are valid as long as the crack tends to propagate perpendicularly to the direction of the external load. After a resistor burns, the current distribution is rearranged, causing an increase in the current around crack ends. We allow only one resistor to burn at a time and this burning process continues until a macroscopic fracture crosses the system. Due to the presence of disorder, the main crack, starting from the notch, can grow either by one resistor at a time or by coalescence with secondary cracks initiated ahead of the notch. In the latter case, it advances several resistors instantaneously, stopping at the next resistor which has not reached its fatigue threshold. This procedure of following a single crack from the notch has been used experimentally to study growing cracks in thermally activated stressed systems [33]. As fig. 1 shows, increasing the value of γ greatly reduces the occurrence of secondary cracks.

Fig. 1: (Color online) Snapshots of the current distribution over the lattice for γ = 3 (above) and γ = 0 (below) with b = 0.5 and L = 256. Initially, the system has a notch of size 2 at its center, which grows horizontally, fracturing the medium into two parts. Currents increase as colors change from yellow, over violet, to green. The main crack, the one connected to the notch, of length a, is colored black, while secondary cracks are shown in red.
Download figure:
Standard imageIn the special case of γ = 0, the damage-accumulation rate is equal for all resistors, and independent of the current amplitude, and the breaking sequence is determined exclusively by the random distribution of fatigue thresholds. This particular limit of γ is especially important as it enhances the role of disorder in fatigue failure. The process is then similar to one-dimensional percolation, and analytical equations can be developed to confirm our results from numerical simulations.
For γ = 0, one needs only to distinguish between the homogeneous (b = 0) and finite disorder (b ≠ 0) cases, since systems with different values of b > 0 can be mapped on each other by rescaling time. Thus, we consider a one-dimensional chain of resistors whose fatigue thresholds are chosen according to a uniform probability distribution,  , in the interval [0,1]. We define the time unit by imposing that the accumulated damage at each resistor at time t is
  , which is equivalent to measuring time in units of the rupture time. Thus, the probability that a given resistor is already burnt at time t is simply t. Given that the main crack has length a, having started from a pair of adjacent burnt resistors at time t = 0, the probability that it advances Δa resistors between times t and t + dt, after having waited a time between Δt and
  since it last advanced, is
  , with
In order to arrive at the above conditional probability, let us assume that the crack advances to the right, and notice that  is the probability that a − 3 resistors burned before time t − Δt, one resistor burned between t − Δt and t − Δt + d(Δt) (while two resistors form the initial notch), and the resistor at the left end of the crack is still intact at time t. The factor tΔa−1dt corresponds to the probability that the crack advances Δa resistors between times t and t + dt, while the terms in square brackets differentiate a crack that advances less than L − a − 1 resistors, stopping at yet another intact resistor, from a crack that goes around the system (due to periodic boundary conditions). Of course the process is symmetric for a crack advancing to the left, and the factor
  ensures normalization of the conditional probability.
The marginal probabilities P(Δa|a) and P(Δt|a), which correspond to the distributions of crack jumps and waiting times between successive jumps, for a given crack length a, can be readily obtained from  by integrating over the remaining variables, and are given by
and

From these, we can calculate, as functions of the crack length a, the average crack jump and the average waiting time between consecutive jumps,
and

Notice that 〈Δa〉a grows linearly with a for 1 ≪ a ≪ L, but decreases rapidly as a approaches L, since Δa cannot be larger than L − a − 1. On the other hand, 〈Δt〉a decreases as 1/a for a ≫ 1.
In the presence of disorder, there are various possible definitions for the crack velocity. For instance, we can determine the average time dependence of the crack length,  , and calculate its derivative. Alternatively, for a given crack length, we can estimate crack velocity in terms of averages as
However, and not surprisingly, it is possible to show that, for γ = 0, all these definitions yield crack velocities which scale with the crack length a, for 1 ≪ a ≪ L, as

leading, as defined in eq. (1), to a Paris exponent m = 4. This is in clear contrast to the uniform limit, for which  as
as  , while the proportionality factor C in Paris' law must diverge, due to the fact that all bonds reach the damage threshold and break simultaneously. Of course, this instantaneous breakdown does not happen in the presence of disorder.
We now discuss the results obtained by simulating the fuse-network model with γ ⩾ 0, and compare the case of γ = 0 to the above analytical expressions. In our simulations, we estimate the crack velocity, da/dt, by a procedure designed to minimize statistical fluctuations. Precisely, for a given disorder realization, we estimate the time at which the main crack had a given length a, as displayed in fig. 1. (For disorder realizations in which the crack happened to be temporarily trapped at that particular length, we chose the time at which the crack advanced from that length.) Then, we calculate the average time at each crack length over all disorder realizations. We take averages over up to 50 000 realizations, depending on the set of parameters, γ, b, and L. Finally, we numerically differentiate the corresponding curve with respect to time, to estimate the crack velocity. The jumps and waiting times of the main crack, as functions of the length a, are analyzed via finite-size scaling in figs. 2 and 3, respectively. The results show that both  and
and  scale as power laws of the crack length a,
  and
and  , where
  is normalized by the average rupture time
  . The behaviors of the exponents α and β as functions of the stress amplification exponent γ, for different disorder strengths b, are shown in the insets of figs. 2 and 3, respectively. For γ = 0 and b > 0, both α and β are unity, in agreement with the analytical results. For the ordered case (b = 0), α vanishes for all values of γ, since the main crack always advances two resistors at a time, and no secondary cracks appear. In this limit, β is one half of the Paris exponent m.
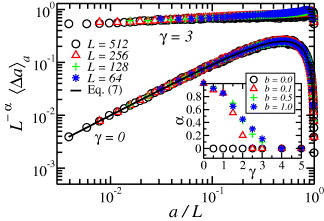
Fig. 2: (Color online) Main plot: rescaled average jump of the main crack as a function of its length a, for various system sizes, two values of the damage accumulation exponent, γ = 0 and γ = 3, and disorder strength b = 0.5. The results for γ = 0 match the analytical prediction (solid line) from eq. (7). The jump of a crack depends on its length as a power law,  . The error bars are smaller than the symbols. The inset shows the exponent α
vs.
γ for different degrees of disorder. In the ordered case, b = 0, the exponent α vanishes for any value of γ since the crack advances without coalescence.
. The error bars are smaller than the symbols. The inset shows the exponent α
vs.
γ for different degrees of disorder. In the ordered case, b = 0, the exponent α vanishes for any value of γ since the crack advances without coalescence.
Download figure:
Standard image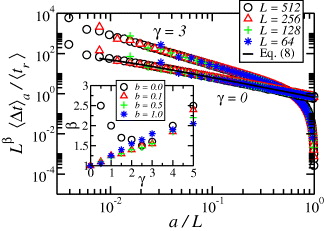
Fig. 3: (Color online) Averaged waiting time between successive breaks of the main crack, normalized by the averaged rupture time,  , as a function of the length a, collapsed for different system sizes, for γ = 0 and γ = 3, with b = 0.5. The results of γ = 0 match the analytical prediction (solid line) from eq. (8). The waiting time of a crack depends on its length as a power law,
  . The error bars are smaller than the symbols. The inset shows the exponent β
vs.
γ for different degrees of disorder.
. The error bars are smaller than the symbols. The inset shows the exponent β
vs.
γ for different degrees of disorder.
Download figure:
Standard imageThe growth rate of the main crack is depicted in fig. 4, which shows the rescaled crack velocity for different system sizes, disorder strength b = 0.5, and γ = 0 and 3. The values of the Paris exponent are chosen so as to yield the best data collapse of the curves corresponding to different system sizes for a given value of γ. Usual materials present, after the Paris regime, a faster growth rate preceding the final rupture. However, due to boundary effects, we observe, for any finite disorder strength (b > 0) and for γ close to zero, a slight decrease in the growth rate as the system approaches catastrophic failure.

Fig. 4: (Color online) Rescaled crack-growth rate of the main crack as a function of rescaled length a/L, showing the Paris exponent, m, for γ = 0 and γ = 3, with b = 0.5. For a better visualization, curves for γ = 3 are shifted to the right by 20%.
Download figure:
Standard imageThe dependence of the macroscopic Paris exponent m on the microscopic fatigue exponent γ, for different degrees of disorder, is shown in fig. 5, together with the results found for the homogeneous case, m = 6 − 2γ, for γ < 2, and m = γ, for γ ⩾ 2 [31]. Numerical estimates extracted from fuse-model simulations for the homogeneous case are also shown, highlighting the existence of logarithmic corrections to finite-size scaling, which plague the results for values of γ around the critical value γc = 2. For all values of γ, the obtained Paris exponent m lies within the usual experimental range of m > 2 [2]. Actually, according to experimental data, values of m between 2 and 4 are usually observed for ductile metallic alloys, although much higher values can be seen for other materials, like polymer foams. In the presence of disorder (b > 0), our results indicate that m converges to 4 as γ approaches zero, as predicted by the analytical results, while the behavior is similar to the ordered case for γ > 2, except for very strong disorder (b ≃ 1). Interestingly, any finite disorder leads to a decrease in the Paris exponent, and thus to a potential increase in the fatigue lifetime, for γ ≲ 1. On the other hand, in agreement with a stability analysis of the effects of disorder on the homogeneous system [31], the system is essentially insensitive to small disorder for arbitrarily large values of γ > 2. On the other hand, for γ around 2, the finite-size behavior is again plagued by strong corrections to scaling, making it quite hard to obtain reliable estimates for power-law exponents. Thus, at this point we cannot rule out that the corresponding apparent non-monotonic behavior of both β and m with the disorder strength b is an artifact of insufficient statistics and finite systems.
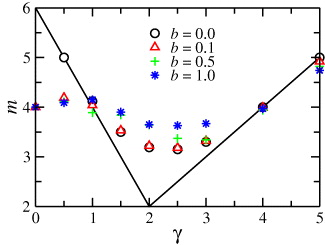
Fig. 5: (Color online) The Paris exponent m vs. the stress amplification exponent γ for different disorder strengths b. The solid lines represent the results found for the homogeneous case, m = 6 − 2γ, for γ < 2, and m = γ, for γ ⩾ 2 [31]. For the one-dimensional case with γ = 0, m = 4 for any finite value of b.
Download figure:
Standard imageIn conclusion, we have investigated both analytically and through simulations the behavior of fatigue failure in fuse networks, characterized by a damage-accumulation law governed by a stress amplification exponent γ. We have determined how the empirical, macroscopic Paris exponent depends on the microscopic parameters of fatigue and disorder, represented by random local fatigue thresholds. For small values of γ, corresponding to materials in which damage accumulation depends only weakly on the local stress amplitude, the Paris exponent approaches m = 4 (obtained exactly for γ = 0) if any disorder is present. On the other hand, fatigue failure in materials for which γ > 2 continues to be characterized by a Paris exponent m = γ as long as disorder is not sufficiently strong. This points to the fact that our results should not be valid for more singular disorder distributions, for which, e.g., the probability density for small thresholds diverges. Also, the assumption of random conductances, rather than random thresholds, would perhaps lead to similar results, since a fuse with a higher conductance would carry a higher current, and thus would experience an earlier burning. This could effectively be represented by random thresholds. Possible discrepancies in the resulting behavior would occur if the effective threshold distribution has a singular character. A considerable challenge for future research lies in obtaining the relation between microscopic processes and the coarse-grained description of damage accumulation by means of a stress amplification exponent γ.
Acknowledgments
This work was supported by the Brazilian Agencies CNPq, CAPES, FINEP, FUNCAP, FAPESP, NAP-FCx, FAPESB/CNPq, the FUNCAP/CNPq Pronex grant, and the National Institute of Science and Technology for Complex Systems.
Footnotes
- 1
The linear equation system is solved here through the HSL library, a collection of FORTRAN codes for large-scale scientific computation. See http://www.hsl.rl.ac.uk/.