


Abstract
In downhill alpine skiing, skiers often exceed speeds of 120 km h−1, with air resistance substantially affecting the overall race times. To date, studies on air resistance in alpine skiing have used wind tunnels and actual skiers to examine the relationship between the gliding posture and magnitude of drag and for the design of skiing equipment. However, these studies have not revealed the flow velocity distribution and vortex structure around the skier. In the present study, computational fluid dynamics are employed with the lattice Boltzmann method to derive the relationship between total drag and the flow velocity around a downhill skier in the full-tuck position. Furthermore, the flow around the downhill skier is visualised, and its vortex structure is examined. The results show that the total drag force in the downhill skier model is 27.0 N at a flow velocity of 15 m s−1, increasing to 185.8 N at 40 m s−1. From analysis of the drag distribution and the flow profile, the head, upper arms, lower legs, and thighs (including buttocks) are identified as the major sources of drag on a downhill skier. Based on these results, the design of suits and equipment for reducing the drag from each location should be the focus of research and development in ski equipment. This paper describes a pilot study that introduces undergraduate students of physics or engineering into this research field. The results of this study are easy to understand for undergraduate students.
Export citation and abstract BibTeX RIS

Original content from this work may be used under the terms of the Creative Commons Attribution 3.0 licence. Any further distribution of this work must maintain attribution to the author(s) and the title of the work, journal citation and DOI.
1. Introduction
In competitive alpine skiing, the goal is to cross the finish line the fastest while navigating tight turns and obstacles throughout the course. A skier maximises their speed by minimising resistance to motion, both from air resistance (drag) and snow resistance (friction). A skier does this by going into a crouch (tuck) position, resulting in a lower drag force, which acts in a direction opposite to their velocity, slowing them down.
In alpine skiing events, such as downhill and super-giant slalom, skiers often exceed speeds of 120 km h−1 [1]. Air resistance significantly affects the competition timings. To date, research on air resistance in alpine skiing has considered actual skiers in wind tunnels to examine the relationship between the gliding posture and the magnitude of drag and for the design of skiing equipment such as skiers' suits [2–4].
Although the total drag on a skier can be calculated via wind tunnel experiments, it is extremely difficult to measure the drag distribution across each part of the body. A more effective way to visualise the flow around the skier and examine the aerodynamic characteristics is to use computational fluid dynamics (CFD) along with experimental fluid dynamics (EFD) in a wind tunnel [5]. In particular, it is important to estimate the drag distribution for each part of the skier's body, and CFD makes such visualisation possible. Revealing the drag distribution based on an understanding of the flow field around a skier also provides basis for new gliding postures and novel designs for skiing equipment.
In the present study, the relationship between the skier's speed and total drag in the full-tuck posture is identified by combining EFD using the wind tunnel and CFD using the lattice Boltzmann method. Moreover, the flow around the skier is visualised in the CFD model to reveal the drag distribution for each part of the skier by studying the vortex structure.
2. Methods
2.1. CFD using the lattice Boltzmann method
A three-dimensional downhill skier model (including skis, poles, boots and helmet) was constructed (figure 1) using data obtained from a 3D laser scanner (AICON 3D; Breuckmann GmbH) applied to a real downhill skier. A Cartesian grid form was adopted to generate a spatial grid of size 20 m × 20 m × 40 m (W × H × L), comprising nearly 500 million cells (figure 2). A sectional grid scale technique was employed for this study, with a minimum scale of 1 mm and a maximum scale of 4 mm (figure 3). This grid structure could not represent the detailed vortex formations perfectly, but it was employed because of computational resource constraints [6, 7]. The flow speed at the velocity inlet was set to 15, 20, 25, 30, 35 or 40 m s−1. The pressure outlet was defined as 1013.25 hPa (i.e., atmospheric pressure). The boundary wall of the downhill skier was assumed to obey a no-slip condition, and the outer walls (including the ground surface) were defined as slip walls.

Figure 1. Three-dimensional CFD downhill skier model.
Download figure:
Standard image High-resolution image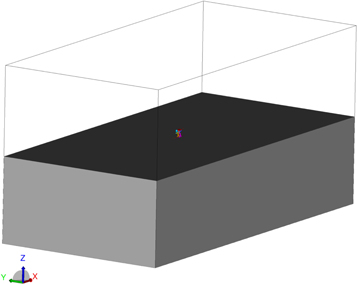
Figure 2. Cartesian grid adopted to generate the spatial grid (W 20 m × H 20 m × L 40 m) for CFD.
Download figure:
Standard image High-resolution image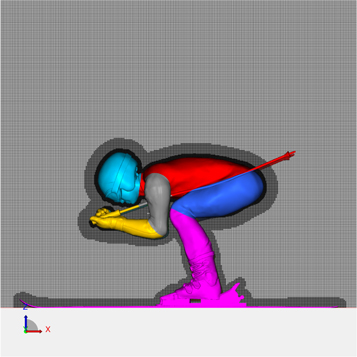
Figure 3. Sectional grid scale technique for CFD.
Download figure:
Standard image High-resolution imageIn this study, aerodynamic simulations were performed using commercial CFD software (PowerFLOW 5.0, Exa Inc.) based on the lattice Boltzmann method [8]. For high Reynolds numbers, the boundary layer was simulated by a wall model. Turbulence was modelled under the principle of very large eddy simulations (VLES) [9], which directly simulate resolvable flow scales, whereas unresolved scales were modelled using the re-normalisation group form of the k-epsilon equations with proprietary extensions to achieve VLES time-accurate physics. The lattice in this solver was composed of voxels, which are three-dimensional cubic cells. The lattice also included surfels, which are surface elements that occur where the surface of a body intersects the fluid. The total drag force of the CFD skier model was calculated from the average unsteady drag force over a period of 0.4 s. The Lambda-2 method was used to detect vortices [10, 11]. The Lambda-2 method (Lambda-2 vortex criterion) is a detection algorithm that can adequately identify vortices from a three-dimensional velocity field. The Lambda-2 method is Galilean invariant, which means it produces the same results when a uniform velocity field is added to the existing velocity field or when the field is translated.
The swirl was defined with the helicity, which is as an index of the connectedness of vortex cores. Helicity is a scalar quantity defined as an inner (dot) product of the velocity and vorticity vectors.
2.2. EFD using a wind tunnel
The experiments were performed in a closed-circuit (Göttingen type) wind tunnel at the Institute of Health and Sports Sciences, Tsukuba University. The maximum flow velocity of the tunnel was 55 m s−1, and the size of the blower outlet was 1.5 m × 1.5 m. The flow velocity distribution was within ±0.5%, and the longitudinal degree of turbulence was no more than 0.1% along the jet axis. A full-scale downhill skier model was constructed from steel core frames, with the hull of the body made from a modified human mannequin (figure 4). Actual racing equipment was used for the skis, poles, boots, helmet and racing suit of the model. The posture of the skier model was set to a typical full-tuck position. The skis were connected to a force platform (9287C, Kisler AG) set on the ground to measure the drag and lift forces at a sampling rate of 1000 Hz. The total drag force of the skier model in the wind tunnel was calculated from the average unsteady drag force over a period of 10.0 s.

Figure 4. Full-scale downhill skier mannequin for EFD.
Download figure:
Standard image High-resolution image3. Results
The total drag forces calculated for the CFD downhill skier model and those measured in the wind tunnel experiments are compared in table 1 and figure 5. These results exhibit good correlation (r = 0.99, p < 0.01). Brownlie et al [1] reported a total drag of 88.8 N at 27.8 m s−1 in wind tunnel experiments conducted with actual skiers in the full-tuck posture. The estimated drag value for the CFD analysis using a 2nd-order polynomial fit was 91.9 N at a wind velocity of 27.8 m s−1, which is close to the experimental value. These results indicate that the CFD output of the present study is in good agreement with the EFD results, which suggests that an appropriate numerical analysis has been conducted.
Table 1. Comparison of drag forces between CFD and EFD results.
| Flow velocity (m s−1) | 15 | 20 | 25 | 30 | 35 | 40 | |
|---|---|---|---|---|---|---|---|
| Drag force (N) | CFD | 27.0 | 46.2 | 74.3 | 107.6 | 144.7 | 185.8 |
| EFD | 31.7 | 50.2 | 76.6 | 108.2 | 145.4 | — | |

Figure 5. Comparison of drag force given by CFD with that given by EFD.
Download figure:
Standard image High-resolution imageLow-speed zones were observed at the back of the head, hand and buttocks in the flow velocity distribution along the mid-sagittal plane of the downhill skier model at a flow velocity of 40 m s−1 (figure 6). Similarly, low-speed zones were observed at the back of the upper arm, lower leg and buttocks in the flow velocity distribution at the parasagittal plane crossing the left leg (figure 7). These low-speed regions were also observed at the back of the head, upper arm, lower leg and buttocks in the surface velocity magnitude distribution of the downhill skier model (figure 8). Furthermore, a strong vortex core was observed at the rear of the head, upper arm, lower leg, buttocks, ski tips and the rear of the poles in the Lambda-2 iso-surface around the downhill skier model (figure 9) [10, 11].
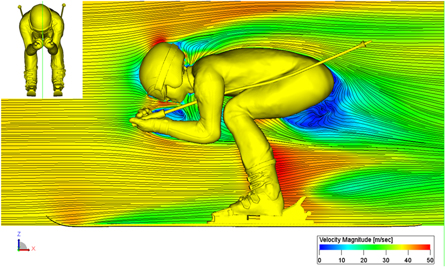
Figure 6. Flow velocity magnitude distribution along the mid-sagittal plane at a flow speed of 40 m s−1. Flow is from left to right.
Download figure:
Standard image High-resolution image
Figure 7. Flow velocity magnitude distribution along a parasagittal plane across the feet at a flow speed of 40 m s−1. Flow is from left to right.
Download figure:
Standard image High-resolution image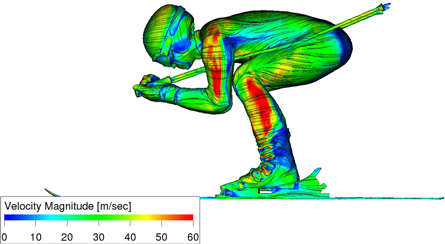
Figure 8. Flow velocity magnitude distribution on the full-scale downhill skier model at a flow speed of 40 m s−1. Flow is from left to right.
Download figure:
Standard image High-resolution image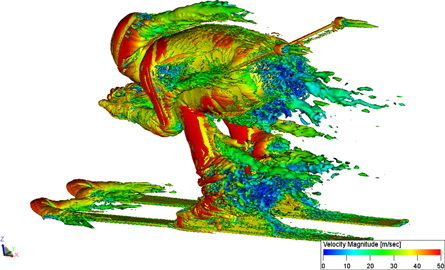
Figure 9. Flow velocity magnitude distribution on Lambda-2 isosurface at a flow speed of 40 m s−1.
Download figure:
Standard image High-resolution imageIn the distribution of the swirl strength on the cross-sectional plane (isosurface planes) of 0.95, 1.10, 1.25, 1.40 and 1.55 m, high intensity swirls were observed behind the head and legs on the planes of 0.95 m and 1.10 m, respectively, and behind the head and legs on the plane of 1.25 m similar to a counter-rotating vortex pair (figures 10(a)–(c)). On the isosurface of 1.40 m, it seemed that those vortex structures diffused (figure 10(d)). Moreover, on the isosurface of 1.55 m, a counter-rotating vortex pair was observed behind the hip (buttocks) of the skier (figure 10(e)). These high intensity swirls that are similar to a counter-rotating vortex pair are caused by the separation of the boundary layer on the surface of the skier; therefore, it is considered that these regions are sources of air resistance (drag) (figure 11) [12]. Although these vortex structures indicate the transient and complex behaviour of connecting with other vortex structures, these vortex structures are considered as one of the dominant vortex structures for the full-tuck posture of the downhill skier.

Figure 10. Flow visualisation of swirl on cross sectional plane behind the downhill skier at a flow speed of 40 m s−1. (The distances from the head to the isosurfaces of (a)–(e) are 0.95 m, 1.10 m, 1.25 m, 1.40 m and 1.55 m, respectively.)
Download figure:
Standard image High-resolution image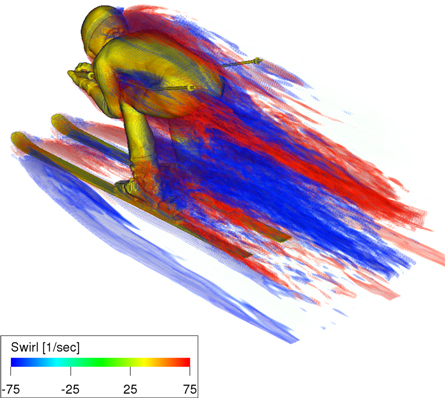
Figure 11. Flow visualisation of dominant vortex structure of the full-tuck posture of the downhill skier.
Download figure:
Standard image High-resolution imageThe drag and lift components at 40 m s−1 are given in figures 12 and 13, respectively, and table 2. The drag and lift distribution for each body part at each flow velocity (20, 25, 30, 35, and 40 m s−1) tended to increase with increases in flow velocity. From these results of the drag distribution and the flow profile, it can be concluded that the head, upper arms, lower legs, and thighs (including buttocks) are the major sources of drag on a downhill skier. This suggests that straightening the airflow around the head, upper arms, lower legs, and thighs (including buttocks) will reduce the drag, thereby decreasing the wake fields behind downhill skiers.

Figure 12. Drag force components for the body parts of a downhill skier at a flow speed of 40 m s−1. (a: head, b: torso, c: right upper arm, d: right lower arm, e: left upper arm, f: left lower arm, g: thigh, h: right lower leg, i: left lower leg.)
Download figure:
Standard image High-resolution image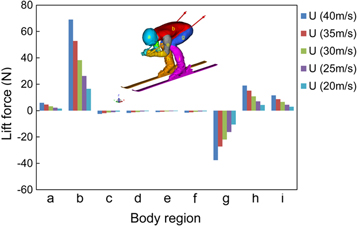
Figure 13. Lift force components for the body parts of a downhill skier at a flow speed of 40 m s−1. (a: head, b: torso, c: right upper arm, d: right lower arm, e: left upper arm, f: left lower arm, g: thigh, h: right lower leg, i: left lower leg.)
Download figure:
Standard image High-resolution image
Table 2. Drag and lift components at 40 m s−1.
| Location | Head | Torso | Upper arms | Forearms | Thighs | Lower legs |
|---|---|---|---|---|---|---|
| Drag (N) | 22.2 | 14.0 | 13.6 | 6.2 | 16.6 | 46.9 |
| Lift (N) | 5.9 | 69.0 | −1.8 | −1.7 | −37.6 | 15.3 |
4. Discussion
The flow field visualisation of a downhill skier model revealed the main sources of drag in the full-tuck posture to be the head, upper arms, upper legs and thighs (including buttocks). Therefore, postures that reduce the drag in these locations will provide an important technological advance in downhill alpine skiing. The design of suits and equipment to reduce the drag from each location should be the focus of research and development in ski equipment.
The main sources of lift in the full tuck-posture were the torso and thighs, with the torso acting upwards and the thighs acting downwards. The lift acting on the body's centre of gravity is the resultant of these components, which can be considered to cancel each other out to some extent. The lift required by skiers is not well known, and should be studied in future work.
In the present study, only the full-tuck posture of a downhill skier model was studied using the lattice Boltzmann method. Actual races involve motion that is accompanied by changes in posture, and transient analysis that can take such motion into account should be conducted. In addition, computational limitations dictated that VLES be used as the turbulence model. The authors believe that analysis based on direct numerical simulation will be possible with increased computational resources.
5. Conclusion
In this study, CFD was used to simulate the flow field around a downhill skier. The model was validated with EFD experiments in a wind tunnel. Unlike EFD, the CFD simulations allowed for calculation of the components of drag and lift resulting from each body part. Furthermore, the helicity was calculated to identify the distribution of vortex cores. The results of these calculations showed that the main sources of drag in the full-tuck position were the head, upper arms, upper legs and thighs (including buttocks). These results provide useful information for development of improved posture and equipment. Future work should include the analysis of the lift required by skiers and transient analysis of motions made during posturing.
Acknowledgments
The work described in this report was funded by a grant from the Descent and Ishimoto Memorial Foundation for the Promotion of Sports Science.