


ABSTRACT
We present the 2012 Hubble Ultra Deep Field campaign (UDF12), a large 128 orbit Cycle 19 Hubble Space Telescope program aimed at extending previous Wide Field Camera 3 (WFC3)/IR observations of the UDF by quadrupling the exposure time in the F105W filter, imaging in an additional F140W filter, and extending the F160W exposure time by 50%, as well as adding an extremely deep parallel field with the Advanced Camera for Surveys (ACS) in the F814W filter with a total exposure time of 128 orbits. The principal scientific goal of this project is to determine whether galaxies reionized the universe; our observations are designed to provide a robust determination of the star formation density at z ≳ 8, improve measurements of the ultraviolet continuum slope at z ∼ 7–8, facilitate the construction of new samples of z ∼ 9–10 candidates, and enable the detection of sources up to z ∼ 12. For this project we committed to combining these and other WFC3/IR imaging observations of the UDF area into a single homogeneous dataset to provide the deepest near-infrared observations of the sky. In this paper we present the observational overview of the project and describe the procedures used in reducing the data as well as the final products that were produced. We present the details of several special procedures that we implemented to correct calibration issues in the data for both the WFC3/IR observations of the main UDF field and our deep 128 orbit ACS/WFC F814W parallel field image, including treatment for persistence, correction for time-variable sky backgrounds, and astrometric alignment to an accuracy of a few milliarcseconds. We release the full, combined mosaics comprising a single, unified set of mosaics of the UDF, providing the deepest near-infrared blank-field view of the universe currently achievable, reaching magnitudes as deep as AB ∼ 30 mag in the near-infrared, and yielding a legacy dataset on this field.
Export citation and abstract BibTeX RIS
1. INTRODUCTION
A fundamental quest of modern observational cosmology involves expanding the frontiers of knowledge about the formation of the first stars and galaxies at the earliest epochs of cosmic time and determining their role in the reionization of the universe at redshifts above 7. This is also among the most challenging of observational regimes to explore, requiring depths up to 30th magnitude (AB) or beyond, at count-rates that are thousands to millions of times fainter than the typical ground-based sky brightness per square arcsecond at optical and near-infrared wavelengths, respectively.
The Hubble Space Telescope (HST) has played a unique role in these explorations of the very early universe, probing these extreme depths through its combination of high angular resolution, and low sky background achievable only from space. Significant investments of time in deep, single-pointing surveys with HST have yielded a wealth of scientific results, from the original Hubble Deep Field (Williams et al. 1996) and Hubble Deep Field South (Casertano et al. 2000; Williams et al. 2000; Lucas et al. 2003), together with the 2004 Ultra Deep Field (UDF; Beckwith et al. 2006; Thompson et al. 2005), which has since become the centerpoint for deep follow-on imaging programs in 2005 (PI: M. Stiavelli, described in Oesch et al. 2007, 2009), as well as with the Wide Field Camera 3 infrared channel (WFC3/IR) in 2009 (UDF09; PI: G. Illingworth, described in Oesch et al. 2010a, 2010b and Bouwens et al. 2011b; see also Illingworth et al. 2013), and most recently in 2012 (UDF12; PI: R. Ellis, described in Ellis et al. 2013 together with the present paper).10
These surveys, in conjunction with wider, shallower HST surveys with the Advanced Camera for Surveys (ACS) including GOODS (Giavalisco et al. 2004), GEMS (Rix et al. 2004), AEGIS (Davis et al. 2007), COSMOS (Scoville et al. 2007; Koekemoer et al. 2007), WFC3 Early Release Science program (Windhorst et al. 2011), CANDELS (Grogin et al. 2011; Koekemoer et al. 2011), BoRG (Trenti et al. 2011), HIPPIES (Yan et al. 2011), and CLASH (Postman et al. 2012), have transformed our understanding of the early universe. There is now overall evidence for the mass build-up of early galaxies at z ∼ 4–8 based on the evolution of the cosmic star-formation density (Giavalisco et al. 2004; Bouwens et al. 2004, 2007; Bunker et al. 2004; McLure et al. 2006, 2009; Yan et al. 2006, 2010; Castellano et al. 2010; Oesch et al. 2010b). A wider variety of results have been obtained on the ultraviolet spectral slopes and stellar populations of these early star-forming galaxies at z ∼ 7–8 (Bouwens et al. 2009, 2010, 2012; Ono et al. 2010; Bunker et al. 2010; Finkelstein et al. 2010, 2012a, 2012b; Yan et al. 2011, 2012; McLure et al. 2010, 2011; Grazian et al. 2011, 2012; Bradley et al. 2012; Dunlop et al. 2012, 2013; Schenker et al. 2013), particularly concerning the extent to which these galaxies may or may not be able to account for reionization. Finally, tantalizing discoveries of galaxies at z ∼ 9–10 (Yan et al. 2010; Bouwens et al. 2011a; Zheng et al. 2012), z ∼ 11 (Coe et al. 2013), and potentially even up to z ∼ 12 (Bouwens et al. 2011a; Ellis et al. 2013; but see also Brammer et al. 2013) are only becoming possible by means of the deepest near-IR observations achievable, which are described in this paper for the UDF.
The structure of this paper is as follows. The survey overview and observational design are presented in Section 2, followed by the description of the data processing and calibration in Section 3, the presentation of the final data products in Section 4, and the summary in Section 5. Further details and current updates about the survey are provided at the project Web site11 and all the final combined mosaic data products from the survey are being made publicly available as High-Level Science Products12, which are delivered to the Space Telescope Science Institute archive. These images constitute a single, unified set of mosaics of the UDF, providing the deepest near-IR blank-field view obtained of the universe to date, approaching limiting magnitudes AB ∼ 30 mag in the near-IR, and yielding a legacy dataset on this field.
2. SURVEY OVERVIEW AND OBSERVATIONAL DESIGN
This paper presents the overview of the 2012 Hubble Ultra Deep Field campaign (UDF12; HST Program ID 12498, PI: R. Ellis), a large 128 orbit Cycle 19 HST program aimed at extending the previous 2009 WFC3/IR observations of the UDF (UDF09; HST Program ID 11563, PI: G. Illingworth). The observations were all obtained between 2012 August 4 and September 16, and are summarized in Table 1. The observational approach as proposed by the current project is to combine these and other WFC3/IR imaging observations of the UDF area into a single homogeneous dataset, including additional filter wavelength coverage, to provide the deepest near-IR observations of the sky currently achievable, as summarized in Table 2.
Table 1. UDF12 Observing Summary (HST Program ID 12498)
| Field | Instrument/Camera | Filter | No. of Orbits | No. of Exposures | Exposure Time |
|---|---|---|---|---|---|
| (s) | |||||
| UDF-main | WFC3/IR | F105W | 72 | 144 | 198, 423 |
| WFC3/IR | F140W | 30 | 60 | 82, 676 | |
| WFC3/IR | F160W | 26 | 52 | 71, 652 | |
| UDF-par2 | ACS/WFC | F814W | 128 | 256 | 322, 944 |
Download table as: ASCIITypeset image
Table 2. Full-depth Combined UDF WFC3/IR Mosaics (Orbits)
| Filter | UDF09a | UDF12a | Othera,b | Finala |
|---|---|---|---|---|
| F105W | 24 | 72 | 4 | 100 |
| F125W | 34 | ⋅⋅⋅ | 5 | 39 |
| F140W | ⋅⋅⋅ | 30 | ⋅⋅⋅ | 30 |
| F160W | 53 | 26 | 5 | 84 |
Notes. aNumber of HST orbits obtained. bOther programs include 12099 (PI: A. Riess) and CANDELS 12060, 12061, 12062 (PI: S. Faber and H. Ferguson), all included in the data presented here.
Download table as: ASCIITypeset image
In this project we aim to study the role of galaxies in reionizing the universe by extending robust searches for Lyman-break galaxies to z ∼ 9 and beyond, obtaining more accurate faint-end luminosity functions at z ∼ 7 and z ∼ 8, and determining more accurate ultraviolet spectral energy distributions to constrain stellar populations and ionizing photon output. In order to achieve these goals, this survey builds upon the previous WFC3/IR investment that had already been obtained in the UDF in a number of different ways.
- 1.Quadruple the exposure time in the F105W filter, adding 72 new orbits to the data that had previously been obtained in the UDF09 survey (program ID 11563, PI: G. Illingworth), in order to provide deeper short-wavelength constraints on the z ∼ 8 sources selected using F105W to F125W color criteria, probe to fainter luminosities, and yield a more robust determination of the star formation density at z ∼ 8–10.
- 2.Add completely new wavelength information with the F140W filter, obtaining 30 orbits of deep integration to match the depths in the F125W and F160W filters. This provides improved measurements of the UV slopes of z ∼ 7–8 sources, additional independent detections of the continuum longward of the Lyman break for sources at z ≳ 9–10, as well as probing to z ∼ 12 for sources whose Lyman emission may be redshifted out of the F140W filter and are detectable only in F160W.
- 3.Increasing the exposure time in F160W by an additional 26 orbits from the UDF09 program, providing more robust red measurements for galaxies at z ∼ 8–10 and further improving the constraints on their UV slopes, as well as further securing any potential detections up to z ∼ 12.
In this section we provide the details of the observational design of the survey, including the filter selection, exposure times, HST observing considerations, and dithering strategies that were employed in obtaining the observations.
2.1. Filter Wavelength Coverage and Depth
The science drivers, as summarized above and described here in further detail, drove the filter choice and exposure times at a high level to achieve 5σ limiting depths of F105W = 30.0 mag, F140W = 29.5 mag, and F160W = 29.5 mag (AB magnitudes, as measured in 0 4 diameter apertures), in conjunction with F125W = 29.5 mag from reprocessing the previously obtained observations.
The increase in F105W depth was necessitated by the need to improve the robustness of the z ∼ 8 dropout selection, as well as probing to fainter luminosities. The lack of a dynamic range offered in earlier data between the F105W to F125W color selections, which only corresponded to a 2σ limit of F105W to F125W > 1.0 mag at the F125W detection limits, was inadequate to exclude potential low-redshift Balmer-break interlopers. Increasing this discriminating power to a 2σ limit of F105W to F125W > 1.5 mag, at a 5σ detection threshold of F125W = 29.5 mag obtained from our own reduction of the previous UDF09 data (program ID 11563, PI.: G. Illingworth), provides much stronger selection against low-redshift interlopers, hence cleaner samples of z ≳ 8 galaxies for studies of the luminosity function evolution at these redshifts. We achieved this increase with the additional 72 orbits that we obtained, thereby reaching our target 5σ detection limit of F105W = 30.0 mag (AB magnitudes, 04 diameter aperture).
The depth increase for F160W, aiming to match the depth of our F125W reduction, was motivated primarily by the need to probe further down the luminosity function at redshift z ≃ 7 and, for the first time, at z ≃ 8. In particular, establishing whether or not the galaxy population at z ∼ 8 can reionize the universe requires measuring the faint end slope of the luminosity function down to M1500 ∼ −17.5 mag, thereby necessitating 5σ detection limits of ∼29.5 mag (AB). This was achieved by increasing the existing F160W exposure time an additional 50% to reach a 5σ detection limit of F160W = 29.5 mag, by combining our new 26 orbits with the previously existing F160W data on this field.
Finally, the addition of the new F140W filter was motivated by several science goals. First among these was to improve the reliability of any detections of possible sources at z ∼ 9–10 (whose Lyman break has moved out of the F125W filter) by using two filters to provide detections longward of the break. Because high-redshift galaxies are essentially flat-spectrum sources in fν, this drives the depth of F140W to match that of F160W, i.e., a 5σ detection threshold of F140W = 29.5 mag (AB), which we achieved using a total exposure time of 30 orbits in this filter. This filter also provides additional wavelength discriminating power for sources that might be at an even higher redshift, since Lyα would move out of its redward edge at z ∼ 12. For reference, in Figure 1 we show the relevant throughput curves for all the WFC3/IR filters discussed here.
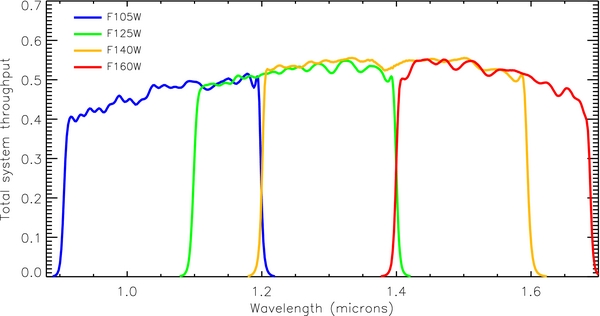
Figure 1. Total system filter throughput curves for the WFC3/IR observations of the UDF, as discussed further in Section 2.1.
Download figure:
Standard image High-resolution imageThe additional depth in the F105W and F160W filters, along with the new wavelength information provided by the F140W filter to a matching depth, also provide a more accurate measurement of the UV slope parameter β. A robust measure of the average value of 〈β〉 requires 8σ detections to achieve reliable constraints. For example, as demonstrated by Dunlop et al. (2012), shallower 4σ detections can lead to colors that may be uncertain by up to ∼0.35 magnitudes, translating to 1σ errors in β of Δβ ± 1.5. Doubling the signal-to-noise ratio (S/N) on the measurements of β, obtained by using all the new data from our program, can establish much more accurate values of 〈β〉 at z ∼ 7–8, as described in further detail by Dunlop et al. (2013), McLure et al. (2013), and Robertson et al. (2013).
In addition to the prime WFC3/IR observations on the UDF, we also obtained parallel observations with the ACS/WFC camera. We required an orient designed to place these parallel exposures onto the existing parallel field 2 of the UDF (labeled UDF-PAR2, also known previously as UDF-NICP34; see Beckwith et al. 2006; Oesch et al. 2007, 2009; Bouwens et al. 2011b; and HST Program ID 10632, PI: M. Stiavelli), using a spacecraft orientation of 264deg, identical to what had been used for this field in the UDF09 program, to ensure maximal overlap with the ACS data that was obtained as part of that program. As discussed further by McLure et al. (2011), the existing optical ACS data in that field was insufficient to properly exploit the new WFC3/IR imaging for the selection of galaxies at z ≳ 6.5 and devoting this time to accumulating deep F814W imaging for the parallel exposures was determined to be the most efficient way of improving this situation for maximum legacy value.
We list in Table 3 the values of the zeropoints corresponding to the four WFC3/IR bandpasses that we used, as well as for the ACS/WFC F814W bandpass that we used to observe the parallel field. We also indicate locations where more updated information may be available, if necessary. These zeropoints have an accuracy of at least ∼1% to 2%; remaining uncertainties may be related to time-dependent changes in the filter or instrument properties, or to improved knowledge of the standard stars that are used in determining the calibrations.
Table 3. WFC3/IR and ACS/WFC Zeropointsa
| Instrument/Camera | Filter | Zeropoint |
|---|---|---|
| (AB mag) | ||
| WFC3/IR | F105W | 26.269 |
| WFC3/IR | F125Wb | 26.230 |
| WFC3/IR | F140W | 26.452 |
| WFC3/IR | F160W | 25.946 |
| ACS/WFCc | F814W | 25.947 |
Notes. aCurrent information on zeropoints is available at http://www.stsci.edu/hst/acs/analysis/zeropoints http://www.stsci.edu/hst/wfc3/phot_zp_lbn bIn this paper we present information for F125W, for which we did not obtain new observations, but instead provide an improved reprocessing of existing data for consistency with the other observations that we obtained. cOur ACS/WFC data are obtained as parallel exposures on the UDF-par2 field and do not overlap with the WFC3/IR observations obtained on the main UDF field.
Download table as: ASCIITypeset image
2.2. HST Observations and Dither Patterns
Due to HST scheduling constraints on our UDF12 program, we divided the 128 orbits into a total of 64 visits, where each visit consisted of two orbits, and each orbit consisted of two prime WFC3/IR exposures, accompanied by two parallel exposures using the ACS/WFC camera. We adopted similar observing strategies to previous programs in order to provide uniformity within the final combined datasets. In particular, our dither patterns followed a strategy consistent with that of the previous UDF09 observations (Oesch et al. 2010a, 2010b; Bouwens et al. 2011b), which in turn had been based on the original UDF dither strategy (Beckwith et al. 2006). Each of the 64 visits (four exposures each) consisted of a four-point dither pattern, shifted around the sub-pixel phase space to provide the best possible point-spread function (PSF) sub-sampling on both the WFC3/IR detector, with its relatively large pixel scale (0128 pixel−1) and the ACS/WFC CCDs (005 pixel−1). In addition, each of these 64 sets of four-point dithers was offset onto a larger-scale grid, with offsets of ∼ ±3 arcsec to cover the ACS/WFC chip gap and mitigate large defects and persistence on the WFC3/IR detector, as well as providing additional sub-pixel phase space sampling.
All of our near-infrared UDF12 observations were obtained with the WFC3/IR detector, using the IR-FIX aperture, which samples the full imaging field of view (1014 × 1014 pixels, covering a region ∼130'' across, with a plate scale of 0128 pixel−1 at its central reference pixel). We used the SPARS100 MULTIACCUM mode for all our exposures, with NSAMP values of 15 or 16 (depending on scheduling constraints for each orbit). The first two samples consist of two short reads, separated by 2.9 s, to provide an initial bias structure determination, thus the total exposure times are either 1302.9 or 1402.9 s, respectively, with the detector read out non-destructively at intervals of 100 s after the first two samples.
The parallel optical UDF12 observations were all obtained using the ACS/WFC camera, which comprises two CCDs with a usable area of 4096 × 2048 pixels, covering ∼200'' in extent with a plate scale of 005 pixel−1 at the central reference pixel. The two detectors are located adjacent to one another with a small physical gap between them of ∼25. We used the WFC aperture for all the ACS exposures. The exposure times ranged between 1200 to 1300 s, depending upon orbital visibility constraints.
3. DATA CALIBRATION AND PROCESSING
Our final combined UDF09+UDF12 image mosaics for WFC3/IR, as well as our parallel mosaics obtained with ACS/WFC, have been processed with a version of the "MosaicDrizzle" image combination pipeline, specially modified for the UDF12 program (see Koekemoer et al. 2002, 2011, for a more general description). This performs astrometric alignment and registration, cosmic-ray rejection, and final combination of the exposures using the MultiDrizzle software (Koekemoer et al. 2002), as well as the Drizzle software (Fruchter & Hook 2002). In this section we provide descriptions of the input datasets, as well as the processing that was carried out within "MosaicDrizzle," along with the resulting characteristics of the mosaics that were produced. We also processed all the UDF09 WFC3/IR data on the main UDF in a similar way, as well as all the other overlapping WFC3/IR data that were previously described.
3.1. Initial WFC3/IR Standard Calibration
We initially processed all our raw WFC3/IR images through standard calibration using the Pyraf/STSDAS task calwf313 in order to obtain a first-pass set of calibrated images and carry out initial data quality validation. This task populates the bad pixel arrays using known bad pixel tables, and subtracts the bias for each read using the reference pixels around the border of the detector. It then carries out a subtraction of the zeroth read in order to remove the bias structure across the detector, followed by a subtraction of the dark current reference files for the SPARS100 read-out sequences. This was followed by the non-linearity correction and photometric keyword calculation using the current filter throughput tables and detector quantum efficiency curves.
While the initial calibration was carried out using the standard pipeline dark reference files, we found that we could improve the S/N in the final mosaics by constructing a custom dark frame from the full set of dark calibration files, which had been obtained on-orbit for the same readout mode and exposure times that we were using. Therefore we constructed a dark frame and used it to recalibrate all the exposures, including our own and those from all the previous WFC3/IR observations on this field.
After having removed basic instrumental effects from each read, the exposures were then passed through the up-the-ramp slope fitting and cosmic-ray rejection steps in calwf3. For each pixel, this performs a linear fit to the accumulating counts that are sampled during each MULTIACCUM read, while rejecting outliers as being due to cosmic rays. A final count-rate value was then computed for each pixel using only the unflagged reads and was stored as the count-rate in the final calibrated exposure. The uncertainty in the slope of counts versus time was stored in the error extension of the image.
3.2. Additional Processing for WFC3/IR Exposures with Time-dependent Variable Sky Background
A fraction of the UDF12 exposures were affected by sky background emission that varied significantly as a function of time during the course of the read-out sequences. This was most noticeable in the F105W filter, due to the wavelength-dependent nature of the background sky emission. The resulting time-dependent sky background variation introduces a non-linear component into the counts that are measured at each read during the MULTIACCUM sequence. A consequence of this is that the standard calwf3 up-the-ramp cosmic-ray rejection and count-rate, slope-fitting algorithm breaks down for these exposures, because that algorithm is designed for count-rates that are constant in time. Therefore, the resulting count-rate images after the completion of calwf3 can have significantly non-Gaussian noise properties, which can adversely impact the S/N of the final mosaics, by up to several tenths of a magnitude or more, if they are included as-is.
We show in Figure 2 the impact of this effect on an example exposure, starting with the left panel showing the original image after default calibration with the standard calwf3 up-the-ramp cosmic-ray rejection. The primary impact of the time-variable sky during this exposure is to introduce instability into the up-the-ramp cosmic-ray fitting, resulting in a final calibrated image that is significantly more noisy than usual, with the noise displaying a "grainy" pattern as shown in the image, corresponding to a substantially non-Gaussian distribution for the pixel fluxes. To mitigate the impact of this issue on the final mosaics created for this project, we examined several approaches to remove the time-variable sky. The simplest solution is to exclude a few reads from the MULTIACCUM sequence, usually near the end because the sky is generally brighter toward the end of an orbit as the bright earth limb is approached (whereas at the start of the orbit, the limb angle is usually sufficiently high for this not to be a problem after guide-star acquisition is completed). This approach was found to be effective for the majority of the affected images, where the sky only increased in a small number of reads. In a small fraction of remaining exposures, however, a larger portion of reads was affected. For these frames, we subtracted the sky from each MULTIACCUM read separately, which worked well in the majority of cases. For a small number of remaining exposures, the sky increase was markedly non-uniform across the detector. For these images, we adopted an approach of fitting the time-varying sky for each pixel using a non-linear function (generally well described by a second- or third-order polynomial), and then subtracting this before calibrating. In all cases, the variable sky component was successfully removed, enabling us to continue the calibration.

Figure 2. Demonstration of the impact of time-dependent variable sky background on the WFC3/IR images, as well as the correction for this effect, as described in more detail in Section 3.2. All the images are shown to the same grayscale stretch. Left: initial image after original calibration using the default calwf3, showing strongly non-Gaussian noise properties; middle: resulting image once intermediate correction has been applied for the time-dependent variable sky and subsequent recalibration, which we have developed for this project; right: similar exposure that was not affected by time-dependent variable sky; the noise properties of the corrected images (e.g., middle) are now similar to normal images such as those on the right, and can be safely combined in the mosaic without adversely impacting its final signal-to-noise.
Download figure:
Standard image High-resolution imageThe corrected exposures were subsequently passed through the remaining steps in calwf3, particularly the up-the-ramp cosmic-ray rejection and slope-fitting routines, which now performed successfully because the incoming counts were all linear in time. It was verified that in all cases the resulting images had pixel distributions that were now fully consistent with a pure Gaussian photon noise distribution, and that the pixel values in these images accurately reflected the mean sky background, as well as having the correct corresponding noise properties. Furthermore, the photometry of the sources extracted from these images was identical to that obtained from exposures that had no time-dependent sky background. Therefore, after passing all tests on their photometric and statistical properties, these images were subsequently included among all the others in the final mosaic combinations, including all previous WFC3/IR data obtained on these fields, enabling the required depths to be achieved.
3.3. WFC3/IR Persistence, Warm Pixels, and Flat Field Correction
After the default calibrations had been applied, we implemented several further corrections to improve the WFC3/IR data that are not part of the standard calwf3 pipeline. The first of these concerns the presence of persistent flux in certain pixels due to bright sources having been observed in previous exposures, which can be a significant issue for the WFC3/IR detector.14 In some cases, we were able to make use of darks from the WFC3 calibration program, which had executed just prior to our UDF12 visits, to aid in identifying and measuring problematic pixels. Pixels with persistent flux were then identified in these dark frames if they exceeded a count-rate threshold of 5σ above the mean, and were flagged in the following science exposures. For subsequent orbits during a visit, we could then determine directly from the preceding exposures which pixels may contain sufficient flux to cause persistence; the calibration darks were only needed for the first orbit in a visit, when the previous data might be from another program and not necessarily accessible. In those cases, we also made use of the persistence masks created for all exposures, accessible from the aforementioned Web site maintained by the WFC3 team, which we verified were successful in excluding all pixels that were affected by persistence.
We also identified additional "warm" pixels by using the full set of on-orbit dark exposures obtained during the UDF12 campaign to identify pixels that exceeded a threshold of 5σ above the mean, in which case they were flagged in the data quality arrays associated with each image and excluded from the final image combination. We further assembled median stacks of all exposures, flagging any pixels that varied significantly compared to the general population, which resulted in a small number of additional pixels being flagged that were not caught from the dark files.
Finally, the WFC3/IR detector is subject to IR "blobs" (Pirzkal et al. 2010; Pirzkal & Hilbert 2012), which have appeared in the WFC3/IR channel since launch and were not present in the ground flats, as well as some residual large-scale variation in the overall structure of the flatfield. While these are accounted for to some extent in the current calibration files, they remained noticeable in the deep, combined UDF12 imaging. We therefore made sure to mask out all regions affected by the blobs in each exposure, as well as applying large-scale, low-level residual corrections to the flatfields as needed. We verified that the resulting images were flat to within ∼1% to 2% of the mean sky level.
3.4. ACS/WFC Calibration
Each of the raw ACS/WFC exposures in the UDF12 parallel field were initially calibrated using the Pyraf/STSDAS task calacs. This included bias subtraction, dark current correction, bad pixel masking, and flatfielding. In addition, a number of other corrections need to be applied to ACS data, given the length of time that the instrument has been on orbit, as well as accounting for electronic effects in the new CCD Electronics Box Replacement (CEB-R) that was installed during Servicing Mission 4 (SM4). The first of these involves the correction for bias striping noise (Grogin et al. 2010) that is introduced by the electronics and manifests itself as a bias amplitude variation from one row to the next.
In addition, calacs corrects for the impact of Charge Transfer Efficiency (CTE) degradation, whereby charge traps present in the pixels can capture some of the electrons during readout, leading to a loss of flux in the original pixel. This manifests itself as deferred-charge trails along the columns behind bright pixels in each exposure, while also producing a net astrometric shift up along in the column for bright sources. The effect becomes increasingly severe for pixels furthest from the amplifiers, which for these detectors are the pixels near the chip gaps. A key point about the CTE correction algorithm (Anderson & Bedin 2010) is that it is effectively a deconvolution, by virtue of the fact that it restores the charge profiles of pixels along a particular column to their original shape, which is sharper and more concentrated than the observed profiles that have been smeared by the deferred charge trails. As such, the pixel-to-pixel noise in the final reconstructed image is also somewhat higher than in the original exposure. Tests to date have shown that this algorithm correctly reproduces the expected noise that would be present in the images if no CTE degradation had been present, and that it restores both the photometry and the astrometric accuracy to levels that are comparable to images without CTE degradation.
Finally, our UDF12 parallel ACS pipelines implement a routine to correct for additional bias-related offsets between the ACS/WFC3 detector amplifier quadrants that are not fully corrected during standard calibration. This routine fits for the differences between quadrants using an iterative clipping procedure to eliminate the signal from astronomical sources and preserve only the background flux, which then removes the residual amplifier quadrant differences and places all four quadrants on a uniform background level.
3.5. Exposure-level Distortion Correction
Once all the separate prime exposures in WFC3/IR, together with the parallel exposures from ACS/WFC, had been processed with the initial phases of our calibration pipelines at the level of correcting for detector-level instrumental effects, they were subsequently passed through the next part of the pipelines. The first step of this part of the pipeline consists of removing the distortions by drizzling all the exposures within each visit separately onto a set of "single-drizzled" images for that visit. Ideally these images would be exactly aligned with each other if there were no small uncertainties in spacecraft positioning during that visit. The repeatability of guide-star acquisitions and dither offsets performed by the spacecraft can vary by up to ∼5 to 10 mas over the course of a visit, which is generally manifested as small shifts; we note that rotation offsets within a visit are generally negligible since the spacecraft generally maintains a constant roll angle during a given visit.
When the exposures are drizzled onto individual separate images, the distortion across the detector is removed to the level of accuracy inherent in the geometric distortion models for the detectors. For ACS/WFC, these are described in further detail by Anderson (2007). In particular, for ACS we note that the new time-dependent distortion models enable our new parallel ACS data to be well aligned to the older overlapping ACS data to a level of accuracy better than ∼0.05 to 0.1 pixels. For WFC3/IR, we made use of distortion models published by Kozhurina-Platais et al. (2012); these did not include time-dependent terms, but this is not expected to be a significant effect for WFC3/IR yet, because it has not been on orbit for sufficient time to enable measurement of time-dependent changes. Our results from these measurements did not indicate any significant change in the accuracy of the distortion models between the old and new datasets for WFC3/IR.
3.6. Visit-level Cross-correlation Shifts
After all the exposures within a given visit had been drizzled onto separate distortion-corrected images, for the WFC3/IR and ACS/WFC exposures, separately, the shifts between all the exposures were measured using a cross-correlation approach, which is well suited for measuring small shifts in this type of dataset where a mixture of resolved and unresolved sources are present in the images. Because the distortion-corrected images have all nominally been placed onto the same pixel grid, according to the astrometric information in their headers, they would all align exactly if no uncertainties in the astrometry were present, therefore this technique is very sensitive to revealing small shifts that may be present between exposures.
To prepare the images for cross-correlation, the distortion-corrected images were first masked, retaining only regions around objects that contained sufficient signal (requiring a S/N greater than 3 in each pixel), and also being sure to taper the edges of these regions in order to avoid introducing aliasing during the correlation process. All exposures for each camera within the visit (treating WFC3/IR and ACS/WFC separately) were then cross-correlated to the first exposure as a reference, producing a cross-correlation image with a central cross-correlation peak corresponding to the pixel shift that produces the maximum cross-correlation signal between each pair of images. Each peak was then fit using a two-dimensional fitting routine to determine its location and associated uncertainty, which was then directly translated into shifts.
Once the astrometric shifts had been obtained from the cross-correlation peak for each image, these were then translated into offsets to be applied directly to the astrometric header information in the image. The images were then redrizzled using the updated astrometric information, and the cross-correlation was repeated on the redrizzled images. This time, the peak was generally centered at an offset near zero, within the uncertainties, indicating that the offsets had been successfully removed. This process was repeated for a few iterations, in order to ensure convergence of the cross-correlation with final uncertainties typically less than a few hundredths of a pixel for both the WFC3/IR and the ACS/WFC datasets.
3.7. Visit-level Cosmic-ray and Bad Pixel Rejection
After the relative shifts of all the WFC3/IR and ACS/WFC exposures within a given visit had been corrected, the next step consisted of carrying out cosmic-ray and bad pixel rejection for all the exposures of a given filter within that visit for each camera. This was done by carrying out a new run of MosaicDrizzle, this time using the improved astrometric information in the exposure headers in order to ensure accurate pixel-to-pixel alignment. This enables cosmic rays and bad pixels to be readily identified as outliers in a given exposure, compared to pixels at the same location in the other exposures. The driz_cr step of MosaicDrizzle was used for this part, which first created a series of separate drizzled images, one for each input exposure in both WFC3/IR and ACS/WFC, that were then used to create a median image of all the exposures in a given filter in that visit. Each median was created using the "minmed" algorithm, which allows the minimum pixel value to be used instead of the median in cases where the median is significantly higher. This is very useful in cases where valid pixels from only two or three exposures are present, when the median can be significantly impacted if cosmic rays are present in two of those exposures.
After having created a clean median image for each filter on WFC3/IR and ACS/WFC in a given exposure, this was then transformed back to the original detector frame of each exposure in order to carry out the rejection of cosmic rays and bad pixels. This approach is described in further detail in Koekemoer et al. (2002, 2011). The end result consisted of a mask of all the bad pixels and cosmic rays for each exposure in the visit.
3.8. Full Astrometric Corrections and Bad Pixel Rejection
With all astrometric corrections and bad pixel/cosmic-ray rejection having been completed at the visit level for all the exposures in both WFC3/IR and ACS/WFC, the next step consisted of aligning all the visits onto an absolute astrometric frame. At this point, although all relative shifts between exposures in a given visit had now been corrected, the visit itself may still be subject to errors in absolute astrometry due to guide-star astrometric uncertainties, which can introduce both a shift and a rotation offset.
The first step in this process consisted of constructing a clean, combined, drizzled, distortion-corrected image of all the exposures in each visit, for each filter in WFC3/IR and ACS/WFC, using the corrected relative astrometry of all the exposures, as well as the flag masks of all bad pixels and cosmic rays. Catalogs were then constructed on each of these cleaned drizzled images, using the SExtractor software (Bertin & Arnouts 1996). This provided a set of sources from each image that could then be directly matched to a fixed reference catalog. For our reference catalog for the main field covered by WFC3/IR, we chose the original UDF catalogs (Beckwith et al. 2006), whereas for our ACS/WFC3 imaging we used as a standard reference our own catalog, which we generated from the existing mosaics of the UDF-PAR2 field (Bouwens et al. 2011b).
We then trimmed the WFC3/IR and ACS/WFC catalogs from each visit to the relevant portion of the absolute reference catalogs and carried out catalog matching to solve for shifts and rotations using a series of iterative steps. In the first iteration we used a relatively large tolerance of up to a few arcseconds, limiting the match to only the brightest ∼20 to 30 sources in each image, to account for the size of the potential uncertainties in the initial absolute position as indicated by the guide-star astrometry. Once these large-scale shifts in right ascension and declination had been determined, we then carried out a number of additional iterations—using a larger sample of sources from each image catalog, tightening the matching tolerances to 01, and solving for shifts combined with rotations—until convergence was reached when the measured shifts and rotations all remained below the measurement uncertainties. For all the filters in WFC3/IR and ACS/WFC, in all visits, there were generally ∼300 to 400 sources matched at the faintest levels, yielding net positional accuracies robust to the level of ≲0005, with corresponding rotational accuracies to the level of ≲0.001 deg.
In Figures 3 and 4 we show the final results from the full astrometric correction procedures, after having corrected the shifts and rotations of all the images in the input exposures. Figure 3 shows the difference between the measured positions of objects in the final drizzled mosaics, compared with their positions from the reference astrometric catalogs, after having removed all shifts and rotations that were initially present in the images. In Figure 4, these residuals are shown for all the sources across the main UDF field, with the aim of showing that there are no net systematics remaining in position or rotation, but that instead all residuals are random across the field. The sizes of the residuals are generally ≲5 mas, which is on the same level as the on-orbit jitter of HST and is also well below the scale of the PSF full width at half-maximum (FWHM), thereby demonstrating successful removal of all registration uncertainties.
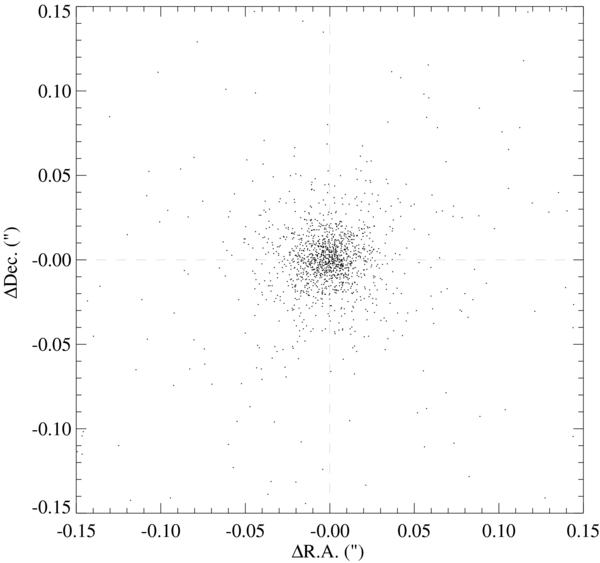
Figure 3. Residual uncertainties in astrometry for a total of ∼1400 objects detected in the main UDF12 field, which were cross-correlated with sources from the original UDF catalog by Beckwith et al. (2006) used for the astrometric registration for this project. Each point on the plot represents the remaining positional offsets between the sources after having corrected for all the global shifts and rotations. The residual offsets are ≲0005 after accounting for the positional uncertainty of each of the sources. As a result, the astrometry is sufficiently accurate to allow all the exposures in the dataset to be reliably combined with no significant residuals remaining.
Download figure:
Standard image High-resolution image
Figure 4. Residual uncertainties in astrometry represented as vectors on the UDF field for each of the individual UDF12 sources that were matched to the original UDF catalog by Beckwith et al. (2006). There are no systematic regions of net residual astrometric shift remaining across the image; instead, the residuals are random across the image, with their distribution reflecting that of the sources across the field. This further demonstrates that the accuracy of the overall alignment is sufficiently robust to enable reliable combination of the full set of input exposures and accurate alignment with the previous data on this field.
Download figure:
Standard image High-resolution image4. FINAL DATA PRODUCTS
4.1. MosaicDrizzle Combination
We combined all the individual exposures, for each filter, into a final mosaics using "inverse variance weighting," whereby a weight map was created for each exposure, containing all the uncertainties that are intrinsic to a particular exposure (such as dark current, read-noise, background sky noise, modified by the gain of the detectors as well as the flat field). Note that this excludes the additional Poisson terms from sources in the image, which can be added separately after the fact, if needed.
As an iterative step during the combination process, we also removed the residual background structure that was present at extremely low levels in a fraction of the exposures, and that had not been accounted for by the process described earlier for the removal of time-variable sky background. This was done by first creating a source mask, which was constructed from the full-depth mosaic obtained by combining all the different filters into a single image. The full-depth image was smoothed using a 2-pixel Gaussian to create a mask for relatively small, faint sources, followed by a larger-scale 10-pixel Gaussian that created a second mask for larger sources. We found that these two scales were sufficient to construct a mask for all the sources present in the full-depth image, also excluding their faint outer extended emission. Applying the resulting source mask to the affected exposures then provided a source-free image, containing only empty background regions, which was then fit for each affected exposure using a very low order two-dimensional fit (on scales no smaller than about a hundred pixels), and subsequently subtracted from that exposure. Re-running the combination, including these background corrected exposures, then resulted in final combined mosaics that had no significant large-scale variations across them and were uniformly flat to well within the final rms levels.
The pixel scale for the output mosaics is driven by the detector plate scale and pixel size, together with the FWHM intensity of the PSF produced by the telescope optics. At the wavelengths of the WFC3/IR F105W to F160W observations, the HST PSF has a FWHM ∼ 012–018, which is subsequently convolved by the 0128 WFC3/IR detector pixel scale. Hence, the best PSF that could be recovered (without deconvolution), even in the ideal scenario of combining images using interlacing, which would minimize additional convolutions, still has a FWHM ∼ 017–019 in the final images. We choose an output pixel scale of 006 pixel−1 for the final WFC3/IR mosaics, providing adequate sampling of the PSF. We also chose a pixfrac parameter of 0.8, which is small enough to provide some reduction in the overall convolution as input pixels are mapped to the output plane, while at the same time not being too small, so that the overall pixel-to-pixel variation in the output weight map is not adversely affected. See Koekemoer et al. (2002, 2011), for further details about this parameter and its impacts on the final output images in the context of deep imaging surveys with HST.
Three months after the completion of the observations, we released all the calibrated mosaics to the public via the STScI archive,15 including the drizzled science mosaics and the inverse variance weight files that describe the noise associated with each pixel. Further updates on the project are provided at the primary UDF12 project website16 as needed.
4.2. Point-spread Function Characterization
In order to characterize the PSF quantitatively in each of our WFC3/IR and ACS mosaics, we carried out a series of measurements on unresolved sources in these images and compared them to the nominal expected values for each instrument. For the WFC3/IR mosaics on the main UDF field, we started with the sample of unresolved sources presented by Pirzkal et al. (2005), of which 25 are covered by our WFC3/IR mosaics. Because this paper did not include the parallel field for our ACS/WFC mosaic, we determined our own sample of unresolved sources on that mosaic and obtained measurements on a total of 25 of these sources to match the statistics for the WFC3/IR sample. In each case, our unresolved sources cover the entire field of each mosaic. For each of these sources, in the WFC3/IR and the ACS/WFC mosaics, we then carried out a two-dimensional Gaussian profile fit to the central peak and obtained the corresponding FWHM value for each source, in each filter. We subsequently determined the sample mean and standard deviation values from all the measurements of all the sources, in each filter, which we present in Table 4.
Table 4. Point Spread Function FWHM Valuesa
| Instrument | Gaussian | Gaussian | PSF Model |
|---|---|---|---|
| and Filter | FWHM ('') | 1σ-rms ('') | FWHM ('') |
| WFC3/IR F105W | 0.181 | 0.010 | 0.182 |
| WFC3/IR F125W | 0.185 | 0.018 | 0.184 |
| WFC3/IR F140W | 0.187 | 0.011 | 0.190 |
| WFC3/IR F160W | 0.190 | 0.010 | 0.197 |
| ACS/WFC F814W | 0.093 | 0.005 | 0.098 |
Note. aMeasured PSF properties from unresolved sources in our final, full-depth combined mosaics for WFC3/IR (F105W, F125W, F140W, F160W) and ACS/WFC (F814W) and comparison with the nominal PSF model values expected for each instrument. See Section 4.2 for further details.
Download table as: ASCIITypeset image
We also present in Table 4 the expected results from the current nominal PSF model values for these instruments. For WFC3/IR, we use the PSF model FWHM values as presented in the WFC3 Instrument Handbook for Cycle 21, version 5.0, 2012 December. For ACS, we use the values tabulated in the ACS Instrument Handbook for Cycle 21, version 12.0, 2012 December. Because these tabulated model values do not yet account for convolution by the detector pixel scale and subsequent drizzle convolutions, we first apply those convolutions to the PSF model values, and then present the convolved values in Table 4 to enable a direct comparison with our measured values from our own mosaics.
The comparisons generally show excellent agreement between our measured PSF values from our mosaics, and the nominal convolved instrument PSF model values, especially for the crucial shorter wavelengths of WFC3/IR and ACS/WFC. None of the values differ by more than 1σ from the nominal instrument models, for any of the filters. This indicates that the telescope was well focused during these observations for both instruments, and also indicates the quality of our relative astrometric alignment on all the visits that we combined to make the final, full-depth mosaics. We note that the WFC3/IR PSF has significant non-Gaussian power in its wings, particularly toward longer wavelengths; however, a Gaussian model provides an acceptable description for the core of the PSF. Therefore, these results show that the measured PSF values from our mosaics for WFC3/IR and ACS/WFC are in excellent agreement with the best possible PSF performance expected from the instruments.
4.3. Photometric Limiting Depth Validation
We have carried out a series of photometric and limiting depth tests on the full combined WFC3/IR mosaics, aiming to validate the depth achieved in absolute terms and relative to the previous data on this field. In order to quantify the limiting depth across the mosaic, we first constructed a full-depth, full-filter mosaic using all the WFC3/IR observations on the UDF, in all four filters (F105W, F125W, F140W, F160W). This broad-band image provided extremely deep sensitivity for masking out the extended faint wings of sources, which is necessary in order to obtain genuinely source-free regions in order for an accurate background rms estimate to be obtained. In order to improve the S/N with which faint objects were masked, we created smoothed versions of this full-depth image by convolving it with a small-scale Gaussian (2 pixels FWHM, aimed at detecting and masking all the faint sources), as well as a larger-scale Gaussian (10 pixels FWHM), which successfully masked all extended emission around larger sources.
In Figure 5 we show the full-depth image obtained from all four filters, which was used to create the object mask that we subsequently applied. The object mask excludes about 45% of all the pixels in the mosaic; the remaining pixels were then considered to represent the pure sky background (along with potentially exceedingly faint sources that were not included in the object mask). The statistics of these pixels were analyzed using several different tests, in order to determine the rms values on small scales, as well as determining the global uniformity of rms depth across the mosaic. These pixel-to-pixel rms values, after accounting for correlated noise, then provide a direct estimate of the limiting sensitivity of the mosaic.
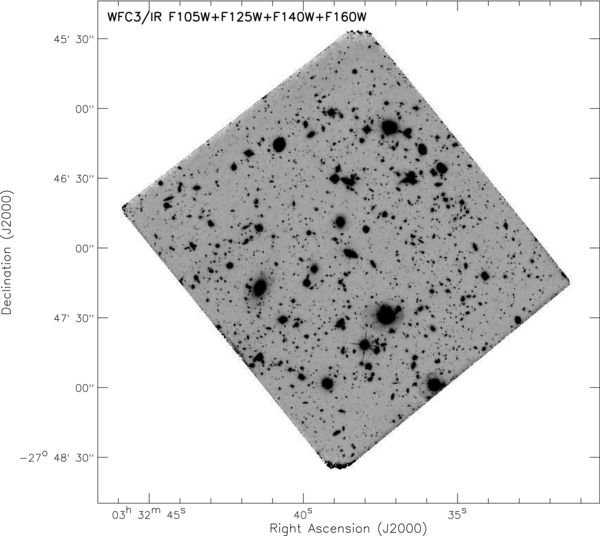
Figure 5. Full-depth UDF image, created by combining all the WFC3/IR F105W, F125W, F140W, and F160W exposures, that was used to create the object mask subsequently used for the blank sky statistical measurements for the limiting depth calculations. This is the deepest possible image currently achievable in the near-infrared, having being constructed from all existing WFC3/IR observations on the UDF.
Download figure:
Standard image High-resolution imageThe first test involved dividing the mosaic into a regular grid of cells in order to determine the relative degree of depth variation across the mosaic, as well as the degree of flatness in the residual sky level. This test reveals the degree of uniformity in detection sensitivity between different cells and the impact of any remaining large-scale residuals in the background sky, which would serve to broaden the global measured rms as compared with the average of all the individual rms measurements obtained in the different cells. The results from these tests are shown in Figures 6 to 10, where we translate the pixel-to-pixel rms into 5σ limiting magnitudes in apertures of diameter 04, 044, 047, and 050, respectively, for F105W, F125W, F140W, and F160W (corresponding to 70% of the total enclosed flux in all cases), as well as 04 for ACS/WFC F814W, after having accounted for the presence of correlated noise by comparing the science images with the inverse variance weight maps. Figure 11 shows the full combined mosaics obtained on the UDF main field.
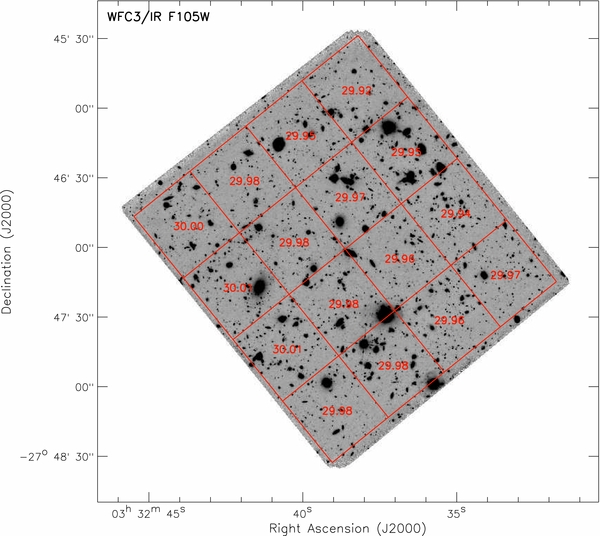
Figure 6. Measured 5σ limiting sensitivity in AB magnitudes across the full-depth WFC3/IR F105W UDF mosaic. See text for further details.
Download figure:
Standard image High-resolution image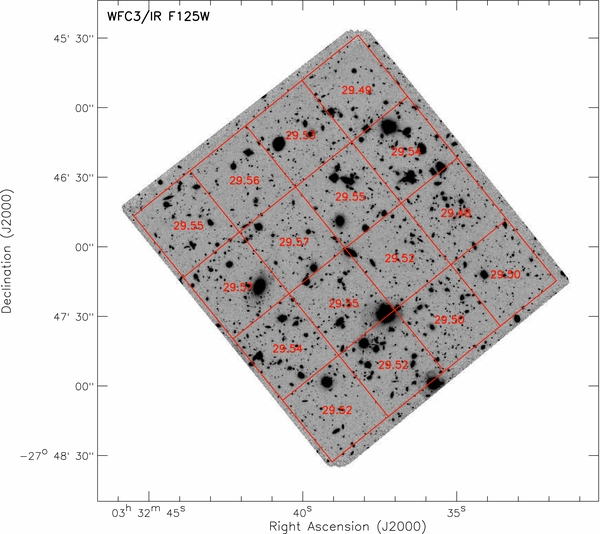
Figure 7. Measured 5σ limiting sensitivity in AB magnitudes across the full-depth WFC3/IR F125W UDF mosaic. See text for further details.
Download figure:
Standard image High-resolution image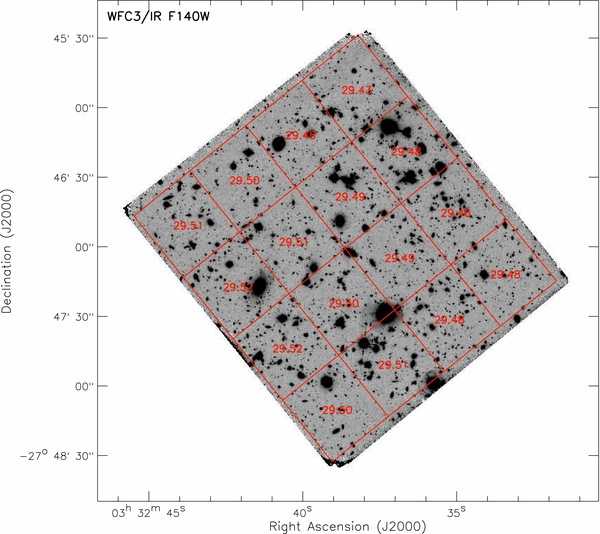
Figure 8. Measured 5σ limiting sensitivity in AB magnitudes across the full-depth WFC3/IR F140W UDF mosaic. See text for further details.
Download figure:
Standard image High-resolution image
Figure 9. Measured 5σ limiting sensitivity in AB magnitudes across the full-depth WFC3/IR F160W UDF mosaic. See text for further details.
Download figure:
Standard image High-resolution image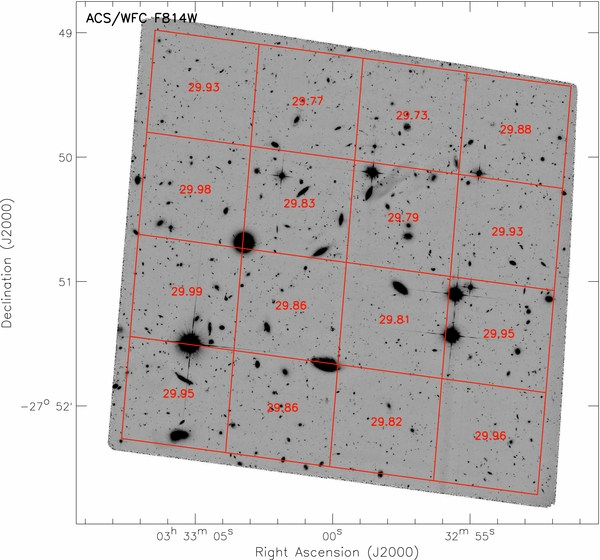
Figure 10. Measured 5σ limiting sensitivity in AB magnitudes across the full-depth ACS/WFC F814W UDF-PAR2 mosaic. We note that the "figure-eight" pattern visible slightly to the northwest of center is the result of an optical ghost formed by scattered light from the bright star that is located in this field.
Download figure:
Standard image High-resolution image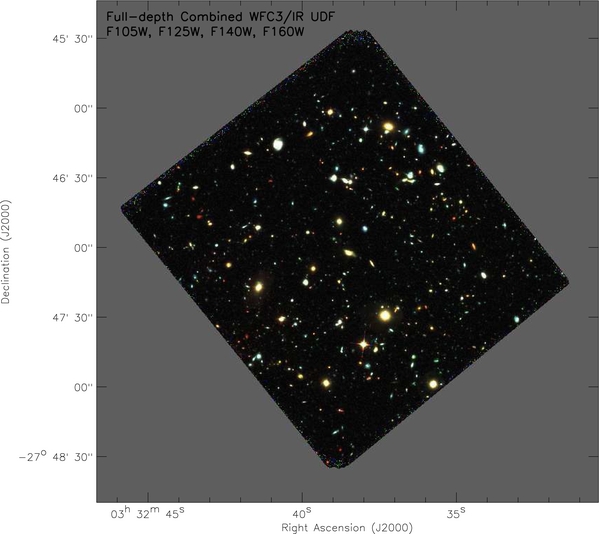
Figure 11. Image showing the full mosaics from our new WFC3/IR UDF12 data combined with the previous UDF09 and other data on this field, including all the WFC3/IR filters (F105W, F125W, F140W, F160W). This represents the deepest near-infrared image of the sky currently achievable, combining all existing WFC3/IR observations of the UDF into a single set of mosaics.
Download figure:
Standard image High-resolution image
In addition, the limiting depths are relatively uniform across the field, with residual variations ≲0.03 mag except for occasional areas of somewhat lower weight that correspond to known large defects on the detector. The global measured rms values from these tests agree very well with the average rms from the individual cells (≲0.01 magnitudes), indicating that the background residual sky structure is globally flat with no significant impact on the overall rms These results are presented in Table 5.
Table 5. Final Limiting 5σ Sensitivitiesa
| Instrument | Average | Global | Negative | Point |
|---|---|---|---|---|
| and Filter | rms | rms | Gaussian | Source |
| WFC3/IR F105W | 29.97 | 29.97 | 29.98 | 29.96 |
| WFC3/IR F125W | 29.53 | 29.52 | 29.55 | 29.51 |
| WFC3/IR F140W | 29.49 | 29.48 | 29.51 | 29.48 |
| WFC3/IR F160W | 29.45 | 29.45 | 29.46 | 29.44 |
| ACS/WFC F814W | 29.88 | 29.83 | 29.85 | 29.84 |
Note.
aMeasured depths for our final, full-depth combined mosaics, representing 5σ limiting depths in apertures of diameter 04, 044, 047, and 050, respectively, for WFC3/IR F105W, F125W, F140W, and F160W, and 04 for ACS/WFC F814W.
Download table as: ASCIITypeset image
We also performed blank-aperture tests, calculating the 5σ depths based on a total of 15,000 apertures placed within blank sky regions across the mosaic. These tests include fitting only the negative half of the pixel distribution, in order to exclude low-level positive sources, and used the same sized apertures as the previous tests. These results are also presented in Table 5. Finally, we performed a series of point-source recovery simulations on the images, using the PSF values as described in Section 4.2, and present these values as the final column in Table 5. We note that these point-source recovery tests primarily demonstrate self-consistency, as the empirical PSF values that we used for these tests also contribute to the correlated noise in the images; more detailed recovery tests of a variety of extended source profiles are described further in Ono et al. (2012). Overall, the results from all these tests agree very well, and indicate that the depths achieved match the expected sensitivities for each of the filters, for these full-depth mosaics, demonstrating that we achieve our proposed limiting depths of AB ∼ 30 mag for F105W, and AB ∼ 29.5 mag for F125W, F140W, and F160W in these mosaics that include all existing WFC3/IR data on this field, as well as achieving AB ∼ 29.85 mag for the full-depth ACS/WFC F814W mosaics on the parallel field.
5. SUMMARY
We have described the 2012 Hubble Ultra Deep Field campaign (UDF12), a large 128 orbit Cycle 19 HST program aimed at extending previous WFC3/IR observations of the UDF by quadrupling the exposure time in the F105W filter, adding a completely new F140W filter, and extending the F160W exposure time by 50%. The project is aimed at determining the role played by galaxies in reionizing the universe, and includes obtaining a robust determination of the star formation density at z ≳ 8, improving measurements of the ultraviolet continuum slope at z ∼ 7–8, facilitating the construction of new samples of z ∼ 9–10 candidates, and enabling the detection of sources up to z ∼ 12.
For this project we have created the deepest near-infrared images of the sky currently achievable, by combining our own WFC3/IR UDF12 observations with all previous existing WFC3/IR imaging observations of the UDF area into a single homogeneous dataset, as originally envisioned in our proposal, achieving 5σ limiting depths of AB ∼ 29.5–30.0 mag. We have described the observational aspects of the survey as motivated by its scientific goals, and have presented a detailed description of the data reduction procedures and products from the survey. We release the full combined mosaics, comprising a single, unified set of mosaics of the UDF, providing the deepest near-infrared blank-field view obtained of the universe to date, reaching magnitudes as deep as AB ∼ 30 in the near-infrared, and yielding a legacy dataset on this field of lasting scientific value.
We thank the referee for very useful comments that helped to improve this manuscript. We wish to thank the Hubble observing team as well as our Program Coordinator, Shelley Meyett, for help in scheduling and executing this program. Support for HST Program GO-12498 is provided by NASA through a grant from the Space Telescope Science Institute, which is operated by the Association of Universities for Research in Astronomy, Incorporated, under NASA contract NAS5-26555. J.S.D., R.A.A.B., T.A.T., and V.W. acknowledge the support of the European Research Council through the award of an Advanced Grant to J.S.D. In addition, J.S.D. and R.J.M. acknowledge the support of the Royal Society via a Wolfson Research Merit Award and a University Research Fellowship, respectively. A.B.R. and E.F.C.L. acknowledge the support of the UK Science and Technology Facilities Council. V.W. acknowledges the support of the European Research Council through the award of a Starting Grant. S.C. acknowledges the support of the European Commission through the Marie Curie Initial Training Network ELIXIR.
Facility: HST (ACS, WFC3) - Hubble Space Telescope satellite
Footnotes
- 10
Note there is a separate UDF program, in the ultraviolet with WFC3/UVIS (ID 12534; Teplitz et al. 2013), probing lower redshifts complementary to the very distant universe discussed here.
- 11
- 12
- 13
Further documentation for all the PyRAF/STSDAS data reduction software is provided at http://stsdas.stsci.edu/.
- 14
- 15
- 16