


ABSTRACT
Near-infrared photometric measurements for 131 Northern Galactic Cepheids are presented. The Cepheid light curves are sampled with an average of 22 measurements per star fully covering the phase of each Cepheid. The J, H, and K light curves for each Cepheid were uniformly interpolated to find the intensity mean magnitudes within each band. The results are consistent within ±1% for 26 stars in common with previous studies. This paper is the first in a projected series of two papers which will provide additional fundamental data for Cepheids in the Galaxy, namely, NIR photometry and line-of-sight extinction. In the course of this project, 93 additional variables were fortuitously observed within the Cepheid program fields, 82 of which have previously not been identified.
Export citation and abstract BibTeX RIS
1. INTRODUCTION
In the past decade there have been major improvements constraining the fundamental cosmological parameters of the concordance model (Spergel et al. 2007; Komatsu et al. 2011) and there have been great strides in addressing and reducing the systematic and statistical errors in measurements of the Hubble Constant, H0 (Freedman et al. 2009; Riess et al. 2009) on which the concordance model greatly depends. Currently, it is the near-infrared (NIR) Cepheid period–luminosity (PL) relation that is being used to determine distances to nearby galaxies which provide the link to farther galaxies in the Hubble flow containing Type Ia supernovae on which the determination of H0 depends. The NIR PL relation yields less dispersion and fewer systematic errors than the optical PL relation (Madore & Freedman 1991). This has been dramatically shown to be the case for Cepheids in the Large Magellanic Cloud (LMC; Persson et al. 2004) and similarly for a sample of Galactic Cepheids for which NIR photometry currently exist (Fouqué et al. 2007; Gieren et al. 1998).
The uncertainty of the LMC distance and slope of the LMC PL relation are the largest contributors to the total uncertainty in H0. Despite having an ensemble of distance measurements and a statistical distance uncertainty of less than 5% (Gibson 2000; Freedman et al. 2001), the LMC PL relation is not definitive because the LMC has significantly lower metal abundance than those more luminous galaxies that it is subsequently used to calibrate. On the other hand, the Galactic NIR PL relation would be better suited to calibrate the PL relation. However, due to a small sample size and the uncertainties in the individual distances and extinctions to each Galactic Cepheid, the Galactic NIR PL relation currently has higher dispersion than the LMC NIR PL relation.
One method to reduce the systematic errors on H0 is to measure Cepheid NIR PL distances to Tully–Fisher/Type Ia calibrating galaxies independent of the LMC. This requires an alternate template PL relation. Riess et al. (2009), using the Hubble Space Telescope (HST) NIR H band, observed Cepheids in the maser galaxy NGC 4258 which has an independent geometrical distance uncertainty of ∼3% (see Riess et al. 2009, and references therein) and has the added benefit of having comparable metal abundance and crowding effects as the calibrating galaxies. Another alternative is to use the Galactic NIR PL relation which offers the possibility of a larger calibrating sample size as more parallaxes become available. The Galactic Cepheids have similar metal abundance to the Tully–Fisher and Type Ia calibrators but require an a priori knowledge of the distance and line-of-sight extinction to each Cepheid. This approach will soon receive a promising reprieve provided by the Global Astrometric Interferometer for Astrophysics (GAIA) astrometric mission, which should obtain high-precision parallaxes to hundreds of Galactic Cepheids. In this scenario, NIR measurements of additional Cepheids will provide the means to statistically reinforce the Galactic NIR PL relation; this was the motivation for this survey.
2. RESEARCH TO DATE
Near-infrared observations of Cepheids have several advantages over the optical; however, to date, NIR observations of Galactic Cepheids are limited mostly to the studies performed by Welch et al. (1984), Laney & Stobie (1992), and Barnes et al. (1997), hereafter collectively referred to as WLB. When combined and limited to known Fundamental Mode Galactic Cepheids (FMGCs), these studies result in a sample of 64 stars. Other Galactic Cepheid studies in the NIR include the work of McGonegal et al. (1982) and Schechter et al. (1992); however these studies were limited to less than five observations per Cepheid and large surveys like Two Micron All Sky Survey (2MASS; Skrutskie et al. 2006) contain even fewer epochs. These measurements often contain too few data to measure an accurate average intensity and were in many cases superseded by the WLB data. Template fitting (Soszynski et al. 2005) is one way to estimate mean magnitudes from sparsely sampled NIR data. A drawback to template fitting is that it requires greater effort and leads to larger uncertainties compared to the direct measurements from well-sampled NIR light curves.
Constructing the Galactic PL relation requires information about the distance and extinction to each Cepheid in the Galactic sample. Fouqué et al. (2007) has compiled the distances to 59 Galactic Cepheids which have NIR data available from the WLB sample. The reddening and distance measurements were compiled from a variety of methods which include: HST parallax measurements (Benedict et al. 2007), revised Hipparcos parallaxes (van Leeuwen et al. 2007), Cepheids in clusters (Turner & Burke 2002), interferometric Baade–Wesselink parallaxes (Lane et al. 2002; Kervella et al. 2004; Mérand et al. 2005), and Barnes–Evans (BE; Barnes et al. 1976) infrared surface brightness (IRSB) parallaxes (Barnes et al. 2005). The latter method makes use of NIR photometry and radial velocity curves to estimate the radii and distances to Cepheids.
Future missions like the GAIA will measure the parallaxes of Galactic Cepheids with superior accuracy and better precision (Lindegren 2005) than ever before. It should therefore be possible for GAIA to obtain unprecedented parallaxes to hundreds of known Galactic Cepheids. With such a large sample of high-precision distances to Galactic Cepheids the major source of uncertainty in the Galactic Cepheid PL relation will be the photometric mean apparent magnitudes derived from their light curves and uncertainties in the line-of-sight extinction.
With the prospect of obtaining Galactic Cepheid parallaxes from GAIA and the advantages of observing in the NIR, calibrating the best possible Galactic PL relation requires additional well-sampled light curves in the NIR of Galactic Cepheids. In this work, we present the mean magnitudes for 131 Northern Galactic Cepheids with the goal of providing a large homogenous sample of accurate mean magnitudes derived from the well-sampled light curves of Galactic Cepheids. When combined with existing data from WLB a set of 186 Galactic Cepheids with full-phase NIR measurements may be used to calibrate the Galactic NIR Cepheid PL relation once distances to these Galactic Cepheids become available.
3. OBSERVATIONS
All observations were obtained during a 10 month span in 2008 at the University of Wyoming Red Buttes Observatory (RBO). Cepheids were observed in 129 fields with the 0.6 m telescope using BIRCAM, a near-infrared imaging camera with a 13 arcmin field of view (Monson & Pierce 2009). The survey was restricted to Fundamental Mode Cepheids in order to avoid contaminating the NIR PL relation with higher-order Cepheid pulsation modes. Figure 1 shows an example of one of the fields observed in this survey.
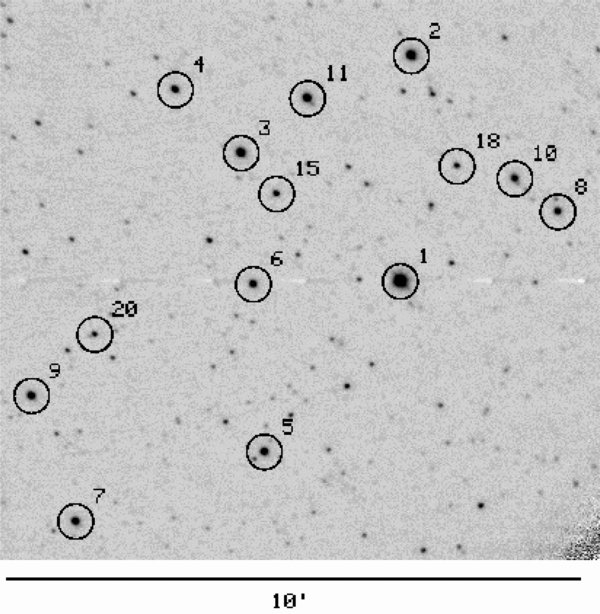
Figure 1.
Finding chart for stars in the SZ AQL field. Numbered objects are presented in Table 2. The finding charts of the other fields are available in the online version. (The complete figure set (129 images) is available in the online journal.)
Download figure:
Standard image High-resolution image3.1. Survey Sample
The sample was chosen from a catalog of 324 FMGCs compiled by Tammann et al. (2003). Stars below a declination of −20° were removed from the sample. The remaining sample was chosen based on brightness, target visibility, and availability. As the survey progressed, fainter stars were rejected in lieu of obtaining well-sampled phase points for stars already included in the sample. The phase of each Cepheid was computed in real-time proceeding and during each night of observing. A spreadsheet was used to graphically illustrate both the real-time phase of each Cepheid as well as the sampling to date. This allowed us to optimize the phase coverage of each variable and minimize any duplication of phase sampling.
A handful of bright Classical Cepheids (i.e., delta CEP) are too bright and were removed from the sample, while a small number of moderately bright Classical Cepheids (i.e., RT AUR) were observed by taking images out of focus. The cluster Cepheids CEa and CEb CAS have an apparent separation of 2 5 and were observed in the same field as CF CAS, however CEa and CEb CAS were not individually resolved by BIRCAM, thus their light curves are superimposed on each other. The photometric measurements for CEa + CEb CAS is provided in the online data, but no attempt has been made to decouple the individual light curves and no average magnitudes are reported for these two Cepheids.
3.2. Observing Strategy
Each Cepheid was observed an average of 22 epochs in the J, H, and K filters. The exposure times varied for each Cepheid based on the Cepheid brightness and the sky background. Because BIRCAM used the (full) K filter, the background was higher and more variable with ambient temperature making the K data noisier than the J. Each observation consisted of a sequence of J, H, and K filtered observations with no fewer than five dithered offsets in each band. As a sequence commenced the next priority target was queued based on visibility and phase priority, as described above, in order to maximize the efficiency of the survey.
At least five measurements were made of standard stars throughout each night to judge quality and calibrate the data. Standards were chosen on the CIT system (Elias et al. 1982) due to available brightness and sky coverage. Sky flats were taken at dusk and dawn when possible, and archival flats were used for partially clear nights. K-band flats were made by differencing sky flats of equal exposure time taken at different ambient temperatures (midnight versus dawn). The difference removed internal thermal scattered light within BIRCAM and left a more uniform sky component for the K-band flat field.
The data were reduced using a pipeline which aligned and co-added individual flat-fielded frames using the IRAF task "XDIMSUM." This task was used to apply a bad-pixel mask for the detector and to perform a background subtraction for each image. Point sources were identified in each image using SExtractor 2.5.0 (Bertin & Arnouts 1996) and astrometric coordinates were found for each object by correlating the sources found to the 2MASS point source catalog (Cutri et al. 2003) using the wcstools 3.7.2 package3 (Mink 2002), more details can be found in Monson (2009).
4. PHOTOMETRIC CALIBRATION
4.1. Aperture Photometry
The BIRCAM images are not perfectly free from aberrations across the field and some Cepheids were observed out of focus; for these reasons, aperture photometry was used to measure stellar fluxes in each field. The raw photometric data were calibrated to the CTIO/CIT system using nightly Elias standards (Elias et al. 1982). The standard star fields are generally free of crowding and an aperture radius of 19 arcsec was used for all standard star measurements since this aperture was large enough to measure essentially all the flux from the standard star. For comparison the average seeing at RBO with BIRCAM was 3–4 arcsec. The photometric parameters for the 88 nights of this survey can be found in Monson (2009). The average rms of the nightly photometric solutions was 0.012, 0.011, and 0.015 for J, H, and K, respectively. These represent the average (systematic/external) uncertainties for each Cepheid observation. The more crowded Cepheid fields required a smaller, default aperture of 7.6 arcsec. This aperture was chosen since in the majority of the fields observed it avoided contamination from nearby stars and it was effective at reducing noise from excess background. An aperture correction was applied based on curve of growth analyses for each frame to correct the aperture photometry to the aperture used for the standard star observations, namely, a radius of 19''. For a small number of very crowded fields, an aperture of 3.8 arcsec was used; again with an aperture correction. There were eight bright Cepheids that were taken out of focus to observe, and an aperture of 26.6 arcsec was used to wholly measure the flux, and thus no aperture correction was applied to these stars.
4.2. Ensemble Photometry
The multi-epoch data for each field were analyzed using the DAOMATCH and DAOMASTER programs provided by P. Stetson (2008, private communication). These routines were used to determine and apply zero-point offsets in each frame based on ensemble photometry of the field stars. Typically, for ensemble photometry of a single field all the frames are referenced to a master frame chosen by some figure of merit. Here, to place all the fields on the same homogeneous photometric system, instead of offsetting all the frames for a field to a single calibrated frame of that field, all offsets were referenced to the average of the calibrated frames of that field. In this way, we attempted to reduce the risk of picking a single discrepant epoch.
Ensemble photometry works by adding offsets which minimize the scatter of as many sources as possible while weighting sources by their brightness. In cases where there are only a few stable field stars, a second iteration of DAOMASTER was necessary where the known Cepheid and other variable star data were flagged by making their magnitude errors artificially high. This effectively removed their variability from the analysis so a stable realistic solution could be found. In some cases it took multiple passes to find and remove all the new variables found; see Section 5.3.
To empirically estimate the (random/internal) photometric error in an individual Cepheid observation, the ensemble variance of field stars was used. This was done since it was not known how reliable the predicted photometric uncertainties were given the effects of crowding and background variability; especially in the K band. Figure 2 shows the photometric error estimates for stars in the SZ AQL field at all observed epochs as well as the final ensemble uncertainty. The latter was fit with the analytic function corresponding to background-limited photometry: σ = a0 + a1log(x), in order to provide an empirical estimate of the photometric uncertainty for each Cepheid observation given its measured apparent magnitude. In this fashion, we were able to use empirical data to quantify the internal calibration errors which as can be seen in the figure are in good agreement with the estimated photometric uncertainties for field stars. The final error for each photometric measurement is taken as this (internal) empirical measurement added in quadrature with the average (external) rms of the photometric solutions.
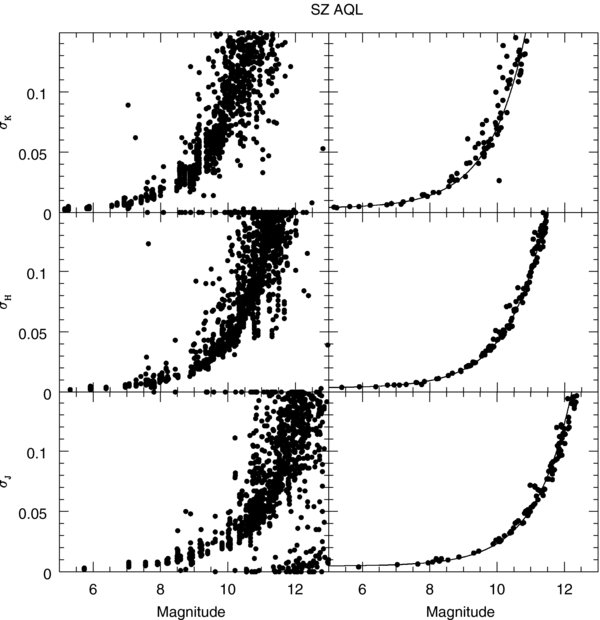
Figure 2. Magnitude errors for stars in the field of SZ AQL. The left panels show the calibrated photometric uncertainties for J, H, and K (bottom to top) for all epochs observed. The right panels show the variance of the stars after ensemble photometry has been performed. The variance has been scaled by the root of the number of observations to match more closely the single epoch data. The solid line is a fit to the ccd equation and is used to predict the random error associated with the Cepheid at each epoch, given its apparent magnitude (see the text).
Download figure:
Standard image High-resolution image4.3. Cepheid Light Curves
The light curves for each Cepheid were constructed using the period and epoch of maximum light found in the General Catalog of Variable Stars (GCVS; Samus et al. 2009). In some instances, like SZ AQL, a new period was determined using current and WLB data which provide a long enough baseline to constrain the period. The light curves were interpolated at 50 evenly spaced points using the Gaussian Local Estimation (GLOESS) program provided by B. Madore & C. Burns (2008, private communication). The program interpolates between the data points by fitting a second-order polynomial to the data Gaussian weighted by distance from the fit point. The intensity-weighted mean magnitudes were then calculated from the interpolated light curve. Since the light curves are well sampled, the overall shapes are well constrained and the resulting average should be relatively unaffected by the sampling details. To estimate the random error in the GLOESS interpolation and averaging algorithm, a Monte Carlo analysis was performed.
A simulated light curve was constructed as a sine function with a peak-to-peak amplitude of 0.3 mag. Random phases were selected at uniform probability and the sine function sampled. A random, Gaussian distributed, magnitude error was added to each sampled point according to the ccd equation resulting in a simulated light curve with sampling similar to our survey. The light curve was then input into the GLOESS program and the intensity-weighted average magnitude produced. One hundred simulations run at each magnitude/epoch combination and the results compared with the input sine function. The rms is shown in Figure 3, plotted against the photometric uncertainty of the simulated data. The data are plotted for samples of multiple fit points and were fit by the equation: rms = aσn−1 + bσ + cn−2, where σ is the photometric uncertainty of the data, n is the number of points used in the fit, and a, b, and c are the coefficients with the values 2.166 ± 0.022, 0.090 ± 0.001, and 0.145 ± 0.005, respectively. For the typical sampling in our survey, the averaging error should be less than 0.005 mag. Although the J-band light curves are not well fit by a simple sine function, we believe this will have a negligible effect given that predicted averaging errors are so small and given that our light curves are relatively well sampled. In any event, the model should be fine for the H- and K-band data. The estimated averaging errors were scaled by the amplitude of each light curve.
Figure 3. GLOESS interpolation and averaging error estimates as a function of photometric uncertainty. From top to bottom the groups of data represent the sample size used to compute the mean: 8, 12, 16, 20, 24, 28, and 32 fit points. The solid lines are the fit to the equation in the text and the filled pentagon is the average parameter space filled by this survey. The expected error from fitting and averaging is well less than 0.005 mag.
Download figure:
Standard image High-resolution image5. FINAL RESULTS
5.1. Comparison with Previous Surveys
The field star photometry was compared to the 2MASS catalog to derive the photometric transformation equations between these two systems; see Figure 4. There is a slight difference from the classic CIT to 2MASS equations found in Carpenter (2001).4 In the classic CIT equations, there were however only four Elias Standard stars available with colors redder than (J − K) ∼ 1.2 and (J − H) ∼ 0.9 that could be used to derive those relations. Two of them are in the Southern Hemisphere (in the Coal Sack) and were inaccessible for this survey and the other two are carbon stars with very few observations (Elias et al. 1983, and references therein). As can be seen in Figure 4, the current sample extends farther to the red and may offer a alternative solution for highly reddened sources.
Figure 4. Transformations and residuals between the current and 2MASS photometric systems. The classic CIT to 2MASS transformation is shown as a dashed line and the current fit is shown as a solid line. The departure from the classic fit in the (J − H) data is discussed in the text.
Download figure:
Standard image High-resolution imageThe photometric residuals versus color in this study versus the 2MASS catalogs show a dispersion of ≲5%. Our transformations between the CIT system and the 2MASS system are given in Table 1. All photometry presented in this work is reported on the current internal system, which although calibrated to be on the CIT system may be slightly variant (⩽2%) at colors redder than (J − H) ∼ 1 due to a systematic color response from using Elias standards bluer than (J − H) ∼ 1. With the exception of a few phase points for some long-period Cepheids none of the observed Cepheid colors exceeded a (J − H) ∼ 1.
Table 1. Transformation Equations between the 2MASS Photometric System and the CIT and the BIRCAM System
| CITa | BIRCAM | |||
|---|---|---|---|---|
| Equation | m | b | m | b |
| Ks2MASS = K + m(J − K) + b | 0.001 ± 0.005 | −0.019 ± 0.004 | 0.008 ± 0.002 | −0.042 ± 0.003 |
| (J − H)2MASS = m(J − H) + b | 1.087 ± 0.013 | −0.047 ± 0.007 | 1.050 ± 0.002 | −0.038 ± 0.001 |
| (J − Ks)2MASS = m(J − K) + b | 1.068 ± 0.009 | −0.020 ± 0.007 | 1.052 ± 0.002 | −0.002 ± 0.001 |
| (H − Ks)2MASS = m(H − K) + b | 1.000 ± 0.023 | 0.034 ± 0.006 | 0.993 ± 0.008 | 0.050 ± 0.001 |
Notes. aCarpenter (2001), updated values obtained from: http://www.astro.caltech.edu/~jmc/2mass/v3/transformations/.
Download table as: ASCIITypeset image
When previous data from WLB exist for a Cepheid, the residual intensity-weighted mean magnitude compared to the current value was found. In the case of the Barnes et al. (1997) data, mean magnitudes were not available from the original source so the GLOESS algorithm was used to determine the means from the original data. In the case of the Laney & Stobie (1992) data which are on the SAAO system, the data were converted to the CIT system using the transformations from Carter (1990). The residuals between the multiple survey data are shown in Figure 5 and show that there is close agreement between the four surveys within ∼1%. The scatter between these surveys is 0.018, 0.014, and 0.014 at J, H, and K, respectively which if regarded as the sum of calibration errors between the surveys is in good agreement with the calibration errors noted in Section 4.1. The scatter between this and the WLB studies is then a good external measure of the total error in the mean magnitudes and confirms the error estimates used in our sample. The J, H, and K light curves are presented in Figure 6 along with (J − H) and (H − K) color curves. The plots are ordered in increasing period and are on the same scale to emphasize relative changes in shape.
Figure 5. Residuals of WLB data compared to the current data for Cepheids in common. The average offsets are shown with the rms scatter. There may be a small systematic offset on the order of 1% in photometry (0.5% in distance), no correction is applied however. If half the rms scatter is attributed to each survey's photometric calibration, then it roughly confirms the photometric calibration errors discussed in Section 4.1.
Download figure:
Standard image High-resolution image
Download figure:
Standard image High-resolution image
Download figure:
Standard image High-resolution image
Download figure:
Standard image High-resolution image
Download figure:
Standard image High-resolution image
Download figure:
Standard image High-resolution image
Download figure:
Standard image High-resolution image
Download figure:
Standard image High-resolution image
Download figure:
Standard image High-resolution image
Download figure:
Standard image High-resolution image
Download figure:
Standard image High-resolution image
Download figure:
Standard image High-resolution image
Download figure:
Standard image High-resolution image
Download figure:
Standard image High-resolution image
Download figure:
Standard image High-resolution image
Figure 6. Near-infrared light curves for 133 Galactic Cepheids. The plot are ordered in increasing period and are plotted with the same scale to emphasize relative changes in shape. In each panel the solid line is the resampled light curve estimated via the GLOESS program (see the text).
Download figure:
Standard image High-resolution image
The light curves are similar to the results found in other surveys in the NIR for Cepheids (Welch et al. 1984; Laney & Stobie 1992; Barnes et al. 1997; Persson et al. 2004). In particular, the H − K color curve is nearly constant through the cycle indicating insensitivity to temperature variations. This feature may provide a method to estimate line-of-sight extinction to each Cepheid. This is a topic of greater discussion in our second paper.
5.2. Photometric Data Summary
The field star photometry is provided in Table 2 which contains 1481 well-observed field stars, 131 Cepheids, and 92 other variables; 82 of which are likely new discoveries. The data include: field identification number, right ascension, and declination (J2000) as adopted from the 2MASS catalog (Cutri et al. 2003), the average J, H, and K magnitudes with internal uncertainty estimates, and the number of observations. Finding charts are provided in Figure 1; the full table and set of charts are available online.5 The photometric observations for SZ AQL are given in Table 3; the entire sample is available online as previously noted. The data consist of the name, heliocentric julian date (HJD) of the midpoints of the observing sequence, and corresponding phase relative to maximum light provided in the GCVS. The data provided are the J, H, and K magnitudes on the current system with uncertainties determined from the calibration error and from field star stability; see Section 4. A data flag is also provided indicating that none or some of the data points were rejected when interpolating the light curve. The flag ranges from (0–7) which indicates the data point(s) omitted: 0 = None, 1 = J, 2 = H, 3 = J & H, 4 = K, 5 = J & K, 6 = H & K, and 7 = J, H & K.
Table 2. Photometric Data for Stars in the SZ AQL Field
| ID | R.A. (J2000) | Decl. (J2000) | 〈J〉 ± σJa | 〈H〉 ± σHa | 〈K〉 ± σKa | nobs | (JHK)2MASSb | Note |
|---|---|---|---|---|---|---|---|---|
| 1 SZ AQL | 19:04:39.43 | +01:18:22.0 | 5.839 ± 0.018 | 5.325 ± 0.016 | 5.158 ± 0.015 | 24 24 24 | 5.735 5.333 5.139 | Ceph SZ AQL |
| 2 SZ AQL | 19:04:39.56 | +01:22:18.0 | 6.999 ± 0.096 | 5.874 ± 0.101 | 5.075 ± 0.088 | 24 24 24 | 7.140 5.935 5.246 | Var V1561 AQL |
| 3 SZ AQL | 19:04:50.99 | +01:20:27.2 | 7.610 ± 0.003 | 6.362 ± 0.005 | 5.814 ± 0.013 | 24 24 24 | 7.635 6.400 5.795 | |
| 4 SZ AQL | 19:04:55.82 | +01:21:29.6 | 8.311 ± 0.107 | 6.707 ± 0.091 | 5.539 ± 0.069 | 24 24 24 | 8.649 6.970 5.863 | Var V1569 AQL |
| 5 SZ AQL | 19:04:48.21 | +01:15:17.1 | 8.254 ± 0.009 | 7.061 ± 0.007 | 6.642 ± 0.010 | 24 24 24 | 8.261 7.085 6.533 | |
| 6 SZ AQL | 19:04:49.64 | +01:18:11.2 | 8.506 ± 0.013 | 7.262 ± 0.003 | 6.778 ± 0.004 | 24 24 24 | 8.575 7.289 6.691 | |
| 7 SZ AQL | 19:05:01.08 | +01:13:54.9 | 8.243 ± 0.006 | 7.554 ± 0.005 | 7.382 ± 0.014 | 22 22 22 | 8.237 7.578 7.404 | |
| 8 SZ AQL | 19:04:28.73 | +01:19:43.3 | 8.831 ± 0.007 | 7.573 ± 0.006 | 7.127 ± 0.013 | 24 24 24 | 8.941 7.645 7.110 | |
| 9 SZ AQL | 19:05:04.61 | +01:16:03.5 | 8.049 ± 0.075 | 6.905 ± 0.075 | 6.148 ± 0.087 | 18 18 18 | 9.002 7.829 7.019 | Var V1570 AQL |
| 10 SZ AQL | 19:04:31.87 | +01:20:15.5 | 8.155 ± 0.095 | 7.721 ± 0.092 | 7.065 ± 0.089 | 24 24 24 | 9.041 7.739 7.045 | Unclassified variable |
| 11 SZ AQL | 19:04:46.60 | +01:21:27.8 | 7.916 ± 0.004 | 7.802 ± 0.004 | 7.696 ± 0.010 | 24 24 24 | 7.877 7.797 7.744 | HD 177462 |
| 15 SZ AQL | 19:04:48.38 | +01:19:46.6 | 9.419 ± 0.010 | 8.221 ± 0.003 | 7.750 ± 0.009 | 24 24 24 | 9.472 8.223 7.721 | |
| 18 SZ AQL | 19:04:35.93 | +01:20:25.2 | 9.846 ± 0.009 | 8.511 ± 0.009 | 8.020 ± 0.008 | 24 24 24 | 9.911 8.530 7.979 | |
| 20 SZ AQL | 19:05:00.46 | +01:17:10.6 | 10.023 ± 0.016 | 8.879 ± 0.005 | 8.506 ± 0.011 | 24 24 24 | 10.131 8.989 8.554 |
Notes. Right ascension and declination are adopted from the 2MASS point source catalog; see the text. The data for all fields are available online; see the text.
aJ, H, and K photometric uncertainty determined from the data ( ).
bCutri et al. (2003).
).
bCutri et al. (2003).
Only a portion of this table is shown here to demonstrate its form and content. A machine-readable version of the full table is available.
Download table as: DataTypeset image
Table 3. Photometric Observations of SZ AQL
| ID | HJDa | Phaseb | J ± σJc | H ± σHc | K ± σKc | Flagd |
|---|---|---|---|---|---|---|
| SZ AQL | 2454574.919 | 0.31 | 5.676 ± 0.013 | 5.185 ± 0.012 | 5.006 ± 0.016 | 0 |
| SZ AQL | 2454577.912 | 0.48 | 5.739 ± 0.013 | 5.209 ± 0.012 | 4.980 ± 0.016 | 0 |
| SZ AQL | 2454579.969 | 0.60 | 5.836 ± 0.013 | 5.253 ± 0.012 | 5.090 ± 0.016 | 0 |
| SZ AQL | 2454584.920 | 0.89 | 6.072 ± 0.013 | 5.523 ± 0.012 | 5.355 ± 0.016 | 0 |
| SZ AQL | 2454585.919 | 0.95 | 6.058 ± 0.013 | 5.568 ± 0.012 | 5.361 ± 0.016 | 0 |
| SZ AQL | 2454586.886 | 0.00 | 6.070 ± 0.013 | 5.565 ± 0.012 | 5.362 ± 0.016 | 0 |
| SZ AQL | 2454611.902 | 0.46 | 5.735 ± 0.013 | 5.180 ± 0.012 | 4.971 ± 0.016 | 0 |
| SZ AQL | 2454627.869 | 0.40 | 5.670 ± 0.013 | 5.153 ± 0.012 | 4.994 ± 0.016 | 0 |
| SZ AQL | 2454629.798 | 0.51 | 5.746 ± 0.013 | 5.185 ± 0.012 | 5.018 ± 0.016 | 0 |
| SZ AQL | 2454639.727 | 0.09 | 5.741 ± 0.013 | 5.363 ± 0.012 | 5.231 ± 0.016 | 0 |
| SZ AQL | 2454641.850 | 0.21 | 5.750 ± 0.013 | 5.295 ± 0.012 | 5.156 ± 0.016 | 0 |
| SZ AQL | 2454641.900 | 0.21 | 5.754 ± 0.013 | 5.300 ± 0.012 | 5.192 ± 0.016 | 0 |
| SZ AQL | 2454643.964 | 0.33 | 5.718 ± 0.013 | 5.195 ± 0.012 | 5.074 ± 0.016 | 0 |
| SZ AQL | 2454667.738 | 0.72 | 5.970 ± 0.013 | 5.352 ± 0.012 | 5.230 ± 0.016 | 0 |
| SZ AQL | 2454726.659 | 0.16 | 5.717 ± 0.013 | 5.319 ± 0.012 | 5.154 ± 0.016 | 0 |
| SZ AQL | 2454734.664 | 0.63 | 5.856 ± 0.013 | 5.266 ± 0.012 | 5.117 ± 0.016 | 0 |
| SZ AQL | 2454735.654 | 0.68 | 5.898 ± 0.013 | 5.311 ± 0.012 | 5.156 ± 0.016 | 0 |
| SZ AQL | 2454737.619 | 0.80 | 6.033 ± 0.013 | 5.439 ± 0.012 | 5.248 ± 0.016 | 0 |
| SZ AQL | 2454739.590 | 0.91 | 6.038 ± 0.013 | 5.526 ± 0.012 | 5.367 ± 0.016 | 0 |
| SZ AQL | 2454740.614 | 0.97 | 6.060 ± 0.013 | 5.543 ± 0.012 | 5.383 ± 0.016 | 0 |
| SZ AQL | 2454755.576 | 0.85 | 6.056 ± 0.013 | 5.479 ± 0.012 | 5.291 ± 0.016 | 0 |
| SZ AQL | 2454757.608 | 0.96 | 6.049 ± 0.013 | 5.548 ± 0.012 | 5.295 ± 0.016 | 0 |
| SZ AQL | 2454762.556 | 0.25 | 5.687 ± 0.013 | 5.288 ± 0.012 | 5.060 ± 0.016 | 0 |
| SZ AQL | 2454767.577 | 0.55 | 5.787 ± 0.013 | 5.224 ± 0.012 | 5.034 ± 0.016 | 0 |
Notes. aHeliocentric Julian Date at mid-point of observing sequence. bIn most cases the light curve phase was computed from the HJD of the observation and the epoch of maximum light reported in the GCVS. In some cases like SZ AQL a new period was determined by using the multi-epoch data from this and the WLB studies. cJ, H, and K photometric uncertainty estimate includes the photometric calibration error and the rms scatter of the local standard stars in the field (see the text). dPhotometric flags indicate which, if any, observations were rejected from the light curve construction: 0 = None, 1 = J, 2 = H, 3 = J&H, 4 = K, 5 = J&K, 6 = H&K, and 7 = J, H&K.
Only a portion of this table is shown here to demonstrate its form and content. A machine-readable version of the full table is available.
Download table as: DataTypeset image
The photometric means for the 131 Classical Fundamental Mode Cepheids analyzed in this survey are summarized in Table 4 and also available online as previously noted. The table includes the Cepheid name and the R.A. and decl. (J2000) adopted from the 2MASS catalog (Cutri et al. 2003). The table is sorted by increasing period and includes: the intensity-weighted mean J, H, and K magnitudes along with uncertainty estimates which comprise the photometric calibration error and the GLOESS averaging error. The expected random error from the Monte Carlo simulations is small compared to the total final errors adopted here which indicates that the dominate source of error arises from the absolute photometric calibration.
Table 4. Final Summary of Observed Cepheids and their Observed NIR Magnitudes
| ID | R.A. (J2000) | Decl. (J2000) | log P | 〈J〉 | 〈H〉 | 〈K〉 | nobs |
|---|---|---|---|---|---|---|---|
| S VUL | 19:48:23.80 | +27:17:11.4 | 1.8385 | 5.410 ± 0.012 | 4.806 ± 0.011 | 4.586 ± 0.015 | 34 |
| GY SGE | 19:35:13.64 | +19:12:08.6 | 1.7138 | 5.530 ± 0.012 | 4.827 ± 0.011 | 4.546 ± 0.015 | 36 |
| V1467 CYG | 20:04:02.17 | +32:27:02.4 | 1.6866 | 8.150 ± 0.013 | 7.278 ± 0.012 | 6.961 ± 0.016 | 26 |
| SV VUL | 19:51:30.90 | +27:27:36.8 | 1.6553 | 4.552 ± 0.012 | 4.051 ± 0.011 | 3.905 ± 0.016 | 32 |
| V0396 CYG | 20:16:12.67 | +42:06:31.5 | 1.5218 | 6.031 ± 0.012 | 5.037 ± 0.011 | 4.619 ± 0.016 | 27 |
| V0609 CYG | 21:26:56.03 | +54:29:29.2 | 1.4924 | 6.800 ± 0.013 | 6.108 ± 0.012 | 5.817 ± 0.016 | 20 |
| T MON | 06:25:13.00 | +07:05:08.4 | 1.4319 | 4.077 ± 0.014 | 3.610 ± 0.012 | 3.496 ± 0.017 | 17 |
| OT PER | 04:38:37.93 | +47:44:24.9 | 1.4165 | 8.712 ± 0.013 | 7.899 ± 0.012 | 7.598 ± 0.016 | 22 |
| BM PER | 04:29:39.40 | +48:25:19.1 | 1.3608 | 6.656 ± 0.013 | 5.991 ± 0.012 | 5.741 ± 0.016 | 26 |
| WZ SGR | 18:16:59.71 | −19:04:32.9 | 1.3394 | 5.258 ± 0.013 | 4.740 ± 0.012 | 4.573 ± 0.016 | 22 |
| VX CYG | 20:57:20.82 | +40:10:38.9 | 1.3039 | 6.689 ± 0.012 | 6.065 ± 0.011 | 5.875 ± 0.016 | 24 |
| KX CYG | 20:24:19.34 | +40:33:40.0 | 1.3020 | 6.838 ± 0.013 | 5.980 ± 0.011 | 5.621 ± 0.016 | 25 |
| RU SCT | 18:41:56.37 | −04:06:38.3 | 1.2946 | 5.886 ± 0.013 | 5.274 ± 0.012 | 5.069 ± 0.016 | 21 |
| YZ AUR | 05:15:21.98 | +40:04:41.0 | 1.2599 | 7.484 ± 0.013 | 6.892 ± 0.011 | 6.705 ± 0.016 | 24 |
| CP CEP | 21:57:52.70 | +56:09:49.9 | 1.2519 | 7.330 ± 0.012 | 6.711 ± 0.011 | 6.511 ± 0.016 | 22 |
| AA SER | 18:41:21.75 | −01:06:40.3 | 1.2340 | 7.544 ± 0.012 | 6.758 ± 0.011 | 6.491 ± 0.015 | 21 |
| SZ AQL | 19:04:39.43 | +01:18:22.0 | 1.2340 | 5.839 ± 0.012 | 5.325 ± 0.011 | 5.158 ± 0.016 | 24 |
| CD CYG | 20:04:26.55 | +34:06:44.0 | 1.2323 | 6.351 ± 0.012 | 5.830 ± 0.011 | 5.684 ± 0.016 | 27 |
| RW CAM | 03:54:21.79 | +58:39:12.0 | 1.2152 | 5.819 ± 0.012 | 5.276 ± 0.011 | 5.113 ± 0.016 | 21 |
| ER AUR | 05:13:09.96 | +41:59:25.8 | 1.1956 | 9.069 ± 0.012 | 8.589 ± 0.011 | 8.447 ± 0.015 | 20 |
| SV MON | 06:21:26.31 | +06:28:12.5 | 1.1828 | 6.260 ± 0.013 | 5.817 ± 0.011 | 5.704 ± 0.016 | 24 |
| SZ CYG | 20:32:54.28 | +46:36:04.5 | 1.1793 | 6.515 ± 0.012 | 5.944 ± 0.011 | 5.745 ± 0.015 | 33 |
| CH CAS | 23:22:28.41 | +62:45:25.7 | 1.1786 | 7.321 ± 0.013 | 6.673 ± 0.011 | 6.420 ± 0.015 | 21 |
| RW CAS | 01:37:14.01 | +57:45:33.0 | 1.1701 | 6.836 ± 0.013 | 6.354 ± 0.011 | 6.212 ± 0.016 | 21 |
| UZ SCT | 18:31:22.36 | −12:55:43.4 | 1.1686 | 7.395 ± 0.012 | 6.735 ± 0.011 | 6.496 ± 0.015 | 21 |
| TX CYG | 21:00:06.36 | +42:35:51.2 | 1.1676 | 5.312 ± 0.013 | 4.616 ± 0.011 | 4.341 ± 0.015 | 22 |
| CY CAS | 23:29:12.74 | +63:22:27.5 | 1.1577 | 7.850 ± 0.013 | 7.160 ± 0.012 | 6.938 ± 0.016 | 22 |
| CY AUR | 04:57:40.07 | +46:05:33.1 | 1.1414 | 8.580 ± 0.013 | 7.945 ± 0.012 | 7.744 ± 0.016 | 21 |
| TT AQL | 19:08:13.73 | +01:17:55.1 | 1.1384 | 4.642 ± 0.013 | 4.162 ± 0.012 | 4.035 ± 0.016 | 26 |
| V0916 AQL | 19:10:00.42 | +12:32:11.7 | 1.1284 | 7.362 ± 0.012 | 6.751 ± 0.011 | 6.551 ± 0.015 | 25 |
| V1364 CYG | 20:07:29.43 | +35:20:46.9 | 1.1132 | 9.088 ± 0.013 | 8.337 ± 0.011 | 8.089 ± 0.016 | 19 |
| GX SGE | 19:31:10.48 | +19:15:25.5 | 1.1106 | 8.261 ± 0.012 | 7.561 ± 0.011 | 7.310 ± 0.015 | 27 |
| Z SCT | 18:42:57.27 | −05:49:15.3 | 1.1106 | 6.954 ± 0.013 | 6.465 ± 0.011 | 6.300 ± 0.015 | 19 |
| GQ VUL | 19:47:58.00 | +26:00:00.1 | 1.1019 | 8.669 ± 0.013 | 7.919 ± 0.011 | 7.643 ± 0.015 | 22 |
| AS VUL | 19:47:44.47 | +27:55:05.6 | 1.0872 | 8.374 ± 0.012 | 7.715 ± 0.011 | 7.489 ± 0.015 | 32 |
| RY CAS | 23:52:07.03 | +58:44:30.2 | 1.0841 | 7.063 ± 0.012 | 6.537 ± 0.011 | 6.347 ± 0.015 | 24 |
| EZ CYG | 19:57:49.02 | +30:15:57.1 | 1.0667 | 8.192 ± 0.013 | 7.655 ± 0.011 | 7.496 ± 0.015 | 20 |
| RX AUR | 05:01:23.18 | +39:57:37.5 | 1.0653 | 5.741 ± 0.012 | 5.346 ± 0.011 | 5.250 ± 0.015 | 22 |
| AA GEM | 06:06:34.94 | +26:19:45.1 | 1.0532 | 7.646 ± 0.012 | 7.189 ± 0.011 | 7.086 ± 0.016 | 23 |
| HZ PER | 04:25:37.29 | +45:37:12.9 | 1.0523 | 9.127 ± 0.013 | 8.324 ± 0.012 | 8.035 ± 0.016 | 22 |
| V0438 CYG | 20:18:54.30 | +40:03:52.3 | 1.0496 | 6.764 ± 0.012 | 6.060 ± 0.011 | 5.757 ± 0.015 | 27 |
| SV PER | 04:49:47.94 | +42:17:22.9 | 1.0465 | 6.798 ± 0.012 | 6.342 ± 0.011 | 6.214 ± 0.016 | 20 |
| TY SCT | 18:42:07.91 | −04:17:36.5 | 1.0435 | 7.226 ± 0.013 | 6.620 ± 0.011 | 6.400 ± 0.015 | 22 |
| VX PER | 02:07:48.48 | +58:26:36.8 | 1.0370 | 6.886 ± 0.012 | 6.427 ± 0.011 | 6.277 ± 0.015 | 21 |
| Z LAC | 22:40:52.12 | +56:49:46.0 | 1.0369 | 6.221 ± 0.013 | 5.792 ± 0.011 | 5.668 ± 0.016 | 19 |
| Y SCT | 18:38:03.30 | −08:22:08.0 | 1.0146 | 6.456 ± 0.012 | 5.881 ± 0.011 | 5.663 ± 0.015 | 22 |
| AN AUR | 04:59:41.53 | +40:50:09.6 | 1.0124 | 7.932 ± 0.013 | 7.434 ± 0.011 | 7.274 ± 0.016 | 20 |
| SY AUR | 05:12:39.22 | +42:49:54.5 | 1.0062 | 6.925 ± 0.012 | 6.514 ± 0.011 | 6.386 ± 0.015 | 20 |
| BZ CYG | 20:45:59.79 | +45:18:25.0 | 1.0061 | 6.751 ± 0.012 | 6.134 ± 0.011 | 5.899 ± 0.015 | 29 |
| CN SCT | 18:42:30.48 | −04:19:50.4 | 0.9997 | 7.821 ± 0.012 | 7.055 ± 0.011 | 6.730 ± 0.015 | 23 |
| DD CAS | 23:57:34.95 | +62:43:05.7 | 0.9918 | 7.533 ± 0.012 | 7.055 ± 0.011 | 6.924 ± 0.015 | 26 |
| YZ SGR | 18:49:28.60 | −16:43:22.9 | 0.9802 | 5.378 ± 0.012 | 4.989 ± 0.011 | 4.878 ± 0.015 | 24 |
| CN CEP | 23:25:34.79 | +64:47:25.4 | 0.9778 | 8.316 ± 0.012 | 7.627 ± 0.011 | 7.367 ± 0.015 | 21 |
| FN AQL | 19:12:47.31 | +03:33:26.4 | 0.9769 | 5.947 ± 0.012 | 5.473 ± 0.011 | 5.328 ± 0.015 | 19 |
| TX MON | 06:50:52.27 | −01:25:45.3 | 0.9396 | 8.576 ± 0.012 | 8.102 ± 0.011 | 7.959 ± 0.015 | 22 |
| AC MON | 07:00:59.81 | −08:42:32.3 | 0.9039 | 7.579 ± 0.012 | 7.054 ± 0.011 | 6.885 ± 0.015 | 22 |
| BK AUR | 05:10:40.19 | +49:41:15.3 | 0.9032 | 7.302 ± 0.013 | 6.873 ± 0.011 | 6.749 ± 0.015 | 19 |
| DL CAS | 00:29:58.58 | +60:12:43.1 | 0.9031 | 6.556 ± 0.012 | 6.089 ± 0.011 | 5.929 ± 0.015 | 21 |
| U VUL | 19:36:37.73 | +20:19:58.6 | 0.9026 | 4.515 ± 0.012 | 4.074 ± 0.011 | 3.928 ± 0.015 | 19 |
| W GEM | 06:34:57.44 | +15:19:49.6 | 0.8984 | 5.133 ± 0.013 | 4.757 ± 0.012 | 4.671 ± 0.016 | 17 |
| RX CAM | 04:04:58.44 | +58:39:35.4 | 0.8983 | 5.169 ± 0.013 | 4.714 ± 0.011 | 4.577 ± 0.015 | 19 |
| VY CYG | 21:04:16.63 | +39:58:20.1 | 0.8953 | 7.005 ± 0.012 | 6.536 ± 0.011 | 6.374 ± 0.015 | 26 |
| GH CYG | 19:59:10.79 | +29:27:02.7 | 0.8931 | 7.256 ± 0.012 | 6.787 ± 0.011 | 6.614 ± 0.015 | 18 |
| CD CAS | 23:45:02.59 | +63:00:13.9 | 0.8921 | 7.631 ± 0.012 | 7.077 ± 0.011 | 6.896 ± 0.015 | 25 |
| RS ORI | 06:22:13.18 | +14:40:41.2 | 0.8789 | 6.411 ± 0.012 | 6.009 ± 0.011 | 5.898 ± 0.015 | 24 |
| V1344 AQL | 19:11:59.16 | +04:21:17.6 | 0.8738 | 5.184 ± 0.012 | 4.720 ± 0.011 | 4.573 ± 0.015 | 20 |
| TZ MON | 06:58:00.93 | −00:22:33.4 | 0.8709 | 8.454 ± 0.012 | 7.993 ± 0.011 | 7.832 ± 0.015 | 19 |
| CK SCT | 18:41:00.66 | −06:05:49.9 | 0.8701 | 7.380 ± 0.012 | 6.806 ± 0.011 | 6.627 ± 0.015 | 19 |
| V0336 AQL | 19:01:19.73 | +00:08:49.2 | 0.8635 | 7.155 ± 0.012 | 6.676 ± 0.011 | 6.521 ± 0.015 | 17 |
| V0459 CYG | 21:10:54.36 | +49:08:31.4 | 0.8604 | 7.601 ± 0.012 | 7.058 ± 0.011 | 6.883 ± 0.015 | 19 |
| V0600 AQL | 19:20:56.08 | +08:33:22.1 | 0.8596 | 6.961 ± 0.012 | 6.435 ± 0.011 | 6.242 ± 0.015 | 22 |
| AK CEP | 22:28:50.06 | +58:12:39.3 | 0.8593 | 8.404 ± 0.012 | 7.884 ± 0.011 | 7.740 ± 0.015 | 21 |
| TW CMA | 07:22:02.37 | −14:19:05.5 | 0.8448 | 7.579 ± 0.012 | 7.167 ± 0.011 | 7.046 ± 0.015 | 26 |
| AO AUR | 05:47:45.05 | +32:00:52.7 | 0.8301 | 8.640 ± 0.013 | 8.188 ± 0.011 | 8.064 ± 0.015 | 21 |
| U SGR | 18:31:53.32 | −19:07:30.1 | 0.8290 | 4.516 ± 0.013 | 4.088 ± 0.011 | 3.949 ± 0.016 | 24 |
| V0495 CYG | 20:15:58.32 | +35:00:52.9 | 0.8276 | 7.105 ± 0.012 | 6.526 ± 0.011 | 6.287 ± 0.015 | 23 |
| AY SGR | 18:23:19.15 | −18:34:29.2 | 0.8175 | 7.122 ± 0.012 | 6.518 ± 0.011 | 6.299 ± 0.015 | 25 |
| AW PER | 04:47:46.32 | +36:43:22.1 | 0.8105 | 5.225 ± 0.012 | 4.821 ± 0.011 | 4.695 ± 0.015 | 24 |
| RR LAC | 22:41:26.53 | +56:25:58.1 | 0.8073 | 6.982 ± 0.012 | 6.609 ± 0.011 | 6.506 ± 0.015 | 23 |
| X VUL | 19:57:28.60 | +26:33:23.3 | 0.8007 | 5.915 ± 0.012 | 5.412 ± 0.011 | 5.231 ± 0.015 | 27 |
| RS CAS | 23:37:16.04 | +62:25:44.3 | 0.7991 | 6.767 ± 0.012 | 6.212 ± 0.011 | 6.004 ± 0.015 | 21 |
| CR CEP | 22:46:24.79 | +59:26:31.8 | 0.7947 | 6.641 ± 0.012 | 6.084 ± 0.011 | 5.909 ± 0.015 | 22 |
| VV CAS | 01:51:07.01 | +59:53:17.6 | 0.7929 | 8.325 ± 0.013 | 7.868 ± 0.011 | 7.734 ± 0.015 | 21 |
| V0538 CYG | 21:37:28.12 | +51:45:44.8 | 0.7867 | 7.795 ± 0.012 | 7.294 ± 0.011 | 7.136 ± 0.015 | 23 |
| FM AQL | 19:09:15.98 | +10:33:08.8 | 0.7863 | 5.664 ± 0.012 | 5.198 ± 0.011 | 5.044 ± 0.015 | 23 |
| MW CYG | 20:12:22.83 | +32:52:17.9 | 0.7749 | 6.692 ± 0.012 | 6.194 ± 0.011 | 6.021 ± 0.018 | 23 |
| FM CAS | 00:14:28.23 | +56:15:10.5 | 0.7641 | 7.141 ± 0.012 | 6.736 ± 0.011 | 6.619 ± 0.015 | 23 |
| RZ GEM | 06:02:36.57 | +22:14:02.9 | 0.7427 | 7.607 ± 0.012 | 7.153 ± 0.011 | 6.987 ± 0.015 | 25 |
| X LAC | 22:49:03.17 | +56:25:41.5 | 0.7408 | 6.506 ± 0.012 | 6.128 ± 0.011 | 6.007 ± 0.015 | 21 |
| SW CAS | 23:07:10.07 | +58:33:15.0 | 0.7357 | 7.410 ± 0.012 | 6.971 ± 0.011 | 6.838 ± 0.015 | 22 |
| CV MON | 06:37:04.84 | +03:03:50.2 | 0.7307 | 7.313 ± 0.012 | 6.768 ± 0.011 | 6.565 ± 0.015 | 22 |
| V1162 AQL | 19:52:20.99 | −11:22:00.6 | 0.7305 | 6.150 ± 0.012 | 5.802 ± 0.011 | 5.701 ± 0.015 | 21 |
| BG LAC | 22:00:25.15 | +43:26:43.3 | 0.7269 | 7.022 ± 0.012 | 6.638 ± 0.011 | 6.511 ± 0.015 | 22 |
| CR SER | 18:10:02.13 | −13:32:45.4 | 0.7244 | 7.335 ± 0.012 | 6.746 ± 0.011 | 6.520 ± 0.015 | 20 |
| V0386 CYG | 21:14:40.42 | +41:42:58.7 | 0.7208 | 6.359 ± 0.012 | 5.793 ± 0.011 | 5.560 ± 0.015 | 18 |
| BR VUL | 19:46:35.18 | +22:53:23.2 | 0.7158 | 7.713 ± 0.012 | 7.209 ± 0.011 | 7.042 ± 0.015 | 28 |
| V0514 CYG | 20:46:12.53 | +45:28:43.1 | 0.7075 | 7.637 ± 0.012 | 6.998 ± 0.011 | 6.737 ± 0.015 | 24 |
| V LAC | 22:48:37.98 | +56:19:17.4 | 0.6975 | 7.049 ± 0.013 | 6.656 ± 0.011 | 6.569 ± 0.015 | 21 |
| AS PER | 04:19:46.84 | +48:57:11.7 | 0.6966 | 6.934 ± 0.013 | 6.465 ± 0.011 | 6.295 ± 0.015 | 18 |
| CF CAS | 23:58:17.96 | +61:13:15.8 | 0.6880 | 8.595 ± 0.012 | 8.114 ± 0.011 | 7.937 ± 0.015 | 34 |
| VZ CYG | 21:51:41.43 | +43:08:02.6 | 0.6870 | 7.202 ± 0.013 | 6.841 ± 0.011 | 6.737 ± 0.015 | 20 |
| RY CMA | 07:16:37.64 | −11:29:14.3 | 0.6701 | 6.379 ± 0.012 | 6.031 ± 0.011 | 5.912 ± 0.015 | 28 |
| TV CMA | 07:09:15.41 | −13:47:09.9 | 0.6693 | 8.028 ± 0.012 | 7.570 ± 0.011 | 7.401 ± 0.015 | 26 |
| WW MON | 06:33:37.18 | +09:12:12.7 | 0.6686 | 9.971 ± 0.014 | 9.495 ± 0.012 | 9.370 ± 0.016 | 17 |
| XY CAS | 00:49:53.26 | +60:07:38.4 | 0.6534 | 7.746 ± 0.012 | 7.325 ± 0.011 | 7.194 ± 0.015 | 19 |
| V0402 CYG | 20:09:07.76 | +37:09:07.1 | 0.6400 | 7.811 ± 0.012 | 7.400 ± 0.011 | 7.285 ± 0.015 | 23 |
| Y LAC | 22:09:02.92 | +51:02:45.0 | 0.6359 | 7.631 ± 0.012 | 7.299 ± 0.011 | 7.219 ± 0.015 | 21 |
| SX PER | 04:17:06.06 | +41:43:54.5 | 0.6325 | 8.767 ± 0.013 | 8.335 ± 0.011 | 8.205 ± 0.015 | 24 |
| EP CYG | 19:45:03.68 | +31:19:50.9 | 0.6323 | 10.120 ± 0.013 | 9.675 ± 0.012 | 9.520 ± 0.016 | 18 |
| RZ CMA | 07:21:21.58 | −16:39:35.8 | 0.6289 | 7.545 ± 0.012 | 7.167 ± 0.011 | 7.005 ± 0.015 | 25 |
| X SCT | 18:31:19.75 | −13:06:29.4 | 0.6230 | 7.387 ± 0.013 | 6.940 ± 0.011 | 6.805 ± 0.015 | 19 |
| V0508 MON | 06:47:09.40 | +03:58:01.3 | 0.6163 | 8.643 ± 0.012 | 8.266 ± 0.011 | 8.174 ± 0.015 | 18 |
| MM PER | 03:45:23.34 | +48:05:00.6 | 0.6147 | 8.666 ± 0.012 | 8.249 ± 0.011 | 8.124 ± 0.015 | 23 |
| V0495 MON | 06:37:03.38 | −02:49:26.6 | 0.6124 | 9.834 ± 0.012 | 9.339 ± 0.011 | 9.222 ± 0.015 | 24 |
| SY CAS | 00:15:09.81 | +58:25:27.3 | 0.6097 | 7.830 ± 0.012 | 7.438 ± 0.011 | 7.325 ± 0.015 | 27 |
| ST TAU | 05:45:03.16 | +13:34:34.9 | 0.6058 | 6.283 ± 0.013 | 5.893 ± 0.011 | 5.784 ± 0.016 | 18 |
| TY MON | 06:56:39.79 | +00:11:24.1 | 0.6045 | 9.310 ± 0.012 | 8.853 ± 0.011 | 8.705 ± 0.015 | 18 |
| AA MON | 06:57:23.77 | −03:50:35.9 | 0.5953 | 9.729 ± 0.013 | 9.186 ± 0.012 | 8.989 ± 0.015 | 22 |
| CS ORI | 06:07:25.46 | +11:09:07.1 | 0.5899 | 9.344 ± 0.013 | 8.943 ± 0.011 | 8.828 ± 0.016 | 25 |
| Y AUR | 05:28:39.23 | +42:26:15.8 | 0.5865 | 7.664 ± 0.012 | 7.276 ± 0.011 | 7.151 ± 0.015 | 29 |
| SU CYG | 19:44:48.73 | +29:15:52.8 | 0.5850 | 5.652 ± 0.012 | 5.380 ± 0.011 | 5.307 ± 0.015 | 32 |
| AD GEM | 06:43:07.51 | +20:56:20.9 | 0.5784 | 8.468 ± 0.012 | 8.140 ± 0.011 | 8.066 ± 0.015 | 24 |
| RT AUR | 06:28:34.06 | +30:29:35.1 | 0.5713 | 4.246 ± 0.012 | 3.977 ± 0.011 | 3.920 ± 0.015 | 23 |
| SS SCT | 18:43:43.50 | −07:43:52.0 | 0.5648 | 6.299 ± 0.012 | 5.918 ± 0.011 | 5.818 ± 0.015 | 22 |
| AV TAU | 05:45:44.91 | +27:04:04.5 | 0.5582 | 9.195 ± 0.013 | 8.635 ± 0.011 | 8.441 ± 0.015 | 22 |
| V0335 AUR | 05:42:29.25 | +37:38:46.9 | 0.5332 | 9.869 ± 0.013 | 9.386 ± 0.012 | 9.232 ± 0.016 | 22 |
| AX AUR | 05:46:50.81 | +31:35:52.4 | 0.4838 | 9.936 ± 0.012 | 9.479 ± 0.011 | 9.320 ± 0.015 | 18 |
| BV MON | 06:56:51.09 | +04:30:58.3 | 0.4792 | 9.016 ± 0.013 | 8.572 ± 0.011 | 8.458 ± 0.016 | 17 |
| V0465 MON | 07:08:09.31 | −00:03:56.5 | 0.4335 | 8.770 ± 0.012 | 8.429 ± 0.011 | 8.354 ± 0.015 | 22 |
| BE MON | 06:40:05.59 | +07:36:21.0 | 0.4322 | 8.267 ± 0.012 | 7.842 ± 0.011 | 7.714 ± 0.016 | 19 |
Notes. Right ascension and declination are adopted from the 2MASS point source catalog, see the text. The quoted errors include the photometric calibration uncertainty and the estimated GLOESS averaging error.
5.3. Serendipitous Variables
Although the field of view of BIRCAM was only 13 arcmin, there were a number of variables within the fields that were simultaneously observed with the Cepheids. Some were previously classified variables in the GCVS but most are new and unclassified (i.e., not in SIMBAD database6). The periods of most of these variables are longer than the duration of the BIRCAM survey and as a result the periods are unconstrained. We suspect that the majority are long-period variables. Subjective estimates of the periods were made by constructing rough light curves and likely represent lower limits. A total of 82 variables were found that were unclassified and are serendipitous discoveries. For previously identified variables, periods were taken from the literature. In the case of QX Cas (16 CF Cas in this survey), no variability was detected which may confirm recent findings (Bonaro et al. 2009) that it is no longer eclipsing. The data for these variables are available online and are summarized in Tables 5 and 6.
Table 5. Summary of Serendipitous Variables
| BIRCAM Field ID | Other ID | R.A. (J2000) | Decl. (J2000) | Period (days) | Period Ref. |
|---|---|---|---|---|---|
| 2 SZ AQL | V1561 AQL | 19:04:39.56 | +01:22:18.0 | 290.0 | 1 |
| 4 SZ AQL | V1569 AQL | 19:04:55.82 | +01:21:29.6 | 413.0 | 1 |
| 9 SZ AQL | V1570 AQL | 19:05:04.61 | +01:16:03.5 | 260.3 | 1 |
| 10 SZ AQL | ... | 19:04:31.87 | +01:20:15.5 | ⩾350 | |
| 5 FM AQL | ... | 19:09:31.36 | +10:35:07.7 | ⩾400 | |
| 15 FM AQL | ... | 19:09:03.41 | +10:32:29.3 | ∼223 | |
| 22 FM AQL | ... | 19:09:34.51 | +10:30:21.7 | ⩾300 | |
| 22 V0336 AQL | ... | 19:01:20.65 | +00:04:33.3 | ⩾320 | |
| 7 V0600 AQL | ... | 19:21:09.68 | +08:32:02.4 | ⩾250 | |
| 10 V0600 AQL | ... | 19:20:56.08 | +08:33:22.1 | ⩾400 | |
| 17 V0600 AQL | ... | 19:21:00.21 | +08:30:34.9 | ⩾220 | |
| 5 V0916 AQL | ... | 19:10:19.34 | +12:34:01.3 | ⩾450 | |
| 6 V1344 AQL | V1426 AQLa | 19:12:12.01 | +04:23:41.5 | 1.175147 | 2 |
| 7 V1344 AQL | ... | 19:12:13.21 | +04:16:54.5 | ⩾450 | |
| 12 V1344 AQL | ... | 19:11:54.89 | +04:25:22.8 | ⩾220 | |
| 32 V1344 AQL | ... | 19:12:20.96 | +04:17:49.3 | ⩾450 | |
| 3 AO AUR | Kiso C2-66b | 05:48:03.07 | +32:03:19.6 | ∼150 | |
| 16 CF CAS | QX CASc | 23:58:43.16 | +61:09:39.5 | 6.004709 | 3 |
| 5 RS CAS | ... | 23:37:41.62 | +62:21:18.8 | 55 | |
| 8 FM CAS | ... | 00:14:46.95 | +56:11:32.0 | ⩾320 | |
| 1 SU CYG | ... | 19:45:02.09 | +29:15:06.3 | ∼160 | |
| 20 SU CYG | ... | 19:45:18.23 | +29:13:09.7 | ∼216 | |
| 26 SU CYG | ... | 19:44:54.74 | +29:20:29.8 | ∼350 | |
| 1 VZ CYG | V0673 CYG | 21:51:37.74 | +43:09:58.6 | 325.5 | 4 |
| 6 EZ CYG | V2222 CYG | 19:57:52.75 | +30:11:53.9 | 176 | |
| 18 EZ CYG | ... | 19:57:49.62 | +30:18:18.3 | ⩾281 | |
| 1 GH CYG | ... | 19:59:35.96 | +29:26:31.3 | ⩾240 | |
| 11 GH CYG | ... | 19:59:18.67 | +29:22:51.5 | ⩾240 | |
| 3 KX CYG | ... | 20:24:16.34 | +40:38:04.6 | ⩾200 | |
| 7 MW CYG | ... | 20:12:32.33 | +32:49:03.8 | ⩾240 | |
| 3 V0438 CYG | ... | 20:19:16.66 | +40:04:04.7 | ⩾270 | |
| 28 V0438 CYG | ... | 20:19:15.18 | +40:03:57.3 | ⩾350 | |
| 11 V0495 CYG | ... | 20:16:11.19 | +35:01:39.5 | ⩾270 | |
| 1 V1364 CYG | V1422 CYG | 20:07:52.84 | +35:18:57.4 | ⩾120 | |
| 4 V1467 CYG | ... | 20:04:05.74 | +32:29:28.3 | ⩾230 | |
| 14 V1467 CYG | ... | 20:04:05.94 | +32:25:55.8 | ⩾220 | |
| 80 SV MON | V0615 MON | 06:21:53.85 | +06:26:27.1 | ∼127 | |
| 11 AC MON | BB MONa | 07:01:16.48 | −08:41:42.5 | 1.4654 | 2 |
| 11 WZ SGR | ... | 18:17:29.32 | −19:07:25.5 | ⩾215 | |
| 74 WZ SGR | ... | 18:16:54.43 | −19:01:30.5 | ⩾250 | |
| 77 WZ SGR | ... | 18:17:17.68 | −19:00:02.5 | ⩾250 | |
| 2 AY SGR | ... | 18:23:41.67 | −18:39:20.9 | ⩾215 | |
| 110 AY SGR | ... | 18:23:35.30 | −18:36:37.3 | ⩾215 | |
| 29 AY SGR | ... | 18:23:23.41 | −18:38:42.2 | ⩾230 | |
| 505 AY SGR | ... | 18:23:06.14 | −18:36:39.0 | ∼190 | |
| 168 AY SGR | ... | 18:23:36.73 | −18:34:48.6 | ∼118 | |
| 29 X SCT | ... | 18:31:29.13 | −13:11:14.9 | ⩾200 | |
| 37 X SCT | ... | 18:31:41.59 | −13:10:48.1 | ⩾350 | |
| 56 X SCT | ... | 18:31:31.56 | −13:10:33.4 | ⩾320 | |
| 60 X SCT | ... | 18:31:16.55 | −13:11:59.2 | ⩾400 | |
| 77 X SCT | ... | 18:31:47.20 | −13:06:19.7 | ∼230 | |
| 6 Y SCT | ... | 18:38:15.54 | −08:18:22.8 | ⩾400 | |
| 7 Y SCT | ... | 18:37:54.36 | −08:17:40.8 | ⩾400 | |
| 18 Y SCT | ... | 18:38:07.98 | −08:24:32.6 | ⩾200 | |
| 25 Y SCT | ... | 18:37:54.89 | −08:17:06.9 | ⩾400 | |
| 35 Y SCT | ... | 18:38:31.16 | −08:19:09.2 | ⩾500 | |
| 37 Y SCT | ... | 18:38:31.14 | −08:23:17.8 | ⩾320 | |
| 60 Y SCT | ... | 18:37:55.13 | −08:20:27.9 | ⩾500 | |
| 73 Y SCT | ... | 18:38:02.34 | −08:24:03.1 | ⩾400 | |
| 4 Z SCT | StRS 248 | 18:43:19.31 | −05:50:02.4 | ⩾200 | 5 |
| 6 Z SCT | ... | 18:43:20.93 | −05:51:25.7 | ⩾400 | |
| 13 Z SCT | ... | 18:42:52.35 | −05:46:26.6 | 74.65 | |
| 17 Z SCT | ... | 18:43:12.12 | −05:44:16.3 | ⩾400 | |
| 19 Z SCT | ... | 18:43:19.23 | −05:47:19.8 | ⩾500 | |
| 34 Z SCT | ... | 18:42:44.47 | −05:44:50.2 | ⩾500 | |
| 73 Z SCT | ... | 18:43:06.24 | −05:51:11.5 | ⩾500 | |
| 99 Z SCT | ... | 18:42:50.37 | −05:54:09.1 | ⩾300 | |
| 2 RU SCT | ... | 18:41:52.63 | −04:07:24.2 | ⩾350 | |
| 6 SS SCT | ... | 18:44:05.02 | −07:44:50.9 | ⩾400 | |
| 28 SS SCT | ... | 18:44:03.84 | −07:38:33.8 | ⩾350 | |
| 51 SS SCT | ... | 18:43:35.38 | −07:47:35.0 | ⩾300 | |
| 4 UZ SCT | ... | 18:31:18.58 | −12:57:18.6 | ⩾400 | |
| 6 UZ SCT | ... | 18:31:30.38 | −12:51:36.7 | ⩾400 | |
| 10 UZ SCT | ... | 18:31:12.85 | −12:51:34.1 | ⩾320 | |
| 34 UZ SCT | ... | 18:31:19.93 | −12:59:20.1 | ⩾350 | |
| 7 CK SCT | ... | 18:40:46.68 | −06:04:14.9 | ⩾220 | |
| 9 CK SCT | ... | 18:40:47.76 | −06:06:55.0 | ⩾400 | |
| 10 CK SCT | ... | 18:41:07.90 | −06:05:26.1 | ⩾220 | |
| 13 CK SCT | ... | 18:41:25.27 | −06:03:16.2 | ⩾220 | |
| 17 CK SCT | ... | 18:41:18.03 | −06:09:17.7 | ⩾350 | |
| 25 CK SCT | ... | 18:41:18.33 | −06:08:19.0 | ⩾300 | |
| 28 CK SCT | ... | 18:40:51.59 | −06:02:47.0 | ⩾400 | |
| 42 CK SCT | ... | 18:41:20.47 | −06:01:37.9 | ⩾400 | |
| 43 CK SCT | ... | 18:40:47.18 | −06:08:36.1 | ⩾200 | |
| 46 CK SCT | ... | 18:41:20.38 | −06:11:46.9 | ⩾500 | |
| 52 CK SCT | ... | 18:41:03.94 | −06:09:05.8 | ⩾300 | |
| 60 CK SCT | ... | 18:41:07.28 | −06:08:35.6 | ⩾200 | |
| 61 CK SCT | ... | 18:41:27.45 | −06:07:15.9 | ⩾200 | |
| 22 AA SER | ... | 18:41:17.74 | −01:07:05.1 | ⩾300 | |
| 5 CR SER | ... | 18:10:30.51 | −13:31:53.1 | ⩾220 | |
| 2 X VUL | ... | 19:57:52.59 | +26:31:00.6 | ⩾300 | |
| 8 AS VUL | ... | 19:47:47.48 | +27:53:23.7 | ⩾202 | |
| 8 BR VUL | ... | 19:46:40.09 | +22:53:27.7 | 246 |
Notes. Right ascension and declination are adopted from the 2MASS point source catalog, see the text. aEclipsing binary. bCarbon star. cQX Cas, an eclipsing binary. No variability was detected in this work. References. (1) Rosino et al. 1997; (2) Pojmanski et al. 2006; (3) Kjurkchieva et al. 2007; (4) Samus et al. 2009; (5) Stephenson 1992.
Table 6. Photometric Data for Serendipitous Variables
| BIRCAM Field ID | HJD | J ± σJa | H ± σHa | K ± σKa |
|---|---|---|---|---|
| 10 SZ AQL | 2454574.919 | 9.226 ± 0.018 | 7.750 ± 0.014 | 7.020 ± 0.017 |
| 10 SZ AQL | 2454579.969 | 9.227 ± 0.018 | 7.748 ± 0.014 | 7.060 ± 0.017 |
| 10 SZ AQL | 2454585.919 | 9.150 ± 0.018 | 7.713 ± 0.014 | 7.044 ± 0.017 |
| 10 SZ AQL | 2454611.902 | 9.036 ± 0.017 | 7.702 ± 0.014 | 7.071 ± 0.017 |
| 10 SZ AQL | 2454629.798 | 9.035 ± 0.017 | 7.717 ± 0.014 | 7.121 ± 0.017 |
| 10 SZ AQL | 2454641.850 | 9.066 ± 0.017 | 7.744 ± 0.014 | 7.148 ± 0.017 |
| 10 SZ AQL | 2454643.964 | 8.994 ± 0.017 | 7.693 ± 0.014 | 7.122 ± 0.017 |
| 10 SZ AQL | 2454726.659 | 8.186 ± 0.015 | 6.850 ± 0.012 | 6.227 ± 0.016 |
| 10 SZ AQL | 2454735.654 | 8.135 ± 0.014 | 6.824 ± 0.012 | 6.260 ± 0.016 |
| 10 SZ AQL | 2454739.590 | 8.114 ± 0.014 | 6.798 ± 0.012 | 6.260 ± 0.016 |
| 10 SZ AQL | 2454755.576 | 8.148 ± 0.014 | 6.826 ± 0.012 | 6.159 ± 0.016 |
| 10 SZ AQL | 2454762.556 | 8.173 ± 0.015 | 6.887 ± 0.012 | 6.268 ± 0.016 |
Notes. The data for all observed variables are available online; see the text.
aJ, H, and K photometric uncertainty determined from the data ( ).
).
Only a portion of this table is shown here to demonstrate its form and content. A machine-readable version of the full table is available.
Download table as: DataTypeset image
6. CONCLUDING REMARKS
One hundred twenty-nine fields containing Galactic Cepheids were synoptically observed over the course of 10 months at the University of Wyoming 0.6 m telescope at Red Buttes Observatory. These data represent a significant change from previous studies of Galactic Cepheids in that the photometric data were obtained using ensemble aperture photometry over a calibrated 10 arcmin field of view using differential measurements from local standards. The NIR light curves for 131 Cepheids were interpolated to obtain the intensity-weighted mean magnitudes. The final results are in agreement with previous studies and triple the number of FMGCs with accurate NIR photometry.
When combined with radial velocity measurements, these new data will allow the determination of radii and distances, via the Barnes–Evans IRSB technique. As distances and radii become available for this sample, it will possible to accurately and precisely construct a statistically robust Galactic NIR PL relation and period–radius relation. With an accurate Galactic NIR PL relation at hand, it will be possible to calibrate the distance to calibrating galaxies in the NIR using HST/JWST and bypass the LMC. This has the benefit of avoiding the systematic uncertainty in the LMC distance and it mitigates the complication of any PL slope dependence on metal abundance.
In this survey, 82 previously unclassified but probable long-period variables were discovered. It is clear that the discovery of these variables was made possible by synoptic observations of the Galactic disk at NIR wavelengths. Given the areal coverage and depth of the BIRCAM survey in the Galactic Plane, a long-term synoptic observing program in the NIR of the entire Galactic disk would likely reveal tens of thousands of long-period variables currently hidden behind several magnitudes of optical extinction.
The authors express their appreciation to the support received at Red Buttes Observatory by Ron Canterna, Chris Rodgers, and Vanessa Bailey who have helped make this research possible. In this research, we have used and acknowledge with thanks, data from the General Catalog of Variable Stars. This publication makes use of the data products from the 2MASS project as well as the SIMBAD database, Aladin, and Vizier catalogue operation tools (CDS Strabourg, France). The Two Micron All Sky Survey is a joint project of the University of Massachusetts and the Infrared Processing Center/California Institute of Technology, funded by the National Aeronautics and Space Administration and the National Science Foundation. BIRCAM was developed with support from a grant from the Astronomical Science Division of the National Science Foundation (NSF/MRI 0421507).
Footnotes
- 3
- 4
Updated coefficients can be found at http://www.astro.caltech.edu/~jmc/2mass/v3/transformations/.
- 5
The online data can be found at http://obs.carnegiescience.edu/research/data/ApJS193_1_12
- 6