


ABSTRACT
This is the fourth paper in a series of multi-epoch observations at 7 mm wavelength of the SiO masers in several asymptotic giant branch stars from a sample of Mira variable stars showing evidence of asymmetric structure in the infrared. These stars have been observed interferometrically in the infrared by IOTA and with VLBA measurements of the SiO masers. In this paper, we present the observations of χ Cygni (χ Cyg), R Aquilae (R Aql), R Leo Minoris (R LMi), RU Herculis (RU Her), U Herculis (U Her), and U Orionis (U Ori). Several radial features with velocity gradients were observed, all with velocities close to systemic furthest from the star and redshifted closer to the stellar surface. Systemic velocities are estimated for several of the stars. No compelling evidence of asymmetry is seen in the maser distributions. All maser rings are approximately twice the near-IR uniform disk diameter and are comparable in size to the extended molecular envelope when such measurements are available.
Export citation and abstract BibTeX RIS
1. INTRODUCTION
Toward the ends of their lives, stars of a few solar masses go through the asymptotic giant branch (AGB) phase during which the core has exhausted its fuel and collapses while the outer envelope becomes very extended and is eventually lost; this may lead to formation of a planetary nebula (Iben & Renzini 1983; Willson & Kim 2004). During the AGB phase, the star undergoes dramatic periodic oscillations which are believed to be driving the mass loss. The details of the mechanism of mass loss are not well understood and neither is the reason many planetary nebulae are very asymmetric while their AGB progenitors appear generally circularly symmetric.
Asymmetries are also sometimes observed in the AGB stars themselves. Asymmetric structure in the optical has been reported in Mira by Karovska (1997), in U Ori in the near-IR by Mondal & Chandrasekhar (2004) and Pluzhnik et al. (2009), and in R Aqr by Ragland et al. (2006). Asymmetries in the optical in R Leo and W Hya are cited by Lattanzi et al. (1997) and in the radio photospheres by Reid & Menten (2007). Asymmetric structure in the maser emission in IK Tau was demonstrated in an earlier paper in this series (Cotton et al. 2010), as well as Boboltz & Diamond (2005).
Infrared interferometry has shown that these stars are surrounded by an extended molecular envelope (Perrin et al. 2004; Le Bouquin et al. 2009). In oxygen-rich stars, molecular masers appear, especially SiO, H2O, and OH masers, at increasing distances from the photosphere (Habing 2004; Reid & Moran 1981). The SiO masers appear within a few stellar radii of the stellar surface between the hot inner envelope and the cooler region at several R⋆ where the (silicate) dust forms (see Reid & Menten 1997; Danchi et al. 1994). Where common observations exist, the size of the masing regions is comparable to the size of the molecular envelope.
Circumstellar SiO masers tend to occur in clumpy, partial rings centered on the star (Diamond et al. 1994). A long path through relatively constant (radial) velocity gas is needed for the masers to develop the necessary gain to be visible. This condition is most often met for lines of sight tangent to the masing layer in regions of a relatively low turbulence. Turbulence will reduce the path length at a given velocity limiting the gain, hence brightness, of the corresponding maser spot. Recent theoretical work on SiO masers in Miras is described in Gray et al. (2009).
Interferometric observations in the infrared (Ragland et al. 2006) have shown that a substantial fraction of Mira variables show asymmetries in the near-IR. To follow up on this result, our team coordinated Infrared Optical Telescope Array (IOTA) Interferometer observations in the near-IR with Very Long Baseline Array (VLBA) observations of the SiO masers for a sample of the asymmetric Miras. The samples of stars for which SiO maser observations using the VLBA were made were those shown to have strong evidence for brightness asymmetries from infrared interferometry and which were known from the literature to contain observable masers. The combined results on R Aqr have been published (Ragland et al. 2008) and the SiO maser results for R Leo appeared in the first paper in this series (Cotton et al. 2009a), the second on R Cancri (Cotton et al. 2009b), and the third on IK Tauri (Cotton et al. 2010). Pluzhnik et al. (2009) produce near-IR images of U Ori. In this paper, we present SiO maser observations of χ Cygni (χ Cyg), R Leo Minoris (R LMi), RU Herculis (RU Her), U Herculis (U Her), and U Orionis (U Ori) with a resolution of ∼200 μarcsec.
2. OBSERVATIONS AND DATA REDUCTION
The VLBA was used to make high-resolution images of the target Miras in the ν = 1, J = 1–0 and ν = 2, J = 1–0 masing transitions of SiO at 43.1 and 42.8 GHz, respectively. The assumed rest velocities are 43.122,027 and 42.820,587 GHz, respectively. Stokes I, Q, and U were observed. At each epoch, approximately five stars were observed, alternating among the targets with good mutual visibility among the antennas. Two-bit sampling was used in the recording. A strong, nearby continuum source was observed before each star to serve as delay, bandpass, and polarization calibrator. The calibrators are all quasars with milliarcsecond accuracy positions; the Hipparcos (ESA 1997) positions of the stars evaluated at the epoch of the observations were used.
These observations were at eight epochs spanning the period 2004 November to 2006 September; each session was 10 hr in duration. The entire series of observations is summarized in Table 1. χ Cyg was observed at seven epochs but was not detected in one of the transitions in three of these. The center velocity used for χ Cyg was 11 km s−1. R Aql was observed at one epoch with a center velocity of 50 km s−1. R LMi was observed at four epochs with a center velocity of 2 km s−1. RU Her was observed at two epochs with a center velocity of −13 km s−1. U Her was observed at one epoch with center velocities of −16 km s−1 for the ν = 1, J = 1–0 transition and −14 km s−1 for ν = 2, J = 1–0 transition. U Ori was observed at three epochs with center velocities of −40 km s−1 for the ν = 1, J = 1–0 transition and −34 km s−1 for ν = 2, J = 1–0 transition. R Ser was observed at a single epoch with a center velocity of −34 km s−1 but was not detected. The velocities were picked to center the spectra in the available bandpass and are not necessarily the systemic velocity.
Table 1. Stellar Pulsation Phases of the Observed Stars
| Star | Period | Aa | B | C | D | E | F | G | H |
|---|---|---|---|---|---|---|---|---|---|
| (day) | |||||||||
| χ Cygnib | 402.30 | 0.51 | 1.00 | 1.37 | 1.62 | 1.79 | 1.91 | 2.19 | |
| IK Taurib,c | 470.0 | 0.53 | 1.27 | 1.49 | 1.63 | 1.73 | 1.97 | ||
| R Aquilaeb | 284.2 | 0.34 | |||||||
| R Cancrib,d | 361.60 | 0.13 | 0.48 | 1.09 | 1.38 | 1.56 | 1.69 | 2.00 | |
| R Leonise,f,g | 309.95 | 0.66 | 0.99 | 1.20 | 1.36 | 1.72 | |||
| R Leo Minorisb | 372.19 | 0.09 | 0.43 | 0.59 | 1.03 | ||||
| U Orionis b,e | 368.3 | 0.89 | 1.24 | 1.84 | |||||
| RU Herculisb | 484.83 | 0.62 | 0.74 | ||||||
| U Herculisb,e,f | 406.10 | 0.95 | |||||||
| R Serpentisb | 356.41 | 0.22 |
Notes. aA: 2004 November 8; B:2005 March 14; C: 2005 May 12; D: 2005 October 23; E: 2006 February 3; F:2006 April 9; G: 2006 May 28; H: 2006 September 16. bObserved by Ragland et al. (2006). cObserved by Cotton et al. (2010). dObserved by Cotton et al. (2009b). eObserved by Cotton et al. (2004). fObserved by Cotton et al. (2008). gObserved by Cotton et al. (2009a).
Download table as: ASCIITypeset image
Since the data were not phase referenced to an astrometric standard, the images have an arbitrary offset from the stellar photosphere. The photosphere itself is not visible in these high-resolution observations due to their low surface brightness sensitivity. Much lower resolution observations, e.g., with the VLA,9 are needed to align the masers to the stellar photosphere (see Reid & Menten 2007). However, the calibration does align the images in the two transitions within a few milliarcseconds. This alignment was refined using isolated features and groups appearing at the same velocity. The maser ring is assumed centered on the star.
The polarization angle calibration used the VLA polarization angle service10 which uses VLA calibration measurements to derive the polarization angle (EVPA) of selected bright calibrators. The polarization measurements were interpolated to the date of the observations for the calibrators in common. Integrated apparent EVPA values for the VLBA calibrator observations were derived from the summed CLEAN components in the Q and U images and a correction determined which was applied to all maser observations. The VLA calibrator measurements are from observations unrelated to the maser observations and for a given source may differ in time by several months. Since these are generally blazars, their polarized emission is quite variable on these timescales. The derived EVPA calibration should be generally good to 10° based on the observed scatter among the various calibrators; typically 2–3 per session.
The observations were correlated at the VLBA11 correlator in Socorro, NM, USA. The correlations resulted in 128 channels 31.25 kHz wide in each of the combinations of right- and left-circular polarization for each transition. These include four cross-correlations between antenna pairs and two auto-correlations for the single dish spectra. The frequency resolution was 31.25 kHz corresponding to a velocity resolution of about 0.2 km s−1. Calibration was done in the NRAO AIPS12 package and imaging and subsequent processing in the Obit package (Cotton 2008)13 Calibration and imaging were as described in Cotton et al. (2009a).
3. RESULTS
The results from each observation of each star consist of images of the maser emission, flux density weighted velocity images, single dish and integrated image spectra, and fitted ring sizes. Coherent imaging requires successful self-calibration in at least one channel in each spectrum; detection in each atmospheric coherence time (∼20 s at most epochs) requires a signal-to-noise ratio (S/N) for a given antenna of at least 3 based on the post-fit rms phase residuals. The results are presented in the following sections.
3.1. Images
Each star observed was imaged in a set of velocity channels in each transition covering the range of velocities in which emission was detectable. Imaging used Obit task Imager using the autoWindow feature to restrict CLEAN to regions containing plausible emission. Integrated images of the maser emission were derived by summing the flux density in each pixel with significant emission in each channel image. Significant emission was taken to be those pixels with values that were larger than the greater of a multiple of the channel rms noise and a fraction of the channel peak flux density; details varied by star and epoch. Velocity images were derived by making a flux density weighted velocity from the channel pixels with significant emission.
3.2. Spectra
Single dish auto-correlation spectra were derived from the observations of one of the VLBA antennas, usually that on Mona Kea. Interferometric image spectra were computed from the sum of the CLEAN components in each channel image.
SiO masers occur mainly in a ring tangent to the local line of sight to the star, the difference in the velocity of a given maser spot from systemic is largely that of the random turbulence in the envelope. Therefore, an estimate of the systemic velocity can be obtained from the average flux density weighted velocity over the spectrum. Estimates of the systemic velocities were made for the stars observed at multiple epochs.
3.3. SiO Ring Diameters
Circular ring diameters were fitted to image pairs in the two transitions using Obit task Ringer (Cotton et al. 2009a). The fitting used a direct parameter search and adopted a common center for the two images but with independent ring diameters and widths. The values adopted were those which minimized the sum of the ring widths. The fitting results for each ring are given in Tables 2 and 3.
Table 2. SiO Ring Diameters
| Source | Nov 4 (A) | Mar 5 (B) | May 5 (C) | Oct 5 (D) | ||||
|---|---|---|---|---|---|---|---|---|
| Diam (mas) | Width | Diam (mas) | Width | Diam (mas) | Width | Diam (mas) | width | |
| χ Cyg [1]a | 36.8 | 5.3 | 30.4 | 2.0 | ||||
| χ Cyg [2]b | Xc | X | 29.9 | 0.6 | ||||
| R Aql [1] | 26.1 | 1.5 | ||||||
| R Aql [2] | 22.3 | 1.9 | ||||||
| R LMi [1] | 22.6 | 1.5 | 28.9 | 2.2 | 23.2 | 1.3 | 24.2 | 2.2 |
| R LMi [2] | 21.8 | 1.8 | 26.1 | 1.8 | 20.2 | 0.8 | 21.6 | 1.3 |
| RU Her [1] | 20.0 | 0.9 | 20.6 | 1.1 | ||||
| RU Her [2] | 18.2 | 1.6 | 18.4 | 1.9 | ||||
| U Her [1] | 27.0 | 2.0 | ||||||
| U Her [2] | 21.8 | 1.9 | ||||||
| U Ori [1] | 24.4 | 2.4 | 28.2 | 2.7 | 30.8 | 1.2 | ||
| U Ori [2] | 25.2 | 2.5 | 25.4 | 2.6 | 29.4 | 0.6 | ||
Notes. Due to the very sparse nature of the rings, it is not possible to determine a meaningful uncertainty for the ring diameter. The closest possible is a range of distances from the assumed center in which maser spots appear. These are given as "width." Variations in size smaller than this width are difficult to establish. a[1] denotes the ν = 1, J = 1–0 transition of SiO at 43.1 GHz. b[2] denotes the ν = 2, J = 1–0 transition of SiO at 42.8 GHz. cX denotes a non-detection.
Download table as: ASCIITypeset image
Table 3. SiO Ring Diameters Continued
| Source | Feb 6 (E) | Apr 6 (F) | May 6 (G) | Sep 6 (H) | ||||
|---|---|---|---|---|---|---|---|---|
| Diam (mas) | Width | Diam (mas) | Width | Diam (mas) | Width | Diam (mas) | width | |
| χ Cyg[1]a | 41.2 | 2.4 | 47.0 | 2.4 | 49.6 | 2.2 | 30.3 | 0.5 |
| χ Cyg[2]b | 42.6 | 4.2 | Xc | X | X | X | 29.6 | 1.0 |
Notes. Due to the very sparse nature of the rings, it is not possible to determine a meaningful uncertainty for the ring diameter. The closest possible is a range of distances from the assumed center in which maser spots appear. These are given as "width." Variations in size smaller than this width are difficult to establish. a[1] denotes the ν = 1, J = 1–0 transition of SiO at 43.1 GHz. b[2] denotes the ν = 2, J = 1–0 transition of SiO at 42.8 GHz. cX denotes a non-detection.
Download table as: ASCIITypeset image
3.4. Chi Cygni
Images of χ Cyg are shown in Figures 1–4. The spectra observed are shown in Figures 5 and 6 and the fitted ring sizes are given in Tables 2 and 3. Insufficient maser emission was detected in 2005 May 12 to fit the ring. A plot of the ring diameters as a function of luminosity phase is given in Figure 7. The average velocity in the single dish spectra in Figures 5 and 6 with a good S/N is 8.9 km s−1 with a standard deviation of the mean of 0.1 km s−1. Allowing for unmodeled systematic errors such as the limited sampling of the maser ring, the estimate of the systemic velocity is 8.9 ± 1.0 km s−1.

Figure 1. χ Cyg ν = 2, J = 1–0 transition of SiO at 42.8 GHz. The top row is the square root of total intensity as a gray scale; scale in Jy beam−1 is given by the bar at the top. The circle shows the location and size of the fitted ring. The bottom row gray scale shows velocity averages of pixels with significant emission; the 5σ contour in Stokes I is overplotted; the contours are in white when on top of a sufficiently dark region.
Download figure:
Standard image High-resolution image
Figure 2. Same as Figure 1, but for χ Cyg ν = 1, J = 1–0 transition of SiO at 43.1 GHz.
Download figure:
Standard image High-resolution image
Figure 3. Same as Figure 2.
Download figure:
Standard image High-resolution image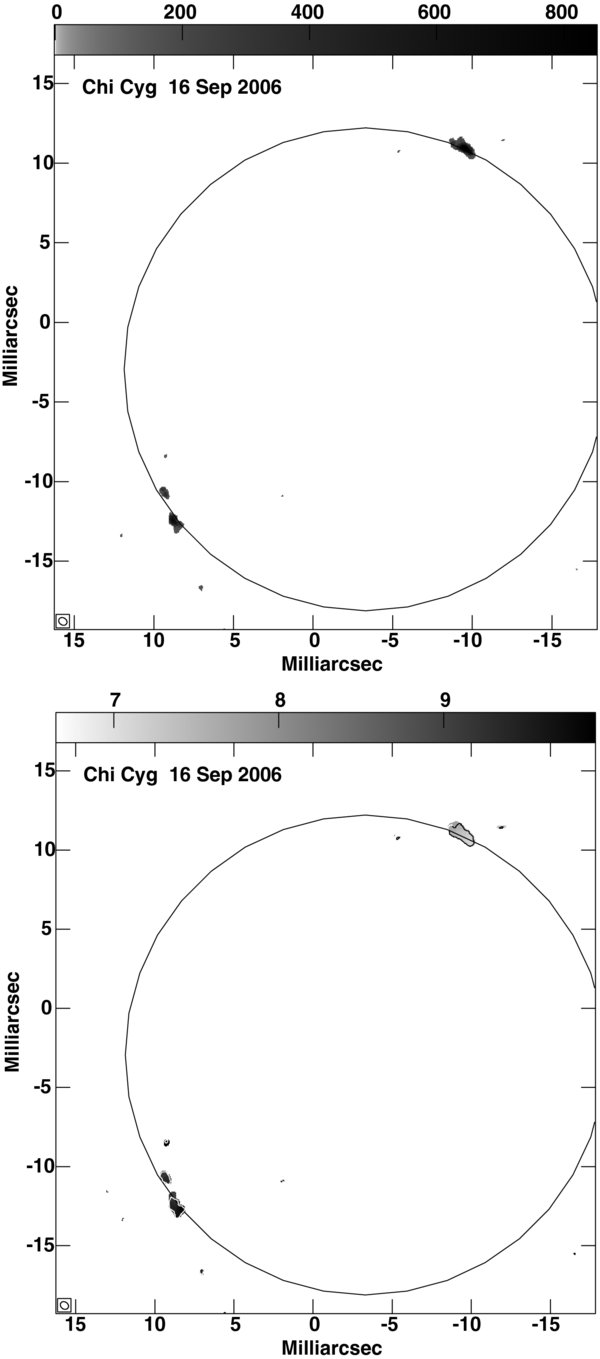
Figure 4. Same as Figure 2.
Download figure:
Standard image High-resolution image
Figure 5. χ Cyg. Spectra: solid line is the reference single dish spectrum, stars (*) are derived from the images. Left: ν = 1, J = 1–0 transition of SiO at 43.1 GHz; right: ν = 2, J = 1–0 transition of SiO at 42.8 GHz. χ Cyg was not detected in the ν = 2, J = 1–0 transition in 2004 November 8 and 2005 May 12.
Download figure:
Standard image High-resolution image
Figure 6. χ Cyg. Spectra: solid line is the reference single dish spectrum, stars (*) are derived from the images. Left: ν = 1, J = 1–0 transition of SiO at 43.1 GHz. Right: ν = 2, J = 1–0 transition of SiO at 42.8 GHz. χ Cyg was not detected in the ν = 2, J = 1–0 transition in 2006 April 9 and 2006 May 28.
Download figure:
Standard image High-resolution image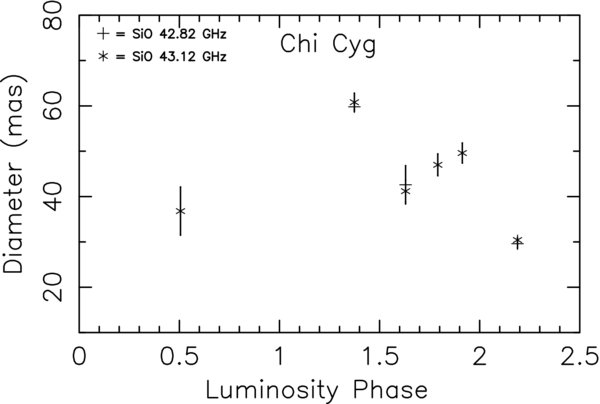
Figure 7. χ Cyg ring diameters as a function of luminosity phase.
Download figure:
Standard image High-resolution image3.5. R Aql
The images of R Aql are shown in Figures 8 and 9. Spectra are shown in Figure 10 and the fitted ring sizes are given in Table 2.
Figure 8. Same as Figure 1, but for R Aql ν = 2, J = 1–0 transition of SiO at 42.8 GHz.
Download figure:
Standard image High-resolution image
Figure 9. Same as Figure 1, but for R Aql ν = 1, J = 1–0 transition of SiO at 43.1 GHz.
Download figure:
Standard image High-resolution image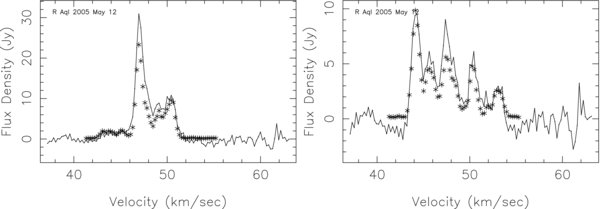
Figure 10. R Aql. Spectra: solid line is the reference single dish spectrum, stars (*) are derived from the images. Left: ν = 1, J = 1–0 transition of SiO at 43.1 GHz. Right: ν = 2, J = 1–0 transition of SiO at 42.8 GHz.
Download figure:
Standard image High-resolution image3.6. R LMi
The images of R LMi are shown in Figures 11–14. Spectra are shown in Figure 15 and the fitted ring sizes are given in Table 2. A plot of the ring diameters as a function of luminosity phase is given in Figure 16. The average velocity in the single dish spectra in Figure 15 is −0.3 km s−1 with a standard deviation of the mean of 0.7 km s−1. Allowing for unmodeled systematic errors such as the limited sampling of the maser ring, the estimate of the systemic velocity is −0.3 ± 1.0 km s−1.
Figure 11. Same as Figure 1, but for R LMi ν = 2, J = 1–0 transition of SiO at 42.8 GHz.
Download figure:
Standard image High-resolution image
Figure 12. Same as Figure 11.
Download figure:
Standard image High-resolution image
Figure 13. Same as Figure 1, but for R LMi ν = 1, J = 1–0 transition of SiO at 43.1 GHz.
Download figure:
Standard image High-resolution image
Figure 14. Same as Figure 13.
Download figure:
Standard image High-resolution image
Figure 15. R LMi. Spectra: solid line is the reference single dish spectrum; stars (*) are derived from the images. Left: ν = 1, J = 1–0 transition of SiO at 43.1 GHz. Right: ν = 2, J = 1–0 transition of SiO at 42.8 GHz.
Download figure:
Standard image High-resolution image
Figure 16. R LMi ring diameters as a function of luminosity phase.
Download figure:
Standard image High-resolution image3.7. RU Her
The images of RU Her are shown in Figures 17 and 18. Spectra are shown in Figure 19 and the fitted ring sizes are given in Table 2. The average velocity in the single dish spectra in Figure 19 is −10.1 km s−1 with a standard deviation of the mean of 0.3 km s−1. Allowing for unmodeled systematic errors such as the limited sampling of the maser ring, the estimate of the systemic velocity is −10.1 ± 1.0 km s−1.
Figure 17. Same as Figure 1, but for RU Her ν = 2, J = 1–0 transition of SiO at 42.8 GHz.
Download figure:
Standard image High-resolution image
Figure 18. Same as Figure 1, but for RU Her ν = 1, J = 1–0 transition of SiO at 43.1 GHz.
Download figure:
Standard image High-resolution image
Figure 19. RU Her. Spectra: solid line is the reference single dish spectrum; stars (*) are derived from the images. Left: ν = 1, J = 1–0 transition of SiO at 43.1 GHz. Right: ν = 2, J = 1–0 transition of SiO at 42.8 GHz.
Download figure:
Standard image High-resolution image3.8. U Her
The images of U Her are shown in Figures 20 and 21. The spectra are shown in Figure 22 and the fitted ring sizes are given in Table 2.
Figure 20. Same as Figure 1, but for U Her ν = 2, J = 1–0 transition of SiO at 42.8 GHz.
Download figure:
Standard image High-resolution image
Figure 21. Same as Figure 1, but for U Her ν = 1, J = 1–0 transition of SiO at 43.1 GHz.
Download figure:
Standard image High-resolution image
Figure 22. U Her. Spectra: solid line is the reference single dish spectrum; stars (*) are derived from the images. Left: ν = 1, J = 1–0 transition of SiO at 43.1 GHz. Right: ν = 2, J = 1–0 transition of SiO at 42.8 GHz.
Download figure:
Standard image High-resolution image3.9. U Ori
The images of U Ori are shown in Figures 23 and 24. The spectra are shown in Figure 25 and the fitted ring sizes are given in Table 2. A plot of the ring diameters as a function of luminosity phase is given in Figure 26. The average velocity in the single dish spectra in Figure 15 is −38.1 km s−1 with a standard deviation of the mean of 0.3 km s−1. Allowing for unmodeled systematic errors such as the limited sampling of the maser ring, the estimate of the systemic velocity is −38.1 ± 1.0 km s−1.
Figure 23. Same as Figure 1, but for U Ori ν = 2, J = 1–0 transition of SiO at 42.8 GHz.
Download figure:
Standard image High-resolution image
Figure 24. Same as Figure 1, but for U Ori ν = 1, J = 1–0 transition of SiO at 43.1 GHz.
Download figure:
Standard image High-resolution image
Figure 25. U Ori. Spectra: solid line is the reference single dish spectrum; stars (*) are derived from the images. Left: ν = 1, J = 1–0 transition of SiO at 43.1 GHz. Right: ν = 2, J = 1–0 transition of SiO at 42.8 GHz.
Download figure:
Standard image High-resolution image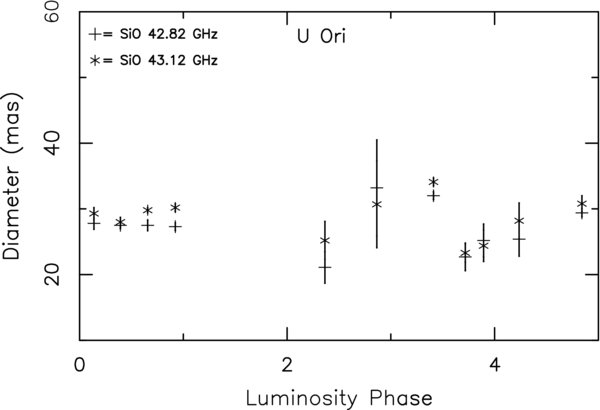
Figure 26. U Ori ring diameters as a function of luminosity phase. Includes data from Cotton et al. (2004, 2006).
Download figure:
Standard image High-resolution image4. DISCUSSION
The sources observed are considered individually in the following sections.
4.1. Jet-like Radial Features
Extended linear, radial features like the ones appearing in R Leo discussed in Cotton et al. (2009a) were noted in a number of the maser images. These features frequently exhibit linear polarization which is interpreted as a tracer of the direction of the magnetic field (Cotton et al. 2008). Several of these features are examined in more detail in the following sections.
4.2. Chi Cygni
Ragland et al. (2006) give a uniform disk diameter of 22.6 ± 0.5 mas at 1.6 μm at phase 0.2 and a significantly nonzero closure phase indicating asymmetry. Woodruff et al. (2008) used aperture masking to measure the size in the near-IR at a number of epochs obtaining uniform diameter fits of 21.3–28.5 mas at 1.24 μm, 19.5–28.1 mas at 1.65 μm, 23.0–42.1 mas at 2.26 μm, and 39.5–53.1 mas at 3.08 μm. Lacour et al. (2009) used near-IR H-band interferometric imaging at multiple epochs and obtained stellar diameters ranging from 19.9 to 26.2 and a parallax of 5.9 ± 1.5 mas and a mass of 2.1 +1.5 −0.7 M☉. Asymmetric brightness distributions are reported at some epochs with prominent hot spots.
Narrow-band imaging in K band by Perrin et al. (2004) was modeled as a stellar photosphere plus a dense molecular layer. At stellar phase 0.76 (2001), a stellar radius of 8.06 ± 0.02 mas and a molecular layer radius of 15.39 ± 0.10 mas were measured; at stellar phase 0.24 (2002), these were 10.55 ± 0.01 and 18.78 ± 0.06, respectively. The molecular layer was determined to be dominated by CO.
Mid-IR interferometric measurements at 11.15 μm by Tatebe et al. (2006) show an asymmetric distribution of dust around the star. Whitelock et al. (2008) give a distance based on the period–luminosity relationship of 170 pc.
SiO maser emission was reported by Spencer et al. (1981), Pardo et al. (2004), Kang et al. (2006), and Herpin et al. (2006). Single dish measurements of linear polarization in the SiO masers were given by Glenn et al. (2003).
χ Cyg was observed at seven epochs; it was detected in the ν = 1, J = 1–0 transition at all epochs but was only detected in the ν = 2, J = 1–0 transition in four of these. This is the largest of the objects observed and heavily resolved at some epochs. The maser "ring" is never well sampled making the measurements of the diameter rather unreliable; this likely accounts to the large scatter seen in Tables 2 and 3 and in Figure 7. In addition, the spectra shown in Figures 5 and 6 have relatively few features compared to those of the other stars.
The epochs sampled do not overlap with those in Perrin et al. (2004) but the ring diameters shown in Tables 2 and 3 are comparable to the cited diameters of the molecular envelopes. This is consistent with other comparisons of the SiO maser ring sizes with the molecular envelope.
The reason only one of the transitions was not detected at several epochs is unclear; in two of the four epochs there was a strong detection in the ν = 1, J = 1–0 transition but no detection of the ν = 2, J = 1–0 transition. The masers were not detected in the single dish spectra so they were not simply resolved out. Masers are highly nonlinear and a number of things such as turbulence or reduced pumping could cause them not to appear; these two transitions are generally not co-spatial. In addition, χ Cyg is an S type star so the bulk of the oxygen in the atmosphere is in the form of CO; this reduces the amount available for SiO.
4.3. R Aql
Ragland et al. (2006) give a uniform disk diameter of 12.7 ± 0.2 mas at 1.6 μm at phase 0.7 and a significantly nonzero closure phase indicating asymmetry. Millan-Gabet et al. (2005) measure diameters of 8.3 ± 0.1 mas at 1.65 μm and 10.6 ± 0.1 at 2.16 μm on 1998 June 13. Whitelock et al. (2008) give a distance based on the period–luminosity relationship of 220 pc.
Monitoring of OH maser emission is reported by Etoka & Le Squeren (2000). SiO maser emission was reported by Spencer et al. (1981), Cho et al. (1996), and Pardo et al. (2004).
R Aql was observed at a single epoch. Figure 10 shows that the flux density in the derived images is nearly that obtained from the single dish spectra; this shows that little of the emission is completely resolved out by the interferometer.
4.4. R LMi
Ragland et al. (2006) give a uniform disk diameter of 13.2 ± 0.2 mas at 1.6 μm at phase 0.5 and a significantly nonzero closure phase indicating asymmetry. Near-IR interferometry by van Belle et al. (2002) resulted in a uniform disk size of 14.4 ± 0.7 mas at 2.2 μm on 1996 March 7 (phase 0.48). Millan-Gabet et al. (2005) measure interferometric diameters of R LMi of 12.5 ± 0.1 and 12.6 ± 0.1 mas at 1.25 μm on 1998 February 28 and 1998 March 2; 12.8 ± 0.2 and 13.5 ± 0.1 mas at 1.65 μm on 1998 February 28 and 1998 March 2; and 12.1 ± 0.1, 14.2 ± 0.2, and 14.7 ± 0.1 at 2.16 μm on 1997 November 20, 1998 February 28, and 1998 March 2. Whitelock et al. (2008) give a distance based on the period–luminosity relationship of 330 pc.
Monitoring of OH maser emission is reported by Etoka & Le Squeren (1997) and Etoka & Le Squeren (2000); Etoka & Le Squeren (1997) cite the appearance of eruptive maser flares as evidence of a very thin envelope. van Langervelde et al. (1996) give the results of phase referenced VLBI measurements of the OH masers. Engels & Lewis (1996) report the detection of H2O masers and Colomer et al. (2000) give VLA measurements of these masers.
SiO maser emission was reported by Spencer et al. (1981), Cho et al. (1996), Pardo et al. (2004), and Herpin et al. (2006). Astrometry of the SiO masers was reported by Rioja et al. (2008) which allows accurate registration of the ν = 1 and ν = 2, J = 1–0 transition and indicates that the spots in the two transitions are rarely coincident.
R LMi was observed at four epochs covering a pulsation cycle. Figures 11–14 show a jet-like radial feature that persisted at least for the nearly one year span of the observations. A detailed view of this portion of the maser ring at the epochs sampled is given in Figure 27. While the feature was relatively stable, the orientation of linear polarization showed considerable evolution during the period observed; from being oblique to the feature in 2004 November and 2005 March, to transverse in 2005 May and to aligned with the feature in 2005 October. This presumably indicates an evolution of the magnetic field in the feature. The radial velocity changed systematically down this feature and is closest to the systemic furthest from the star.
Figure 27. Selected region of R LMi at ν = 1, J = 1–0 transition of SiO at 43.1 GHz at the epochs observed showing a persistent radial jet-like feature. The region shown is only approximately the same due to the uncertainties of registration of the images. Gray scale is the velocity shown by scale bar at the top; contours are total intensity spaced at powers of 2 from 100 mJy beam−1; vectors give the orientation and relative magnitude of the linear polarization E-vectors. The resolution is shown in the lower right. The stellar center is to the lower left.
Download figure:
Standard image High-resolution image4.5. RU Her
Ragland et al. (2006) give a uniform disk diameter of 8.0 ± 0.2 mas at 1.6 μm at phase 0.1 and a significantly nonzero closure phase indicating asymmetry. Near-IR interferometry by van Belle et al. (2002) resulted in a uniform disk size of 8.7 ± 0.4 mas at 2.2 μm on 1996 June 2 (phase 0.90). Whitelock et al. (2008) give a distance based on the period–luminosity relationship of 540 pc. SiO maser emission was reported by Spencer et al. (1981) and Cho et al. (1996). Single dish measurements of linear polarization in the SiO masers were given by Glenn et al. (2003).
RU Her was observed at two epochs separated by two months. The distribution of masers showed an unusual consistency between the two transitions and showed very little change over the two months between the observations. One of the groups of maser spots contained a radial feature which is shown in more detail in Figure 28. The linear polarization shows a tendency to be transverse to the direction of the feature in 2004 November, but any organization is not apparent by 2005 May. The radial velocity changes along the length of the feature by several km s−1 with the velocity closest to systemic furthest from the stellar surface.

Figure 28. Selected region of RU Her at ν = 1, J = 1–0 transition of SiO at 43.1 GHz at the epochs observed showing a radial jet-like feature. Gray scale is the velocity shown by scale bar at the top; contours are total intensity spaced at powers of 2 from 100 mJy beam−1; vectors give the orientation and relative magnitude of the linear polarization E-vectors. The resolution is shown in the lower right. The stellar center is to the lower left.
Download figure:
Standard image High-resolution image4.6. U Her
Ragland et al. (2006) give a uniform disk diameter of 9.7 ± 0.4 mas at 1.6 μm at phase 0.0 and a significantly nonzero closure phase indicating asymmetry. Near-IR interferometry by van Belle et al. (2002) resulted in a uniform disk size of 11.2 ± 0.6 mas at 2.2 μm on 1996 June 2 (phase 0.88). Whitelock et al. (2008) give a distance based on the period–luminosity relationship of 360 pc.
Monitoring of OH maser emission is reported by Etoka & Le Squeren (1997) and Etoka & Le Squeren (2000); Etoka & Le Squeren (1997) cite the appearance of eruptive maser flares as evidence of a very thin envelope. van Langervelde et al. (1996) give the results of phase referenced VLBI measurements of the OH masers and van Langervelde et al. (2000) report the parallax and proper motion of the OH masers, later improved in Vlemmings & van Langevelde (2007) which gives a distance of 266 + 21 −18 pc which is significantly smaller than that derived from the period–luminosity relationship (Whitelock et al. 2008).
Engels & Lewis (1996) report the detection of H2O masers and Colomer et al. (2000) give VLA measurements of these masers. Merlin observations of the H2O masers are reported by Bains et al. (2003) showing elongated, poorly filled shells and indications of shocked masers on the inner edges. VLBI measurements of the circular polarization in H2O masers by Vlemmings et al. (2002a) find a Zeeman splitting corresponding to magnetic fields of 1.5 or 2.5 G depending on the model. MERLIN astrometry of the H2O masers by Vlemmings et al. (2002b) shows that the star is not centered on the maser distribution.
SiO maser emission was reported by Spencer et al. (1981), Cho et al. (1996), and Pardo et al. (2004). Single dish measurements of linear polarization in the SiO masers were given by Glenn et al. (2003). Previous VLBA monitoring was described in Cotton et al. (2004).
U Her was observed only once during this project. One of the groups of maser spots contained a pair of radial features which is shown in more detail in Figure 29. The radial velocity varies smoothly by 4 km s−1 over the lengths of these features with the velocity closest to the systemic furthest from the photosphere. The linear polarization shows a tendency to be transverse to the direction of the feature in the polarized feature.
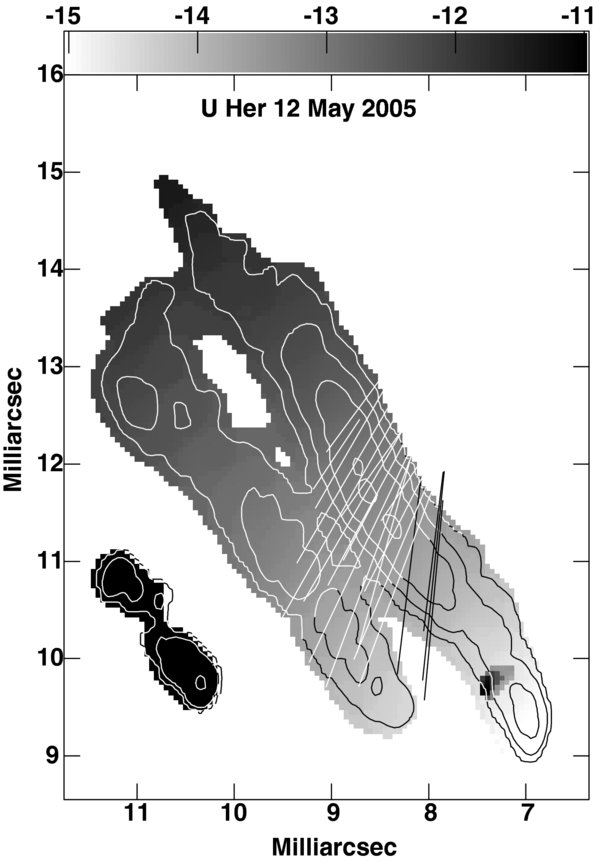
Figure 29. Selected region of U Her at ν = 1, J = 1–0 transition of SiO at 43.1 GHz on 2005 May 12 showing a radial jet-like feature. Gray scale is the velocity shown by scale bar at the top; contours are total intensity spaced at powers of 2 from 100 mJy beam−1; vectors give the orientation and relative magnitude of the linear polarization E-vectors. The stellar center is to the upper left.
Download figure:
Standard image High-resolution image4.7. U Ori
Ragland et al. (2006) give a uniform disk diameter of 11.3 ± 0.4 mas at 1.6 μm at phase 0.1 and a significantly nonzero closure phase indicating asymmetry. Near-IR lunar occultation measurements by Richichi & Calamai (2003) give a size at 2.2 μm of 15.14 ± 0.04 mas although with significant deviations from circular symmetry. A similar near-IR lunar occultation result by Mondal & Chandrasekhar (2004) at 2.2 μm gave a uniform disk size of 11.9 ± 0.3 mas at stellar phase 0.28 with an elongation at a position angle of 50°–70°. Interferometric imaging of U Ori at 1.51, 1.64, and 1.78 μm by Pluzhnik et al. (2009) reveals an asymmetric, lumpy structure.
Millan-Gabet et al. (2005) measure a diameter of 10.9 ± 0.1 mas at 1.25 μm and 12.5 ± 0.1 mas at 1.65 μm at stellar phase 0.9 and 11.5 ± 0.1 mas at 1.25 μm, 9.2 ± 0.3 mas at 1.65 μm, and 10.5 ± 0.4 at 2.16 μm at stellar phase 0.04. Mid-IR interferometric measurements at 11.15 μm by Tatebe et al. (2006) indicate a variable dust distribution around the envelope. Whitelock et al. (2008) give a distance based on the period–luminosity relationship of 270 pc.
Narrow-band imaging in the K band by Perrin et al. (2004) led to a model of a stellar surface and a molecular envelope with a stellar radius of 5.30 mas and a molecular layer radius of 12.88 mas at stellar phase 0.83 (2000) and at phase 0.91 (2001) with a stellar radius of 4.83 ± 0.06 and a molecular layer radius of 12.00 ± 0.03 mas. A single molecular layer may be an insufficient model.
Monitoring of OH maser emission is reported by Etoka & Le Squeren (1997) which cites the appearance of eruptive maser flares as evidence of a very thin envelope. MERLIN observations of the H2O masers by Bains et al. (2003) show elongated, poorly filled shells and indications of shocked masers on the inner edges.
SiO maser emission was reported by Spencer et al. (1981), Cho et al. (1996), and Herpin et al. (2006). Previous VLBA monitoring was described in Cotton et al. (2004, 2006).
U Ori was observed at three epochs, the images of which are shown in Figures 23 and 24. A jet-like radial feature appeared in 2004 November 8 and is displayed in more detail in Figure 30. Polarization was detected only over a portion of the feature and any relationship of the relative orientations is uncertain. The radial velocity changes smoothly along the feature and is closest to systemic furthest from the photosphere. The size of the maser rings increased during the period of these observations but a comparison with previous results in Figure 26 shows that this does not repeat each pulsation cycle. As with the earlier measurements of U Ori in Cotton et al. (2004), the ring diameters in Table 2 are comparable to the diameter of the fitted molecular layer size by Perrin et al. (2004).
Figure 30. Selected region of U Ori at ν = 1, J = 1–0 transition of SiO at 43.1 GHz on 2004 November 8 showing a radial jet-like feature. Gray scale is the velocity shown by scale bar at the top; contours are total intensity spaced at powers of 2 from 100 mJy beam−1; vectors give the orientation and relative magnitude of the linear polarization E-vectors. The resolution is shown in the lower right. The stellar center is to the upper right.
Download figure:
Standard image High-resolution image
5. CONCLUSIONS
Multi-epoch observations are presented of the ν = 1 and ν = 2, J = 1–0 masing transitions of SiO at 43.1 and 42.8 GHz in six Mira variables from a sample with evidence for asymmetries in the near-IR. No strong asymmetries are seen in the partial maser rings presented. The rings are only partial due to the requirement that the local conditions allow detectable masers in our direction and their incompleteness does not directly indicate an asymmetry in the underlying gas.
The size of the maser rings observed in χ Cyg and U Ori is similar to the size of the molecular envelope determined by Perrin et al. (2004). This indicates that the masers arise in the molecular layer itself. All maser rings are approximately twice the near-IR uniform disk diameter.
Radial, jet-like features with velocity gradients were seen in a number of stars. In particular, one such feature persisted over the entire cycle observed of R LMi. The velocity gradients were such that the velocity was closest, usually quite close, to systemic furthest from the star and redshifted with respect to systemic closer to the star. The linear polarization of these features showed a variety of configurations with an orientation transverse to the direction of the feature the most common.
The estimated systemic velocity of χ Cyg is 8.9 ± 1.0 km s−1; of R LMi is −0.3 ± 1.0 km s−1, of RU Her is −10.1 ± 1.0 km s−1, and of U Ori is −38.1 ± 1.0 km s−1.
We acknowledge support from NSF of the IOTA observations through grant AST-0456047. The authors thank the anonymous referee for comments leading to an improved paper.
Facilities: VLBA - Very Long Baseline Array
Footnotes
- 9
The VLA is operated by the National Radio Astronomy Observatory, which is a facility of the National Science Foundation, operated under cooperative agreement by Associated Universities, Inc.
- 10
- 11
VLBA is a facility operated by the National Radio Astronomy Observatory.
- 12
- 13