
Abstract
In magnetic resonance guided radiotherapy (MRgRT) radiation dose measurements needs to be performed in the presence of a magnetic field. In this study, the influence of magnetic fields on the readings of a Fricke detector, a chemical dosimeter, have been investigated in 6 MV photon beams. This type of detector has been chosen, as the Federal Office of Metrology (METAS, Switzerland) has great experience with Fricke dosimetry and since it is not expected that this detector is greatly affected by the presence of a magnetic field.
Magnetic fields with field strengths between 0 T and 1.42 T were applied during the detector irradiation. In a 5 × 10 cm2 irradiation field, the Fricke readings are affected less than 0.9% by the applied magnetic fields. Taking the altered dose distribution due to the magnetic field ( ) into account, the magnetic field correction factors (
 ) for the Fricke detector at 0.35 T and 1.42 T are determined to be 0.9948 and 0.9980, respectively. These small corrections hardly exceed the measurement uncertainties. Hence, we could proof that the Fricke detector is not significantly influenced by the presence of a magnetic field.
The Fricke detector was also tested for the feasibility of measuring output factors in the presence of magnetic fields. For irradiation field sizes larger than the detector (>2 × 2 cm2), comparable results were obtained as for other detectors. The output factors decrease when a magnetic field is applied. This effect is more pronounce for larger magnetic field strengths and smaller irradiation fields due to shifts of the depth dose curves and asymmetry of lateral dose profiles.

Original content from this work may be used under the terms of the Creative Commons Attribution 3.0 licence. Any further distribution of this work must maintain attribution to the author(s) and the title of the work, journal citation and DOI.
1. Introduction
In MR-guided radiotherapy (MRgRT) the magnetic resonance (MR)-imaging technique is combined with high-energy photon irradiation to improve the irradiation as the contours of tumors, organs and healthy tissue can be adapted on daily basis or even online and therefore exposure of healthy tissue can be reduced (Lagendijk et al 2014, Schmidt and Payne 2015). The magnetic field changes the dose distribution since the Lorentz force deflects the path of the secondary electrons generated by the photon beam. This leads to shifts in the position of the maximum dose () in depth dose curves, to an asymmetry in lateral dose profiles and at tissue-air boundaries an electron return effect (ERE) occurs (Raaymakers et al 2004, Raaijmakers et al 2007, 2008, Agnew et al 2017, Looe et al 2017, O'Brien et al 2017, Richter et al 2017, Wegener et al 2019). As the magnetic field cannot easily be switched off, the measurement of the radiation dose needs to be performed in the presence of the magnetic field. Therefore, the response of the detector is affected by the magnetic field and it needs to be corrected. For ionization chamber type detectors, as commonly used in reference dosimetry, it was shown that appropriate correction can be achieved by introducing a chamber specific correction factor . This correction factor depends on the photon beam quality (Q), the magnetic field strength (B) and the mutual orientation of the detector and the magnetic field strength (Meijsing et al 2009, Reynolds et al 2013, Smit et al 2013, Spindeldreier et al 2017, van Asselen et al 2018).


Van Asselen et al (2018) proposed a formalism which separates the correction due to the effect of the magnetic field on the dose distribution and the correction due to the effect on the detector response: first, a dose conversion factor is defined as the ratio of the absorbed dose to water in a magnetic field () to the absorbed dose to water in the absence of the magnetic field () at the point of measurement. Second, a conversion factor is defined as the ratio of the reading in the absence of the magnetic field () to the reading in the magnetic field (). In consequence, the magnetic field correction factor can be expressed as:


which is essentially the ratio of chamber responses in a beam of beam quality Q without and with magnetic field. The conversion factors are typically close to 1.0; deviations of 0.75% for 1.42 T in a 6 MV photon beam (Delfs et al 2018) or 0.5% for 1.5 T in a 7 MV beam (O'Brien et al 2016) have been reported. The factors are obtained by Monte Carlo simulations since it is difficult to separate experimentally the change of absorbed dose from the change of detector response in magnetic fields. For an experimental determination of the factors, a detector that is not affected by the presence of a magnetic field would be needed.


A water calorimeter at the Dutch metrology institute (VSL) is currently the only primary standard to measure the absorbed dose to water in magnetic fields () that is directly linked to the international system of units (SI) (de Prez et al 2019a). Recently, de Prez et al (2019b) reported first factors for PTW 30013 and IBA FC65-G ionization chambers that are based on this primary standard. Several and factors were reported that were determined by Monte Carlo calculations or by measurements of detector reading with and without a magnetic field (O'Brien et al 2016, Malkov and Rogers 2018, Pojtinger et al 2018, van Asselen et al 2018, Pojtinger et al 2019).


In this work, we have characterized the Fricke detector, a chemical dosimetry method, for its application in MRgRT. The Fricke detector is closely water equivalent and its response is independent of the irradiation energy for equivalent photon energies >2 MeV. Further, its response does not depend on dose rates up to 106 Gy s−1 (Fricke and Hart 1966, Pettersson and Hettinger 1967, Frankenberg 1969, Shalek and Smith 1969, Klassen et al 1999, Moussous et al 2011). The Fricke dosimetry method can be used as a primary standard for MeV electrons (Feist 1982, McEwen et al 2014) and the Federal Office of Metrology (METAS, Switzerland) has great experience with this application (Stucki et al 2003a, 2003b, Stucki and Vörös 2007, Vörös and Stucki 2007, Vörös et al 2012). Furthermore, Fricke detectors have been used as secondary standards for several different applications in photon and electron beams as well as in x-rays (Nahum and Greening 1978, Kuszpet et al 1982, Feist and Muller 1989, Palm and Mattsson 2002, Austerlitz et al 2006, Moussous et al 2011, deAlmeida et al 2014, Moussous and Medjadj 2016).
The Fricke dosimeter contains ferrous iron (Fe2+) that will be oxidized to ferric iron (Fe3+) upon irradiation. The increase of the Fe3+ concentration is proportionally to the absorbed dose and it is not expected that the chemical reactions are greatly influenced by the magnetic field, making this detector potentially an ideal candidate for MRgRT applications. Here, we have measured the correction factors of the Fricke detector for different magnetic field strengths between 0 T and 1.42 T in a 6 MV photon beam. Additionally, we have tested the feasibility of the Fricke dosimeter for the measurements of output factors.

2. Methods and experimental setup
2.1. Detector preparation
The Fricke detector consists of a perfluoroalkoxy alkane (PFA) sample cup from AHF Analysetechnik filled to the top with Fricke solution (see figure 1). PFA was used as it is resistant against almost all chemical products, and because of its low surface tension, almost nothing adheres to this material. Therefore, the interaction of the Fricke solution with the vessel wall is small, lowering the self-oxidation processes of the Fricke solution. The sample cup has a diameter of 11.85 mm, a height of 36 mm and a wall thickness of approximately 0.21 mm. The sample cup is mounted on a holder during the irradiation as shown in figure 1(b).

Figure 1. Fricke detector. (a) Sample cup filled with Fricke solution and (b) sample cup mounted in the holder for irradiation.
Download figure:
Standard image High-resolution imageFor the preparation of the Fricke solution, 112 ml concentrated sulfuric acid (96%, suprapur) was diluted in a 5 l volumetric flask to 0.4 mol l−1 using ultrapure water from a Milli-Q Advantage A10 system. The concentration of the solution was verified by titration of 1 mol l−1 NaOH. To eliminate non-linearity effects in the dose response curve, two drops of H2O2 (4%, suprapur) were added and neutralized with KMnO4 solution (1%, pro analysis) as described in Davies and Law (1963). The Fricke solution was then prepared with 1 mmol l−1 ammonium iron(II) sulfate (NH4)Fe(II)(SO4)2·6H2O (pro analysis), 1 mmol l−1 NaCl (suprapur) and 0.4 mol l−1 sulfuric acid.
The Fricke solution was prepared freshly on the first measurement day and was used during the next 1–2 weeks. The solution was stored in PFA bottles (1 l) that were covered with aluminum foil to protect the solution from light and to lower the self-oxidation processes (ISO 51026 2015). The Fricke solution was transferred to two sample cups shortly before the photon irradiation (see section 2.3) using a PFA wash bottle that was filled each day with the stored solution. It was taken care that no air bubbles were inside the sample cup. One of the two sample cups was irradiated; the other one was kept near the UV-spectrophotometer at 20 °C and was used as control.
2.2. Detector readout
Details about the working principle of the Fricke detector can be found in e.g. Fricke and Hart (1966). Here, only the details are discussed, that are relevant for this study. The absorbed dose to the Fricke solution () was determined as described in ISO 51026 (2015) using the following equation:


where is the absorbance change of the Fricke solution upon irradiation, is the density of the Fricke solution, is the path length through the photometric cell, is the molar extinction coefficient of Fe3+ and is the radiation chemical yield. was determined with a Cary 6000i UV-spectrophotometer (Varian) at a wavelength of 304 nm, with a spectral bandwidth of 1.5 nm. The determined absorbance values are an average over 2 min. The used quartz photometric cell had a path length of 0.9986 ± 0.0005 cm, as calibrated by METAS. The molar extinction coefficient () and the radiation chemical yield () are given in the ICRU Report 90 (2014) as a combined value of = 3.525 cm2 J−1. However, as only relative measurements were performed where detector readings in an applied magnetic field were compared to readings without a magnetic field, the absolute value of is not needed since it is the same for all measurements.


The temperature in the photometric cell was held constant at the reference temperature of 25 °C using a thermostat (Lauda Eco 420). The temperature during each irradiation was recorded and all values were corrected to the reference temperature of 25 °C () using the correction given by DIN 6800-3 (1980), which we have experimentally verified.


To obtain the absorbed dose to water (), correction factors have to be applied to , as described e.g. in deAlmeida et al (2014). These corrections include a dose conversion from the Fricke solution to water and a correction for the vessel wall. Since they are not influenced by the magnetic field and since only relative measurements were performed, these corrections were not applied in this study.


The photometric cells were filled with a Pasteur pipette and emptied with a suction tube. Before each absorbance measurement, the photometric cell was rinsed with solution at least 2 times. For each sample, a new Pasteur pipette was used which has been cleaned with chrome sulfuric acid and ultrapure water. To compensate absorbance effects of the sulfuric acid and the photometric cells in the probe and reference beams of the spectrophotometer, a solution with the same composition as the Fricke solution but without any iron (basic solution) was filled into both photometric cells and the absorbance was measured at the beginning of each measurement day. This absorbance value was stored in the spectrophotometer application and subtracted from all subsequent measurements. By measuring the absorbance of the basic solution periodically during the day, the absorbance drift of the spectrometer was determined. However, no correction for this drift was applied as the absorbance of the unirradiated sample and of the irradiated sample were measured only 10 min apart and the drift was negligible. The absorbance measurements were performed typically 5–10 min but never longer than 1.5 h after the irradiation in order to keep the self-oxidation of the solution as low as possible.
2.3. Irradiation setup
The irradiation was performed at the experimental facilities of the German metrology institute Physikalisch-Technische Bundesanstalt (PTB) in Brunswick. Recently, the irradiation setup was described by Schüller et al (2019). The irradiations were performed in a 6 MV photon beam of a linear accelerator (Elekta Precise Treatment System) using a dose rate of 2–3 Gy min−1 and a pulse repetition frequency of 400 Hz. A magnetic field was generated between the pole shoes of a constant-current driven electromagnet (Bruker ER0173W), which was homogeneous within 1 µT over 1 cm3 region up to 1.42 T (Delfs et al 2018). The photon beam (directed in ) and the magnetic field (directed in ) crossed orthogonally in the water phantom, as shown in figure 2. The freshly prepared Fricke detectors (see section 2.1) were placed at 10 cm water equivalent depth inside a water phantom with dimensions 7 cm () × 21 cm () × 21 cm ().


Figure 2. (a) Overview photo of the irradiation setup. (b) Photo of the 7 cm wide water phantom placed between the pole shoes of the electromagnet. The direction of the magnetic field (x-axis) and of the photon beam (z-axis) are illustrated. (c) Schematic drawing (not to scale) of the irradiation setup shown in (a). (d) Schematic drawing of the setup with view from the top.
Download figure:
Standard image High-resolution imageDose response curves (see section 3.1) were recorded in the presence of magnetic field strengths (B) of 0 T, 0.6 T and 1.2 T by irradiating the Fricke detectors in a 6 MV photon beam (5 × 10 cm2) with approximately 1070 monitor units (MU) (≈6 Gy), 7100 MU (≈40 Gy), and 17 800 MU (≈100 Gy). For the determination of and the output factors (see sections 3.2 and 3.3), the Fricke detectors were irradiated with approximately 7100 MU using different magnetic field strengths (0 T–1.42 T) and different radiation field sizes (3 × 3 cm2–5 × 10 cm2). The same number of monitor units were used for irradiation with the magnetic field switched on as for the irradiations without magnetic field. The independence of the internal monitor readings from the magnetic field has been confirmed within 0.15% (Delfs et al 2018). For the determination of the absorbed dose to water ( and ), the monitor of the accelerator was calibrated at B = 0 T in a photon-beam size of 5 × 10 cm2, using an ionization chamber (IBA FC65-G or PTW 30013) with the appropriate correction factors for temperature, pressure, saturation and beam quality (Andreo et al 2006; DIN6800-2, 2008). Afterwards, the monitor readings at B = 0 T in a photon-beam size of 5 × 10 cm2 were checked periodically each morning, noon and evening by comparing the monitor units with measured with the ionization chamber. A linear correction for the drift of the monitor readings was assumed.


For each setting, 3–4 Fricke detectors were irradiated and evaluated. Since the delivered absorbed dose to water changed slightly from irradiation to irradiation, the detector readings (see section 2.2) were normalized with the average value of so that the mean value of the detector readings for each setting could be determined.

3. Results
3.1. Linearity of the response
In figure 3(a) the Fricke readings () versus the absorbed dose to water () for a 6 MV photon beam applying magnetic field strengths of 0 T, 0.6 T and 1.2 T are shown. The points correspond to the average value of 3–4 measurements. The experimental standard deviation of each is approximately 0.3%. All dose response curves are linear with a slope () of about 0.00 356 Gy−1, with a correlation coefficient of 1.000 00. In figure 3(b) the deviation of the measured values from the fitted slope are shown. The deviation is smaller than 0.4% for all data points, hardly exceeding the measurement uncertainties.


Figure 3. (a) Fricke detector calibration curve for 6 MV photons in a 5 × 10 cm2 irradiation field applying magnetic field strengths of 0 T (blue), 0.6 T (red) and 1.2 T (green). Each symbol corresponds to an average value of 3–4 measurements. (b) Deviation of the measured values from the fitted line.
Download figure:
Standard image High-resolution image3.2. kB,M,Q factors
Following the notation of van Asselen et al (2018), is defined as the ratio of the detector readings without a magnetic field () to the readings in the magnetic field (), see equation (1). For the Fricke detector, the readings correspond to the absorbance change () upon irradiation. As described in section 2.2, the influence of the irradiation and readout temperatures on the Fricke readings were corrected.


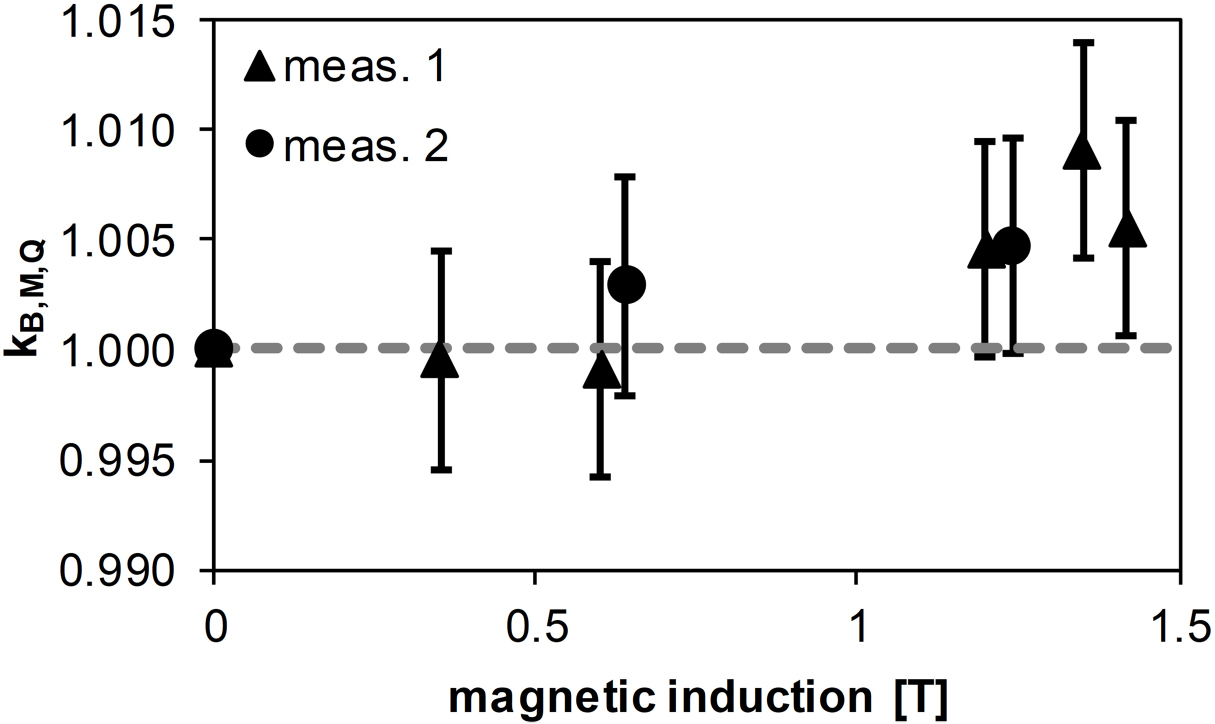
Figure 4 shows the determined factors for the Fricke detector measured in a 5 × 10 cm2 6 MV photon beam. The measurements for B = 0.6 T and 1.2 T have been repeated several months later to verify the reproducibility of the results, which is discussed in section 4.1. The error bars correspond to the relative combined standard uncertainty (k = 1), see table 1.

Table 1. Relative standard uncertainties for the calculation of ().


| Quantity | |
|---|---|
| Fricke readings without magnetic field | |
| Monitor calibration | 0.317% |
| Stability of monitor calibration over a day | 0.058% |
| Stability of spectrophotometer over 10 min |
0.013% |
| Repeatability of absorbance |
0.070% |
| Solution temperature during detector readout | 0.014% |
| Change of temperature during irradiation | 0.015% |
| Positioning of detector (depth in water) | 0.039% |
| Fricke readings with magnetic field | |
| Monitor calibration | 0.317% |
| Stability of monitor calibration over a day | 0.058% |
| Independence of monitor from B-field |
0.150% |
| Stability of spectrophotometer over 10 min |
0.013% |
| Repeatability of absorbance |
0.070% |
| Solution temperature during detector readout | 0.014% |
| Change of temperature during irradiation | 0.015% |
| Positioning of detector (depth in water) | 0.039% |
| Relative combined standard uncertainty | 0.494% |
| Expanded relative uncertainty | 0.977% |


aThe relative uncertainty was determined for typically measured values. bSee Delfs et al (2018).

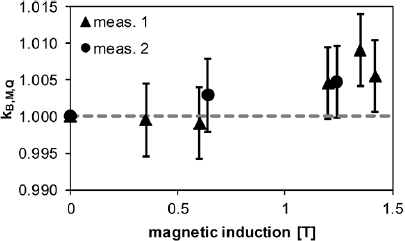
Figure 4. kB,M,Q factors measured in a 6 MV photon beam (5 × 10 cm2) by applying different magnetic field strengths. Two sets of measurements are shown which were recorded several months apart. The magnetic induction of measurement set 2 (•) are offset from set 1 (▴) to show the data more clearly. The error bars correspond to the relative combined standard uncertainty (k = 1), see table 1.
Download figure:
Standard image High-resolution image3.3. Output factors
The output factor is defined as the ratio of the dose at the position P in a phantom for a field size A, to the dose at the same position P in a 10 × 10 cm2 reference field (Podgorsak 2005). The largest possible field in our experimental setup was only 5 × 10 cm2 due to the limited spacing between the magnet poles. Hence, the output factors for the Fricke detector are normalized to this field size. Typically, the output factors are shown as a function of equivalent square fields with the assumption that the output for rectangular fields is equal to the output for the equivalent square field. The rectangular fields with sides a and b were recalculated to a square field with sides using Day's rule (Podgorsak 2005).

Figure 5 shows the output factors for the Fricke detector in the presence of different magnetic fields. Note that for the 4 × 10 cm2, 3 × 10 cm2 and 2 × 10 cm2 fields only B = 0 T and B = 1.42 T were applied, whereas for the other fields also B = 0.35 T, B = 0.6 T and B = 1.2 T were applied. Only small changes of the output factors due to the magnetic fields are observed for fields >2 × 2 cm2 (<1%), see figure 6. Here, all output factors are smaller in the presence of a magnetic field compared to the measurements without an applied magnetic field.

Figure 5. Output factors measured with the Fricke detector in the presence of different magnetic field strengths.
Download figure:
Standard image High-resolution image
Figure 6. Dependence of the output factors (signal relative to the 5 × 10 cm2 field) on the magnetic field strengths for irradiation field sizes >2 × 2 cm2.
Download figure:
Standard image High-resolution image4. Discussion
4.1. Reproducibility and dose response linearity of the Fricke detector
The experimental standard deviation of for measurements without an applied magnetic field in a 5 × 10 cm2 irradiation beam is approximately 0.3% in the range of absorbed dose to water between 6 Gy to 100 Gy, see table 2, which is in the same magnitude as reported by Moussous et al (2011) for their measurements between 5 Gy and 25 Gy. In table 2 also the experimental standard deviation of measured in the presence of different magnetic field strengths are shown. They are with up to 0.5% slightly higher than for B = 0 T. The different magnetic field strengths were not always applied in the same sequence and dependent on that sequence slightly different values were measured. The largest changes were observed when B = 1.42 T was applied directly after B = 0 T. It seemed that the monitor of the accelerator, which was used as reference, was slightly influenced by the magnetic field dependent on the sequence of the applied magnetic field strengths.


Table 2. Reproducibility of the Fricke detectors for measurements without an applied magnetic field and for = 39.89 Gy applying different magnetic field strengths (B).

| Dose [Gy] | Mean |
SD |
|---|---|---|
| 6.03 | 0.021 52 | 0.20% |
| 40.08 | 0.142 74 | 0.32% |
| 99.92 | 0.355 99 | 0.33% |
| B-field [T] | Mean |
SD |
| 0 | 0.141 80 | 0.34% |
| 0.35 | 0.141 86 | 0.15% |
| 0.6 | 0.141 92 | 0.49% |
| 1.2 | 0.141 16 | 0.35% |
| 1.42 | 0.141 02 | 0.49% |
aMean value of 3–4 readings of . bExperimental standard deviation of .


Measurements of kB,M,Q factors were performed several months apart. They agree within 0.5%, see the two measurement sets in figure 4.
Figure 3 demonstrates that the Fricke detector has a linear dose response between 6 Gy and 100 Gy. The linearity is not affected by the presence of a magnetic field. The measured dose response curves with a slope of approximately 0.003 56 Gy−1 are comparable with the results Moussous et al (2011) obtained for 6 MV photon beams (0.0036 Gy−1), although they used glass-walled bottle-shaped ampoules while we used PFA sample cups. For both measurements, it was assumed that the detectors are water equivalent and no corrections for the different materials were applied to convert DF into DW.
Although only relative measurements were performed in this study where Fricke readings with and without the presence of a magnetic field were compared, the plausibility of our Fricke measurements for B = 0 T was verified by determining and comparing it to the literature. The slope of the dose response curve for B = 0 T was converted to , see equation (2), using the density of the Fricke solution ρ and the path length through the photometric cell l. A value of = 3.491 cm2 J−1 is obtained, which is 1% lower than the value recommended in the ICRU report 90 (2014) for 6–15 MeV electron beams. According to this reference, decreases for smaller beam energies, e.g. is 0.7% smaller for 60Co beams. As the corrections to convert DF into DW were not applied in this study, a deviation from the recommended value is expected. For pyrex glass vials, a material which has approximately the same density as the used PFA, a correction of 0.62% for 6 MV beams is predicted (Ma et al 1993). Hence, the predicted correction is close to the observed deviation of 1%. Note that for the determination of kB,M,Q and output factors, the ratio of two Fricke readings is calculated and therefore possible deviations cancel out.


4.2. kB,M,Q and kB,Q factors
Table 3 summarizes the kB,M,Q factors measured in a 5 × 10 cm2 6 MV photon beam (see also figure 4). The change induced by the magnetic field on the Fricke readings slightly increases with the magnetic field strength, but it is smaller than 0.95% for all measurements. This increase is expected, as the altered dose distribution, which is corrected with the dose conversion factor cB, is more influence by larger magnetic field strengths (Delfs et al 2018). cB factors for 0.35 T and 1.42 T, calculated for the same setup as used in this work, were published to be 0.47% and 0.75%, respectively (Delfs et al 2018). As shown in equation (1), kB,Q is obtained by multiplying cB with kB,M,Q. The kB,Q factors for the Fricke detector are listed in table 3. The correction due to the magnetic field is 0.52% and 0.20% for 0.35 T and 1.42 T, respectively. The measurement uncertainty of the kB,M,Q factors are in the same magnitude, see table 1. Hence, no significant change of the Fricke response due to the magnetic field could be observed.
Table 3. kB,M,Q and kB,Q factors measured with the Fricke detector in a 5 × 10 cm2 photon beam (6 MV).
| B-field [T] | kB,M,Q | kB,Q |
|---|---|---|
| 0.35 | 0.9995 | 0.9948 |
| 0.6 | 0.9991 | |
| 1.2 | 1.0045 | |
| 1.35 | 1.0091 | |
| 1.42 | 1.0055 | 0.9980 |
4.3. Influence of magnetic field on Fricke output factors
Moussous and Medjadj (2016) have shown that output factors measured with Fricke detectors for field sizes between 5 × 5 cm2 and 20 × 20 cm2 in a 60Co beam agree within 0.5% with ionization chamber measurements (WDIC70#141), when no magnetic field is applied. Here, we have measured output factors in the presence of magnetic field strengths between 0 T and 1.42 T using Fricke detectors. As shown in figure 6, the output factors decrease slightly in the presence of a magnetic field for irradiation beam sizes >2 × 2 cm2. This was expected since we have measured all output factors at the same position although the presence of magnetic fields shift the depth dose profiles. Additionally, the applied magnetic field leads to a skew of the lateral beam profiles. Both effects will decrease the local dose at the measured position. It is expected that for smaller irradiation field sizes, larger changes in the output factors will occur since the asymmetry of the lateral dose profiles will be more pronounced (O'Brien et al 2017). This was indeed observed with the Fricke detectors. As shown in figure 6, the changes for the 3 × 3 cm2 field are larger than for the 5 × 5 cm2 field.
The agreement of the Fricke output factors at 0 T with microDiamond (PTW 60019), diode (PTW 600012) or Semiflex 3D (PTW 31021) measurements is within 0.7% for field sizes ⩾4 × 4 cm2. By comparing the Fricke results for 1.42 T with the microDiamond, diode and Semiflex 3D results for 1.5 T, the same findings as for 0 T were observed.
5. Conclusions
The linearity of the Fricke response curves between 6 Gy and 100 Gy is not influenced by an applied magnetic field during the irradiation with a 6 MV photon beam. The slope of these response curves are with about 0.003 56 Gy−1 comparable with previously published values (Moussous et al 2011, ICRU 2014, ISO 2015). The difference of approximately 1% is explainable with the fact that no correction for the conversion from DF to DW was applied in this work. For measurements of kB,M,Q and the output factors, this correction was not needed as they are the same for all measurements and therefore cancel out for theses relative measurements.
The experimental standard deviation is approximately 0.3% for measurements without an applied magnetic field and increases slightly to 0.5% in the presence of a magnetic field. Measurements performed several months apart, agree within 0.5% with each other.
By irradiating Fricke detectors with 7100 MU in magnetic fields with different field strengths (0–1.42 T), kB,M,Q factors were determined. The Fricke readings change less than 0.95% for all applied magnetic field strengths in the 5 × 10 cm2 irradiation field. Using the published cB dose conversion factors for 0.35 T and 1.42 T (Delfs et al 2018), the magnetic field correction factors kB,Q of 0.9948 and 0.9980 were obtained for the Fricke detector. Since the corrections are in the same magnitude as the measurement uncertainty, it can be assumed that the detectors are not significantly influenced by the presence of a magnetic field.
Output factors were determined with the Fricke detector at a water depth of 5 cm. The measured output factors agree within 0.7% with microDiamond, diode and Semeflex 3D results for irradiation field sizes ⩾4 × 4 cm2. The measurements in the presence of different magnetic field strengths showed that the output factors decrease with the applied magnetic field strengths. This decrease is more pronounced for smaller field sizes, due to shifts of the depth dose curves and asymmetry of lateral dose profiles.
Acknowledgments
This work was funded by EURAMET through EMPIR Grant No. 15HLT08 MRgRT.