
Abstract
Proton range monitoring may facilitate online adaptive proton therapy and improve treatment outcomes. Imaging of proton-induced prompt gamma (PG) rays using a knife-edge slit collimator is currently under investigation as a potential tool for real-time proton range monitoring. A major challenge in collimated PG imaging is the suppression of neutron-induced background counts. In this work, we present an initial performance test of two knife-edge slit camera prototypes based on arrays of digital photon counters (DPCs). PG profiles emitted from a PMMA target upon irradiation with a 160 MeV proton pencil beams (about 6.5 × 10⁹ protons delivered in total) were measured using detector modules equipped with four DPC arrays coupled to BGO or LYSO : Ce crystal matrices. The knife-edge slit collimator and detector module were placed at 15 cm and 30 cm from the beam axis, respectively, in all cases. The use of LYSO : Ce enabled time-of-flight (TOF) rejection of background events, by synchronizing the DPC readout electronics with the 106 MHz radiofrequency signal of the cyclotron. The signal-to-background (S/B) ratio of 1.6 obtained with a 1.5 ns TOF window and a 3 MeV–7 MeV energy window was about 3 times higher than that obtained with the same detector module without TOF discrimination and 2 times higher than the S/B ratio obtained with the BGO module. Even 1 mm shifts of the Bragg peak position translated into clear and consistent shifts of the PG profile if TOF discrimination was applied, for a total number of protons as low as about 6.5 × 10⁸ and a detector surface of 6.6 cm × 6.6 cm.
Export citation and abstract BibTeX RIS

Content from this work may be used under the terms of the Creative Commons Attribution 3.0 licence. Any further distribution of this work must maintain attribution to the author(s) and the title of the work, journal citation and DOI.
1. Introduction
Real-time particle range monitoring may facilitate online-adaptive particle therapy and improve treatment outcomes. Imaging of the prompt gamma (PG) rays emitted during proton irradiation has been suggested as a tool for range monitoring (Stichelbaut and Jongen 2003). Different PG imaging detectors are currently being investigated, including Compton cameras (Kang and Kim 2009, Richard et al 2009, 2011, Peterson et al 2010, Kormoll et al 2011) and various types of mechanically collimated cameras (Min et al 2010, 2012, Testa et al 2009, Testa et al 2010, Bom et al 2012, Cambraia Lopes et al 2012, Smeets et al 2012, Gueth et al 2013, Roellinghoff et al 2014). The present work is focused on collimation with a knife-edge slit, as described by Smeets et al (2012).
A major challenge in PG imaging is the suppression of background counts. Neutrons promptly emitted during proton irradiation give rise to uncorrelated events that degrade the signal-to-background ratio of the PG image. Even though scintillators exist that are relatively insensitive to neutrons, secondary gamma rays are often detected, which result from interactions of the neutrons with materials in the environment, the collimator especially, which is typically made from a dense material such as tungsten or lead.
Whereas neutron shielding is complicated by a number of technical and practical difficulties, previous studies have shown that time-of-flight (TOF) selection may efficiently reduce the neutron-induced gamma background in collimated cameras (Testa et al 2009, Testa et al 2010, Biegun et al 2012, Cambraia Lopes et al 2012, Roellinghoff et al 2014), provided that the proton-beam microstructure is favorable. That is, the proton bunch width should be sufficiently narrow and the bunch repetition rate sufficiently low, which tends to be the case for typical cyclotron-delivered proton beams. In addition, energy discrimination has experimentally been shown to successfully reject background events and increase the signal-to-noise ratio SNR (Min et al 2006, Smeets et al 2012). It is therefore important that PG detectors offer a large enough dynamic range to enable appropriate energy selection.
Here we present an initial performance test of two gamma camera prototypes based on digital photon counter (DPC) arrays. The DPC is an implementation of the silicon photomultiplier (dSiPM) introduced by philips digital photon counting (PDPC) (Degenhardt et al 2009, Frach et al 2009, 2010). This photosensor technology has been developed into a modular design that can be used for diverse applications in medical imaging (Degenhardt et al 2012, Haemisch et al 2012). DPC arrays are rugged, compact, magnetic field insensitive, and exhibit low susceptibility to electronic noise, which makes them appealing for proton therapy monitoring. Furthermore, their good timing properties open up the possibility for TOF selection. We compare the performance of detector modules equipped with 4 DPC arrays coupled to either BGO or LYSO : Ce scintillator matrices in a prototype prompt gamma camera utilizing a knife-edge slit collimator. For the LYSO : Ce camera, profiles measured with and without TOF selection are evaluated.
2. Methods and materials
A knife-edge slit collimator was used to project prompt-gamma rays emitted from a phantom onto two prototype gamma cameras (section 2.1.1). The gamma cameras consisted of BGO or LYSO : Ce crystal matrices coupled to DPC arrays (section 2.1.2). The operating settings of the detectors were optimized and, in the case of the LYSO : Ce detector, time-of-flight (TOF) background discrimination was tested (section 2.1.3). Detector calibration and signal processing were performed offline (section 2.2). Finally, the measured prompt-gamma profiles were compared with MCNPX simulations (section 2.3).
2.1. Experimental
2.1.1. Measurement setup.
The experimental set-up is similar to the one described by Smeets et al (2012). A schematic representation of the setup is shown in figure 1-left. Figure 1-right shows a photograph of the actual setup installed in the gantry of treatment room 2 of the West German Proton Therapy Centre Essen (WPE), where all proton irradiations were performed. The LYSO : Ce and BGO detectors were mounted on a breadboard, at opposite sides of a cylindrical polymethylmethacrylate (PMMA) phantom. The knife-edge slit collimator was placed on a PMMA support rail in between the LYSO : Ce detector and the phantom. The PMMA phantom had dimensions of Ø15 cm × 20 cm and was irradiated with an 160 MeV proton pencil-beam. The Bragg peak position, defined as the distal position at which the depth-dose profile has reduced to 80% of the maximum height, was located at a depth of 15.2 cm into the phantom.

Figure 1. Schematic overview of the experimental setup (left) and photograph of the actual setup (right). Left: the detector center is aligned with the center of the slit and the Bragg-peak position. Right: the LYSO : Ce and BGO detectors are mounted on the breadboard; the collimator is placed in between the phantom and the LYSO : Ce detector on a PMMA support rail.
Download figure:
Standard image High-resolution imageThe knife-edge slit collimator was made of a tungsten alloy with a density of 16.96 g cm−3. It had a thickness of 4 cm and a slit opening of 6 mm. The collimator was placed midway between the phantom axis and the mid-plane of the crystal matrix (figure 1-left), so as to project an inverse image of the prompt-gamma emission profile onto the detector with a magnification factor of 1. The distance between the beam axis (coinciding with the phantom axis) and the mid-plane of the scintillator matrix was 30 cm. The center of the slit was aligned with the expected Bragg peak position, as well as with the center of the detector. Additional measurements were made with the detector shifted by ±3.35 cm in parallel with the beam axis (corresponding to an overlap of 8 crystals), so as to enlarge the total field-of-view (FOV) to about 13.5 cm, still centered at the Bragg-peak position. In addition to the measurements performed with the knife-edge slit collimator, measurements were also done using a completely closed collimator (i.e. a tungsten slab with a uniform thickness of 4 cm), as well as without any collimator, for characterization purposes.
All acquisitions were done with a beam current at nozzle exit of about 10 pA or 6.24 × 10⁷ protons s−1. In most measurements, the administered dose was about 10 Gy per measurement, corresponding to about 6.5 × 10⁹ protons delivered in total. A few measurements used for timing calibrations were acquired with a 5-times higher dose, using the same beam current. It is noted that this beam current is lower than those typically used in clinical treatments, which are of the order of 1 nA. The DPC data acquisition electronics used in the present measurements (section 2.1.2) is part of a technology demonstrator kit that is not designed for high count rates. In particular, it makes use of a USB 2.0 connection to the readout computer, which forms a bandwidth bottleneck. A higher-bandwidth connection would be required to obtain sufficient system bandwidth for clinical use of a DPC-based prompt gamma camera. The DPC detector is in principle capable of processing a much higher count rate than in the current experiment (section 2.1.3).
2.1.2. Detector description.
The detectors were based on DPC modules manufactured by PDPC (DPC-MO-22–3200). Each DPC module has a total surface area of 68 mm × 68 mm and contains 2 × 2 DPC arrays (DPC3200-22–44). Each of the 4 DPC arrays measures 32 mm × 32 mm and comprises 8 × 8 DPC pixels at a pitch of 4 mm, each DPC pixel consisting of 3200 single-photon avalanche diodes (SPADs) or microcells (Frach et al 2009). A DPC array is assembled from 4 × 4 independent DPC-chips, each chip containing 2 × 2 pixels. It is equipped with readout electronics and a pair of 9-bit time-to-digital converters (TDCs). After light detection and readout, the DPC-chip outputs the total number of fired cells on each of its 4 pixels, as well as a single time stamp. One of the modules was equipped with a matrix of 256 LYSO : Ce (Lu1.8Y0.2SiO5(Ce)) crystals, each crystal having dimensions of 3.8 mm × 3.8 mm × 22 mm. The other detector had a matrix of 256 BGO (Bi4Ge3O12) crystals of 3.8 mm × 3.8 mm × 20.5 mm each. The coupling between DPC-pixels and crystals was 1-to-1 in both cases. Each BGO crystal was optically isolated, whereas light sharing was allowed between each group of 4 LYSO : Ce crystals coupled to a same DPC-chip, so as to minimize saturation of the DPC-pixels. The detector modules were cooled by Peltier elements and attached to a heat exchange plate internally flushed with running tap water. The modules were enclosed in a light-tight and moisture-free box that was continuously flushed with dry nitrogen gas. The temperature of operation of the DPC arrays was −15 °C.
The LYSO : Ce and BGO crystal matrices have comparable (i.e. within 4% variation) total attenuation cross sections for photons between 1 MeV and 10 MeV (Berger and Hubbell 2010). Given the higher light output and lower decay time of LYSO : Ce (41 ns versus 300 ns for BGO), the LYSO : Ce detector was used for the time-of-flight (TOF) measurements. Due to technical reasons, one DPC array of the BGO detector was not operational.
2.1.3. Data acquisition settings.
Data acquisition with DPCs is regulated by a programmable trigger and validation logic (Frach et al 2009, 2010). The trigger logic is implemented on pixel level, and the trigger threshold is defined as the number of sub-pixels (one-fourth of a pixel) that must be fired to create a time stamp. Triggering on the 1st or 2nd fired sub-pixel is best suited for fast timing applications. We used the 2nd sub-pixel threshold in all of the measurements performed in this work.
Upon triggering, the DPC-chip enters into the validation phase, i.e. it keeps counting during a certain validation interval, to check whether it reaches a given validation threshold. Upon validation, the DPC-chip continues acquiring for an additional time, the integration interval, after which it is read out and recharged/reset. If the validation threshold is not met, the integration and readout phases are skipped. Therefore, the optimum trigger and validation settings depend on the application, measurement conditions, and crystal type, size, and coupling. The settings should reduce the dead-time due to system readout and/or resets of dark count-induced triggers, while maximizing the detection efficiency at the same time.
In the present work, the validation interval was set to 40 ns for the measurements with BGO, and to 10 ns for the LYSO : Ce measurements without RF synchronization. The validation threshold was set to a 2-OR validation pattern for the BGO measurements, and an 8-OR validation pattern for the LYSO : Ce measurements. This validation conditions only need to be satisfied by one sub-pixel (the four subpixels are connected through a logical OR), while each sub-pixel is subdivided into 8 logical validation regions. A 2-OR validation scheme requires that 2 mutually exclusive groups of 4 validation regions each have at least one fired microcell, whereas the 8-OR scheme requires one fired microcell per validation region (Tabacchini et al 2014). The expected number of fired cells on a pixel at the time of validation is 5.3 ± 2.5 for the 2-OR validation pattern and 59 ± 17 for the 8-OR validation pattern (Tabacchini et al 2014). Thus, stricter validation settings were used for LYSO : Ce than for BGO since LYSO : Ce has a higher light yield and a faster decay time. A higher validation threshold could, however, be used with the BGO detector, without compromising the detection efficiency. The integration times used in our measurements were 1285 ns for BGO and 165 ns for LYSO : Ce without RF synchronization, so as to accumulate counts during approximately 4 decay time constants in each case. Finally, DPC saturation was reduced in the measurements with LYSO : Ce by using the lowest available excess voltage, viz. 2.2 V above tile breakdown voltage, whereas for BGO a typical excess voltage of 2.9 V was used.
For the measurements with TOF discrimination, the acquisition electronics of the LYSO : Ce detector module were synchronized with the cyclotron RF. This was done by converting the 106 MHz RF wave into a clock signal, which was then used as a reference clock by the acquisition electronics, instead of the 200 MHz internal DPC clock. In this way, the registration time of each event relative to the phase of the RF cycle could be obtained from the TDCs in the DPC-chip. The acquisition time settings used in this case were different from the ones used in the previous measurements, as the acquisition times are integer multiples of the reference clock. Specifically, the validation interval used in the experiments with RF synchronization was 18.9 ns and the integration interval was 160.4 ns. (As a result, the total measurement time changed by less than one percent.)
Finally, the DPCs were operated at a constant temperature (−15 °C, see section 2.1.2) to maintain stable detection efficiency throughout all measurements. Cooling reduces the dark-count rate and, therefore, the dead-time induced by triggers originating from dark counts. The dark-count rate was further reduced by switching off the 5% (160) cells with the highest dark-count rate (Frach et al 2009). The remaining average dark-count rate was about 50 s−1 per cell, measured with the BGO crystals coupled to the sensor tiles. It is noted that the temperature of operation was simply set as low as practically achievable; in this initial study we did not yet study or optimize the detector performance as a function of the operating temperature.
The average count rate obtained per DPC-chip was 0.88 kcps for LYSO : Ce and 0.42 kcps for BGO, in terms of overall validated events, as energy and time-of-flight selection was applied offline. In the case of LYSO : Ce, the chip count rate within the acceptance time-of-flight window (see section 2.2.2) was 0.25 kcps. The total trigger rate (validated and non-validated triggers) was 0.22 Mcps for both detectors, mainly due to dark counts.
The maximum (validated) event rate that the DPC-chips can process is 1.3 Mcps when operated at a 200 MHz clock, which scales with the clock frequency. However, the bandwidth of the DPC-sensor is artificially limited by the event storage available on the tile FPGA. Currently, the sensor can handle a maximum of about 120 kcps per chip when operating at the default 200 MHz clock frequency. Therefore, these detectors may be capable of acquiring an eventual 100 times higher validated-event count rate, which could be expected at a clinical beam current of 1 nA, provided that there are no bandwidth limitations on the interface between the acquisition electronics and the readout computer. With the present implementation, using the 106 MHz external clock for TOF discrimination, the bandwidth was reduced to about half of the 120 kcps per chip, due to the longer clock cycles. A possible way to increase the sensor bandwidth while ensuring synchronization to the cyclotron RF, would be to operate the sensors with a frequency double of that coming from the external clock. This would likely reduce the chip dead time and would increase FPGA bandwidth, eventually enabling to measure using typical clinical beam currents and cyclotron RF, with TOF discrimination.
2.2. Offline data processing
Each DPC-chip functions as an independent channel that processes an event and outputs the number of fired cells (hits) in each of its four DPC-pixels together with a single time-stamp. The data processing chain therefore consisted of the following steps: (1) saturation/crosstalk correction of the pixel hits; (2) energy conversion on a per-pixel basis; and, unless specified otherwise, (3) clustering of multiple-DPC-chip events, using a paralyzable 'coincidence window' that acts on the level of the detector. These steps are detailed in section 2.2.1. After these processing steps, an energy selection criterion was applied to the registered events. If time-of-flight (TOF) discrimination was used, the acceptance time window was applied to the time-stamps before step (1), for reasons of efficiency. This requires calibration of the time stamps as explained in section 2.2.2.
After the processing of all events, a density map of crystal (pixel) counts was generated. 1D PG profiles were subsequently obtained by summing the counts in each column of 16 crystals aligned parallel to the knife-edge slit. In the case of the BGO detector, only half of the crystals corresponding to the upper part of the detector were used to derive the 1D-profiles, since one of its DPC arrays was not functioning. The measured profiles presented in this work were subject to cluster processing, except for those presented in section 3.2.1. That is, for each event, the DPC-chip that registered the highest energy deposition was selected and the event was subsequently assigned to one of the corresponding 4 crystals according to the 'winner-takes-all' method (see section 2.2.1).
2.2.1. Energy calibration and event clustering.
Energy calibration was performed by measuring specific gamma lines from the following radioactive sources: 137Cs (661.7 keV), 60Co (1173 keV; 1333 keV), 22Na (511 keV; 1275 keV), and 24Na (1369 keV; 2754 keV; sum peak 4123 keV). The calibration was done on a per-pixel basis so as to normalize the response for each crystal. However, the counts were summed over each DPC-chip, since event acquisition is performed on a per- DPC-chip basis and since inter-crystal light sharing occurs within each DPC-chip, especially in the LYSO : Ce detector. Pixel assignment was done using the 'winner-takes-all' method, i.e. by selecting the brightest pixel within the DPC-chip.
Prior to energy calibration we corrected the measured number of fired microcells per pixel for saturation to improve linearity. Saturation occurs due to the limited number of available cells, each of which can detect only one photon per scintillation event. A correction was implemented using the 'simple model' proposed by van Dam et al (2012), which takes into account optical crosstalk (Frach et al 2009) as well as dark count contributions over the total acquisition time. In the present case, we used a total crosstalk probability of 0.16, in accordance with Tabacchini et al (2014).
Upon saturation correction the LYSO : Ce detector presented good proportionality up to 1333 keV. In first instance we therefore used a linear energy calibration obtained from fitting the 22Na and 60Co peak positions, such that the ratios of saturation-corrected photon counts to energy equaled 4.3 ± 0.4 keV−1 (mean ± standard deviation). With this calibration, which normalized the response of each crystal, the peak positions up to 4123 keV (24Na sum peak) were re-calculated (energyextrapolated) from the global spectra, i.e. the spectra obtained from all detector pixels. We thus derived a DPC-chip/pixel-independent energy correction function for the LYSO : Ce detector, by fitting a second-order polynomial to the true energy values, E, as a function of the extrapolated energy peak values, Eextrap. These values (E, Eextrap) and the energy correction curves are presented in figure 2.

Figure 2. Crystal-independent energy correction curves used for the LYSO : Ce detector, and data points of the extrapolated energy peak values as a function of the true energy of gamma lines from the point sources Cs-137, Co-60, Na-22, and Na-24. Also the 170 keV backscatter peak from Na-22 and the 1732 keV double-escape peak of 2754 MeV peak (Na-24) were used, for the case with clustering and no clustering, respectively. The extrapolated values were obtained from point source spectra calibrated using crystal-specific linear curves, which only considered energy lines up to 1333 keV.
Download figure:
Standard image High-resolution imageThe energy correction functions obtained with and without cluster processing appear to be different, yielding: E = 0.991Eextrap − 8 × 10⁻⁶E2extrap, and E = 0.969Eextrap + 2.3 × 10⁻⁵E2extrap, respectively, where all energy values are expressed in units of keV. Event clustering was performed by summing up the energies of all DPC-chips with time-stamps spaced less than 5 ns apart, for the LYSO : Ce detector. Most probably these events originate from the same gamma quantum, which may undergo interactions in more than one DPC-chip. Omitting the clustering procedure results in a slight underestimation (~4%) of the extrapolated energy values at 2754 keV, which could be attributed to saturation. In contrast, if cluster processing is applied, there is an overestimation by about 4% at 2754 keV and 4123 keV, suggesting that energy overestimation outbalances saturation in this case. Presumably, this overestimation could be due to light sharing between neighbor DPC-chips. The per-pixel energy calibration may overestimate the energy in the presence of light sharing, because energy calibration curves have been derived from energy spectra of single-DPC-chip clusters (i.e. one DPC-chip validated per cluster window on whole detector).
In the case of the BGO detector we observed considerable inter-chip and inter-pixel response variations. Furthermore, lack of proportionality could be observed at 1275 keV already, with about 6% deviation of the saturation-corrected photon counts relative to the extrapolation from the 511 keV line. Possible reasons for this are the optical isolation between BGO crystals within a same DPC-chip and/or a (slight) mismatch between the crystal footprints and the DPC-pixels surfaces. For this detector, we therefore chose to apply a chip/pixel-dependent energy calibration curve, calculated by fitting a second-order polynomial to the positions of the five energy peaks from 137Cs, 22Na, and 24Na, such that the curves of the saturation-corrected photon counts, c, as a function of energy, E, yielded: c = p0 + p1E + p2E2, with p0 = 22 ± 26, p1 = 1.1 ± 0.1 keV−1 and p2 = (−4 ± 1) × 10−5 keV−2 (mean ± standard deviation). Since BGO has a lower timing resolution compared to LYSO : Ce, a longer clustering window of 20 ns was applied for that detector, which was sufficient to collect chip-events with energies as low as a few hundreds of keV.
The resulting (global) energy spectra measured with point sources are shown in figure 3 for both detectors. Both here and in the remaining of this work, energy spectra are presented with cluster processing, except in section 3.1, figure 6, where specified. The insets in figure 3 show the position of the 4123 keV sum peak of 22Na, which is clearly resolved for LYSO : Ce (figure 3-left) but hardly noticeable for BGO (figure 3-right). The FWHM of the gamma peaks at 511 keV, 1369 keV, 2754 keV, and 4123 keV was 12%, 11%, 10%, and 8%, for LYSO : Ce, respectively, and for BGO it was 19%, 14%, and 13% at 511 keV, 1275 keV, and 2754 keV, respectively. The BGO point-source spectra were obtained with a higher validation threshold than used in the prompt-gamma measurements (8-OR validation pattern instead of 2-OR), which lowered the detection efficiency but did not affect the peak positions.
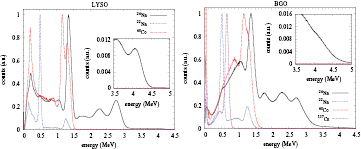
Figure 3. Energy spectra of point sources used for energy calibration, obtained with LYSO : Ce (left) and BGO (right). Intrinsic (Lu) background was subtracted from the LYSO : Ce spectra.
Download figure:
Standard image High-resolution image2.2.2. Time calibration.
Time calibration of the LYSO : Ce detector was done to allow accurate time-of-flight (TOF) discrimination. The two TDCs on each DPC-chip run on half the system clock frequency, in opposition of phase, and have a resolution of 19.5 ps and a range that spans approximately 10 ns. In this particular case, the system clock of 200 MHz was replaced by a clock pulse derived from the 106 MHz cyclotron RF signal, resulting in nearly no overlap between the TDC time stamps, meaning the valid time stamps were given alternatively from TDC1 or TDC2. The TDC outputs provided a direct measure of the TOF of the detected events, relative to the arrival time of the proton bunch, due to the correlation of the proton arrival times with the phase of the RF signal (RF-pulsed beam delivery). It is noted that part of the 9.4 ns long RF wave period (not more than 30%) was not registered due to a firmware filter that rejected events with invalid combinations of TDC1 and TDC2 values, which had not been adapted to the 106 MHz operating clock by the time of the experiment. Nevertheless, the available TDC range was sufficient to apply the TOF discrimination, and the use of an adequate delay line ensured that the prompt signal fell within that range.
Figure 4 illustrates two exemplary time histograms derived from the TDC outputs of DPC-chips placed at two different locations that, upon projection through the slit, correspond to positions 13 mm proximal or distal to the proton range on the beam axis. In both cases, a peak can be observed between about 2 ns and 4 ns, which is attributed to the prompt gamma signal. The DPC-chip that looks at the region distal to the proton range registers fewer prompt counts, which are mainly attributed to prompt gammas that are scattered or that pass through the collimator without interacting. The prompt peaks are superimposed on a broad background, which is mainly attributed to neutron-induced gammas and neutrons. This slowly-increasing background peaks at time stamps posterior to the prompt arrival time and spans over the entire RF-range, most likely due to overlay of neutrons generated by a given proton bunch onto successive pulses (Biegun et al 2012).

Figure 4. Measured time spectra (histograms) of events recorded by the LYSO : Ce detector, relative to an arbitrary phase of the cyclotron radiofrequency (RF) cycle, on two DPC-chips. The chip center positions upon projection through the slit onto the beam axis correspond to depths in the phantom that are 13 mm proximal (−) or distal (+) to the proton range (R80). A low energy threshold of 3 MeV was applied. The smooth curves overlaid on each measured histogram were obtained from fitting the data to a Gaussian function plus a linear baseline, while the shaded areas underneath each spectrum represent events accepted within a time-of-flight window of 1.5 ns width, centered at each Gaussian mean. These data were acquired for the highest amount of delivered protons.
Download figure:
Standard image High-resolution imageTOF calibration was based on determining the prompt peak position for every DPC-chip. For this purpose, we fitted all time spectra (after applying a 3 MeV low-energy cutoff) by a Gaussian function plus a linear baseline in the range between −1.95 ns and +1.76 ns relative to the maximum of the histogram. Thus, the background is approximated by a linearly rising slope and the prompt gamma peak by a Gaussian curve. The solid curves in figure 4 are examples of such fits. As illustrated by this figure, the prompt gamma peak position is chip-dependent, which is due to the clock skews between different chips of the DPC array (van Dam et al 2013). Furthermore the sum of the proton travel time and the prompt gamma time-of-flight depends on the positon within the phantom at which the prompt gamma quantum is created (Biegun et al 2012). These effects were corrected for by placing the TOF selection window symmetrically around the mean of the Gaussian fit of each DPC-chip.
The prompt gamma peak would be very narrow, in the order of 150 ps (Biegun et al 2012), if all protons would enter the phantom simultaneously. In practice, however, the prompt gamma peak is convoluted with the proton bunch width, i.e. the arrival time-spread of the protons within each RF cycle, as well as with the time resolution of the prompt gamma detector. In the present experiments, the (single-) detector time resolution is relatively small: viz. about 255 ps FWHM for 511 keV photons using 2nd photon triggering (Degenhardt et al 2012). Moreover, it is expected to decrease with increasing prompt gamma energy (Seifert et al 2012). Therefore, the width of the Gaussian fits is mostly determined by the proton bunch width and had an average value of 1.1 ns FWHM. Hence, TOF discrimination was implemented by rejecting events that did not fall within a time window of 1.5 ns width, centered at the calculated Gaussian mean for each DPC-chip. In cases were clustering was performed, the TOF discrimination was applied post-clustering on the time stamp of the DPC-chip that registered the highest energy only.
2.3. MCNPX simulations
The measured profiles and corresponding count rates per proton were compared to Monte Carlo simulations performed with MCNPX version 2.5.0. This simulation code has been extensively used by Smeets et al (2012) to characterize the collimator used in the present setup. The comparison was performed for a deposited energy ranging from 3 MeV to 6 MeV, which was previously found to yield the most favorable signal-to-background ratio (Smeets et al 2012), to check consistency with those results.
A simplified version of our measurement setup was modeled, consisting of the PMMA target, the tungsten alloy collimator and one of the detector modules. The materials, dimensions and relative positions of these parts were modeled according to the descriptions given in section 2.1, except that the crystal dimensions were modeled as (4 × 4 × 22) mm3 for LYSO : Ce and (4 × 4 × 20.5) mm3 for BGO, for simplicity, and both densities were artificially scaled down to 6.4 g cm−3, to compensate for the artificial increase in crystal volume, resulting from the increased footprint compared to the true footprint of 3.8 mm × 3.8 mm.
The proton beam was modeled as a perfect pencil beam with proton energy of 160 MeV, delivering a total of 1 × 10⁹ protons. For simplicity, counts were scored independently for each pixel, assuming zero dead time and perfect energy resolution. Electrons were tracked inside the pixels. Therefore, in cases where measured profiles were compared with simulated ones, cluster processing was not applied to the measured profiles.
3. Results and discussion
3.1. Energy and time spectra
The energy spectra recorded with the LYSO : Ce and BGO detectors are presented in figure 5-left and -right, respectively. The measurements without a collimator were made with the detectors centered at the expected beam range. The energy spectra presented in figure 5 for the case of an open collimator were obtained with the detectors shifted by 3.35 cm in the beam direction, thus looking at the phantom region before the Bragg peak, where the amount of background counts relative to the total counts is smaller compared to '0 shift', thus the difference between the energy spectra from open and closed collimators is higher.
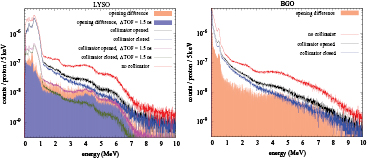
Figure 5. In-beam energy spectra measured using LYSO : Ce (left) or BGO (right), without a collimator, with the collimator closed, and with the knife-edge slit collimator (collimator opened). Also presented are the opening-difference spectra, i.e. the subtraction spectra of the collimator-opened case by the collimator-closed one. One-fourth of the LYSO : Ce detector surface was artificially not counted, to be comparable to the BGO case. The data with TOF discrimination was acquired with 5 × higher statistics, in terms of total delivered protons.
Download figure:
Standard image High-resolution imageIn general, the spectra present typical shoulders near the expected positions of strong prompt-gamma lines, such as the 2.2 MeV thermal-neutron-induced prompt gamma line, and the characteristic 4.4 MeV lines from C and O, and 6.1 MeV line from O, which have been interpreted elsewhere (Kozlovsky et al 2002, Polf et al 2009a, 2009b, Smeets et al 2012). Other spectral features may originate from single- and double-escape of the two previous gamma lines, as well as from the O line at 2.7 MeV and the C lines at 2 MeV and 1 MeV. The spectral features are better visible in the LYSO : Ce spectra due to the better energy resolution. Below 1 MeV, the LYSO : Ce spectra are dominated by the intrinsic activity of Lu, whereas in the BGO case a low-energy pedestal due to validated dark counts can be observed. This pedestal could be avoided by setting a stricter validation threshold, but should not affect the count rate in the present experiments considerably (see section 3.2.1). The BGO detector presents better sensitivity at higher energies (i.e. above about 6 MeV). The prompt gamma lines are less evident in the closed-collimator spectra, as expected. These spectra are dominated by uncorrelated events, mainly scattered gammas, neutron-induced gammas, and neutrons, with an intensity that decreases monotonously with energy.
A key feature in the open-collimator spectra obtained with TOF discrimination (figure 5-left) is that it clearly resembles the shape of the no-collimator spectra, albeit with a difference in intensity of about a decade due to the presence of the collimator. In addition, this spectrum is close in shape and number of counts to the opening-difference spectrum obtained without TOF discrimination. These observations already indicate how effective TOF discrimination is in rejecting background gammas generated within the collimator by neutrons. By comparing the open-collimator spectra with and without TOF discrimination, we observe that the latter contains more events at energies below about 3.8 MeV. The same observation can be made between the opening-difference spectra with and without TOF discrimination. Also these results indicate that TOF discrimination improves the signal-to-background ratio, which is expected to lead to an improvement in contrast of the measured profiles.
The time-energy distributions of the events measured with the LYSO : Ce detector are illustrated in figure 6, from regions proximal (top row) and distal (bottom row) to the Bragg peak. The intensity of prompt events, with time stamps between about 2.2 ns and 3.2 ns, is very much decreased when the detector is looking beyond the Bragg peak, as expected. The time stamps of background events mostly lie posterior to the prompt time stamps, although they do spread over the entire RF range (see section 2.2.2). The energy distribution of the correlated events ranges from approximately 1.2 MeV to 6–7 MeV, while the energy of the background events extends to higher values. As noted before, below 1 MeV (figure 6-left) prompt events are relatively scarce and the counts are peaked at a time posterior to the prompt peak, due to prevalence of the slower background.
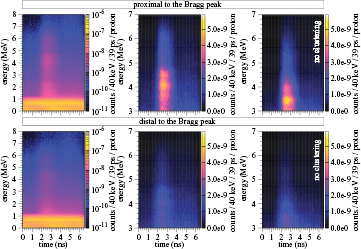
Figure 6. Time-energy intensity maps, measured over the whole LYSO : Ce detector area, having the detector center displaced 3.35 cm from the center of the slit in the beam direction, looking at the phantom region proximal (top row) or distal (bottom row) to the Bragg peak. The left and middle intensity maps were obtained with clustering of DPC-chip-events, whereas the right maps were not. These data were acquired for the highest amount of delivered protons.
Download figure:
Standard image High-resolution imageFinally, figure 6-center shows the increase in detection efficiency in the range 3 MeV–7 MeV by clustering multiple DPC-chip-events, in comparison to no clustering (figure 6-right). Without clustering, the spectrum exhibits local maxima at energy values of about 3.4 MeV and 3.9 MeV, corresponding with the double- and single-escape peaks of the prompt line at 4.4 MeV. As seen in figure 6-center, clustering processing considerably increases the chance of full-energy detection of the 4.4 MeV prompt gamma line and even of the 6.1 MeV line. Indeed, pair-production starts to compete with Compton scattering in this energy range in LYSO : Ce (~36% versus ~62% of total cross-sections at about 4.5 MeV, and ~51% versus ~48% at 6 MeV, Berger and Hubbell 2010).
3.2. Measured profiles
3.2.1. Comparison with simulations.
Figure 7 shows a comparison of simulated and measured profiles, the latter without cluster processing, for both the LYSO : Ce and BGO detectors. The profiles measured with LYSO : Ce are shown taking into account only the upper half of the detector, in order to be directly comparable to the BGO case and to resemble more closely the simulation results, in terms of statistical fluctuations. Furthermore, the lower detector half of LYSO : Ce presents more background counts, presumably due to the presence of the treatment bed (see section 3.2.2) that was not modeled in the simulations.
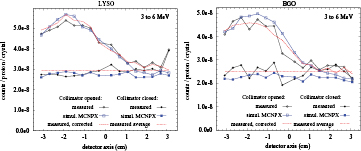
Figure 7. Comparison between measured and simulated profiles, for the LYSO : Ce (left) and BGO (right) detectors. Also presented are the open-collimator profiles corrected by subtracting the difference between the measured closed-collimator value and the corresponding average, for each pixel. The measured profiles were obtained without clustering of DPC-chip-events.
Download figure:
Standard image High-resolution imageIn general, both the experiments and the simulations indicate that the profiles obtained with LYSO : Ce and BGO are comparable in terms of the overall number of counts, but that the BGO profile contains slightly less background counts in comparison to the LYSO : Ce case, possibly due to a lower sensitivity of BGO to neutrons. By comparing the closed-collimator profiles and the open-collimator profiles beyond the Bragg peak, it seems that the simulations slightly underestimate the background, which is expected because the materials in the surroundings, such as the patient bed, are not taken into account in the simulations. However, the simulated open-collimator profile proximal to the Bragg peak is about 6% higher on average than the measured one, for both detectors.
It should be noted that an incoming particle that gives rise to multiple interactions on different pixels of a same DPC-chip was counted only once in the measured profiles, in contrast with the simulated profiles, in which each pixel was scored independently. This is not expected to have a major effect on the overall simulated counts, relative to the measurements. Taking into account the simplicity of the simulations, which do not take into account factors like additional background radiation and radiation scattering due to the materials in the vicinity of the detector, simulations and measurements are found to agree well. The agreement between simulation and measurements of closed collimator signal are in line with the recent results reported in Perali et al (2014) and in contradiction with the older ones reported in Smeets et al (2012). This further indicates that MCNPX seems rather efficient at reproducing not only the prompt gamma signal, but also the closed collimator signal.
Furthermore, the profiles measured with BGO present remarkable fluctuations, larger than what would be expected on the basis of Poisson noise only. These fluctuations are similar in magnitude in both the open and closed collimator cases. Moreover, the pattern of these fluctuations is very similar in these two cases, suggesting that they may result from differences in the sensitivity of different BGO crystal columns aligned in parallel with the knife-edge slit. To further investigate this, a correction to the open-collimator profile was attempted, by subtracting the difference between the measured closed-collimator profile and the corresponding average. Indeed, the resulting profile is much smoother and shows a greater degree of similarity with the simulated BGO profile. A similar effect can be observed for the LYSO : Ce case, although less pronounced.
One possible reason for the observed fluctuations in the uncorrected profiles could be the presence of systematic errors in the pixel assignment. Given that relatively large differences exist between the energy calibration curves of different BGO pixels especially, compared to the LYSO : Ce case, pixel assignment plays an important role in determining whether or not the detected event falls within the energy selection window. This effect is reduced when clustering processing is applied, as will be shown in the following section.
Overall, the agreement between simulations and measurements is quite satisfactory and reinforces that there are no important dead-time losses, as would be expected at the relatively low count rates under consideration. Given the present acquisitions settings and the measured count rate per DPC-chip, we expect that each DPC-chip is busy with event processing (acquisition, readout and recharge) for less than 2% of the time on average.
3.2.2. Signal-to-background ratio.
Figures 8 and 9 show the measured profiles obtained with clustering of DPC-chip-events, decomposed into 1 MeV wide energy windows up to 8 MeV, for the LYSO : Ce and BGO detectors, respectively. In the interest of clarity, only profiles without uniformity correction are presented in these figures and in the remainder of this section. It should be noted that, without uniformity correction, the profiles obtained with cluster processing present less fluctuations compared to those without cluster processing (section 3.2.1). The highest correlation with the BP position, in terms of the slope of the distal falloff region, is observed for the energy range from about 3 MeV to about 7 MeV for LYSO : Ce, and from about 3 MeV to about 8 MeV for BGO. It is to be noted, however, that the number of counts per proton falls down by an order of magnitude above 6 MeV.

Figure 8. Decomposition into energy groups of the profiles measured with the LYSO : Ce detector centered at the expected beam range, with and without TOF discrimination, using an open (open symbols) or closed (closed symbols) collimator. The profiles obtained with a closed collimator and TOF discrimination were acquired with 5 × higher number of protons. No uniformity correction was applied.
Download figure:
Standard image High-resolution image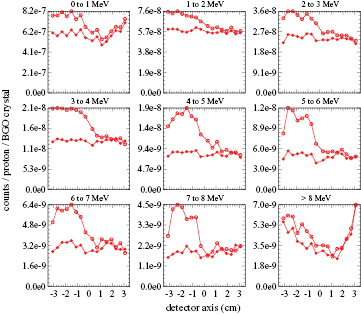
Figure 9. Decomposition into energy groups of the profiles measured with the BGO detector centered at the expected beam range, using an open (open symbols) or closed (closed symbols) collimator. No uniformity correction was applied.
Download figure:
Standard image High-resolution imageThe falloff in the number of counts of the LYSO : Ce profile, relative to its maximum, is higher if TOF discrimination is applied, while the overall number of counts is reduced by a factor of 2.6, in the energy range from 3 MeV to 7 MeV.
As expected, the falloff steepness decreases below about 3 MeV in all cases studied, due to the prevalence of the background counts that result from neutron interactions in the collimator, as well as from scattered prompt gammas that are not efficiently discarded by TOF discrimination. Above 8 MeV, there is a prevalence of neutron counts and, therefore, there is little correlation between the detected profiles and the depth-dose distribution (Smeets et al 2012).
The relation between the number of counts proximal and distal to the Bragg peak position can be used as a measure of the signal-to-background (S/B) ratio. Thus, the profiles measured with the detector centered at the expected beam range were interpolated with a sigmoid curve, by fitting them with the four-parameter complementary error function previously described by Henriquet et al (2012):

where z represents the depth into the phantom and a, b, c and d are fit variables. The profiles were corrected for non-uniformities using the corresponding closed-collimator profiles (see section 3.2.1) prior to the fitting, and the first and last pixel columns were excluded from the fit. The signal-to-background ratio was estimated as the ratio of the difference between the two asymptotes of the curve to the lower asymptotic value. These values are presented in table 1, for different energy windows.
Table 1. Signal-to-background ratios obtained with the BGO and the LYSO : Ce detectors from sigmoid fits to the measured PG profiles, for different energy windows and, for the latter detector, with/without time-of-flight (TOF) discrimination.
| Energy window (MeV–MeV) | Signal-to-background ratio | ||
|---|---|---|---|
| BGO | LYSO : Ce | LYSO : Ce w/ TOF | |
| 1–6 | 0.40(2) | 0.23(1) | 0.64(2) |
| 2–6 | 0.58(2) | 0.39(2) | 1.27(4) |
| 3–6 | 0.79(4) | 0.52(3) | 1.61(7) |
| 3–7 | 0.78(4) | 0.52(2) | 1.60(7) |
| 3–8 | 0.80(3) | 0.51(2) | 1.58(6) |
Table 1 confirms that the S/B ratio improves as the low-energy threshold is increased from 1 MeV to 3 MeV in all cases. Using an energy window from 3 MeV to 6 MeV, the BGO profiles have a S/B ratio of 0.8, about 60% higher than the value of 0.5 found for the LYSO : Ce case without TOF discrimination. The use of TOF discrimination increases the S/B of the LYSO : Ce profiles to 1.6 using the same energy window. The TOF-resolved LYSO : Ce detection therefore presents a 2-fold increase in S/B, in regard to the BGO case. In what concerns the high-energy threshold, we did not observe important changes in S/B by increasing it from 6 MeV to 8 MeV. Nevertheless, the profile counts increase on average by 20% for BGO and by 11% for LYSO : Ce without/with TOF discrimination, respectively, and therefore it may be beneficial to increase the high-energy threshold if clustering is performed.
Maps of the count rate registered per crystal and the corresponding profiles are illustrated in figures 10 and 11, respectively, for the BGO detector and the LYSO : Ce detector with and without TOF discrimination, using an energy window of 3 MeV–6 MeV in all cases. In figure 11, also the closed-collimator profiles are shown, as well as the profiles measured at two adjacent longitudinal detector positions that were added to increase the total field-of-view. In the latter profiles, the values of the edge pixel-columns were excluded to account for the observed systematic mismatches of the crystal count rates in the overlapping regions. Specifically, 2 pixel-columns were removed at each edge of the LYSO : Ce detector without TOF discrimination, 1 pixel-column for the same detector with TOF discrimination, and 2 pixel-columns on the left-most edge (on graph) for the BGO case.
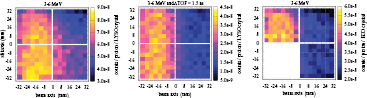
Figure 10. Intensity maps of crystal assignments of events registered in the energy window from 3 MeV to 6 MeV, using LYSO : Ce without TOF discrimination (left), LYSO : Ce with TOF discrimination (center), and BGO (right), having the detector centered at the expected beam range. No uniformity correction was applied.
Download figure:
Standard image High-resolution image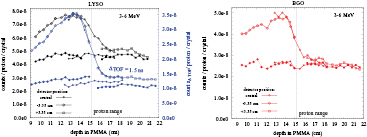
Figure 11. Measured profiles obtained with LYSO : Ce (left) and BGO (right) detectors, using an open (open symbols) or closed (closed symbols) collimator, at three detector positions along the beam axis (without uniformity correction). The dashed vertical line indicates the expected beam range. The profiles obtained with LYSO : Ce and TOF discrimination were acquired with 5 × higher number of protons, except for the profile corresponding to the central detector position with the open collimator.
Download figure:
Standard image High-resolution imageThe count-rate map obtained with LYSO : Ce (figure 10-left) shows a higher number of counts per proton in the lower half of the detector surface, compared to the upper part. This effect is reduced by applying TOF discrimination (figure 10-center), suggesting that the intensity offset is mostly due to background counts, for example gamma rays generated by neutrons interacting in the materials of the patient bed onto which the setup was placed.
By comparing the measured profiles shown in figure 11 to the ones presented in figure 7, we observe that cluster processing increases the detection efficiency of LYSO : Ce by 39% in the energy window between 3 MeV and 6 MeV, whereas for BGO this increase is 6–7% only. In case TOF discrimination is applied, the efficiency of LYSO : Ce increased by 30% with clustering. The higher efficiency increase in LYSO : Ce, compared to BGO, may be explained by the fact that the LYSO : Ce detector registers more DPC-chips per clustered event than the BGO one (specifically, 3.8 versus 3.3 chips per event for LYSO : Ce versus BGO, respectively, in the energy window between 3 MeV and 6 MeV), and that BGO presents higher efficiency. This is not unexpected given that the coefficient for photoelectric absorption of BGO is more than 1.5 times higher than that of LYSO : Ce in the energy range between 0.3 MeV and 6 MeV (Berger and Hubbell 2010). We did not observe relevant changes in the S/B ratios due to cluster processing.
Overall, our results indicate that BGO benefits from a higher gamma-to-neutron sensitivity compared to LYSO : Ce, resulting in a better S/B if no TOF discrimination is applied. Nevertheless, TOF selection appears to be the most effective way of rejecting background, rendering TOF-resolved LYSO : Ce detection the best option evaluated.
Given that TOF rejection of neutron-induced background relies on the difference in travel time between gammas and neutrons on their way to the collimator, the efficiency of TOF selection is expected to increase even further for larger distances between the beam and the collimator. However, at large distances background reduction efficiency by a 1.5 ns TOF window may not exceed the limit of 84%, estimated by considering an homogeneous distribution of background time stamps over the 9.4 ns RF period, caused by the larger transit time spread of neutrons and the superposition of the background counts from consecutive proton bunches. Nevertheless, given that a 15 cm distance between the PG camera and the beam axis is close to the lower limit of what can be achieved in practice, the present efficiency of about 74% is very satisfactory.
3.3. Detection of proton range shifts
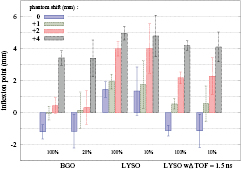
Figure 12 shows the profiles obtained at the reference phantom position, where the Bragg peak is aligned with the center of the detector, as well as with the phantom shifted along the beam axis by 1 mm, 2 mm, and 4 mm. The profiles were corrected for non-uniformities using the corresponding closed-collimator profiles (see section 3.2.1), except for the cases where TOF discrimination was applied, in which the profile oscillations were irrelevant. The profiles are presented with energy windows corresponding to the highest S/B and efficiency (see section 3.2.2), i.e. for event energies between 3 MeV and 7 MeV for LYSO : Ce and 3 MeV and 8 MeV for the BGO case. The left-side profiles were obtained with about 6.5 × 10⁹ protons delivered in total, while the right-side profiles were obtained with reduced statistics, by randomly sampling 10% of the total amount of events for the LYSO : Ce and 20% for the BGO case, where the factor of two difference accounts for the fact that only half of the BGO detector surface was counted.
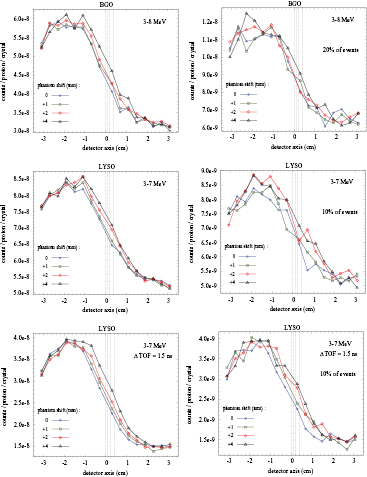
Figure 12. Profiles measured with about 6.5 × 10⁹ protons delivered in total (left), and a lower-statistics scenario (right), having the detector centered at the expected beam range (phantom shift = 0) and for various phantom shifts along the beam axis. The vertical lines indicate the positions of the Bragg peaks corresponding to the different phantom shifts. The profiles of BGO and LYSO : Ce without TOF discrimination were corrected using the corresponding closed-collimator profiles (see section 3.2.1). The lower-statistics scenario for the BGO case corresponds to 20% of the original detected events, in contrast to the LYSO : Ce case where a reduction to 10% of the original events was done, to compensate for the fact that only half of the BGO detector surface was used.
Download figure:
Standard image High-resolution imageThese results indicate that the improvement in the S/B ratio resulting from TOF discrimination directly translates into better possibilities to derive range position information. Visually, even the smallest steps, i.e. from the 0 position to +1 mm and from +1 mm to +2 mm, result in a clear and consistent shift of the PG profile over most of the distal falloff region if TOF discrimination is used, for the case of higher statistics (figure 12-left).
In order to quantitatively show this improvement in detectability of small shifts even for the case of reduced statistics presented, we used the technique of bootstrapping to randomly sample with replacement a set of 100 profiles from each of the profiles shown in figure 12-left. For each case studied, the sampled profiles were generated with the same number of counts as the original data, as well as with reduced statistics. A sigmoid curve was then fit to each profile, as explained in section 3.2.2, and similarly to Janssen et al (2014), the mean and standard deviation values of the inflexion points given by parameter d in equation (1) were obtained. These results are presented in figure 13.
Figure 13. Mean and standard deviation (error bars) values of the inflexion points of sigmoid curves obtained by fitting 100 bootstrap samples from the profiles measured having the detector centered at the expected beam range (phantom shift = 0) and for various phantom shifts along the beam axis, applying energy windows between 3 MeV and 7 MeV for LYSO : Ce and 3 MeV and 8 MeV for BGO. Results are presented for bootstrap samples having the same size as the original data ('100%', i.e. total counts detected with about 6.5 × 10⁹ protons delivered in total) and with lower statistics ('10%' for LYSO : Ce, and '20%' for the BGO case).
Download figure:
Standard image High-resolution image
As it had been anticipated by visual inspection, figure 13 shows that the mean inflexion point positions corresponding to the different phantom shifts are more clearly and consistently separated for the case of LYSO : Ce detector with TOF discrimination, presenting no overlap (100% statistics) or less overlap (reduced statistics) between error bars from successive phantom shifts, compared to the other two cases (BGO, and LYSO : Ce without TOF). Moreover, in all the cases there is a good agreement between the mean inflexion point values derived from bootstrap samples with 100% statistics as well as with reduced statistics. This demonstrates the robustness and potential of this technique, which enables to derive statistical quantities (e.g. the mean value of a distribution) from a single measurement. The average difference between the mean inflexion points and the expected beam range for the various phantom shifts was −1.1 for BGO, 1.3 for LYSO : Ce, and −0.3 for LYSO : Ce with TOF. Finally, it should be noted that the size of the error bars (standard deviation) may be reduced by applying more sophisticated and robust fitting techniques that are less sensitive to noise.
Although the detection of small relative range shifts seems feasible using the present detection system and TOF discrimination, the detection of a range shift in the clinical case is certainly more challenging, especially if it relies on a single measurement. A possible way to detect range shifts in regard to a planned situation could be to carefully compare measured profiles to reference ones, obtained by simulations. Future work is therefore desirable to fine-tune simulations to experimental data using highly heterogeneous phantoms and patient data. Additionally, it may be possible to provide absolute range assessment given the camera can be translated to detect the patient entry point in a similar way, by imaging prompt gamma rays from multiple proximal pencil beams with a common entry point.
4. Conclusions
We characterized the performance of DPC-based detector modules equipped with either BGO or LYSO : Ce scintillation crystals for the detection of prompt-gamma rays emitted from PMMA upon irradiation with 160 MeV proton beams. While the crystal matrices used were optimized primarily for the detection of 511 keV annihilation quanta in positron emission tomography (PET), consisting of arrays of high aspect-ratio crystals, it was possible to detect the main prompt gamma lines emitted in reactions involving H, C and O. Spectral characteristics were more clearly identified with the LYSO : Ce detector, due to its better energy resolution. The detection efficiency in the energy range between 3 MeV and 6 MeV could be increased by nearly 30% or 40% for LYSO : Ce with or without TOF discrimination, respectively, and by 6–7% for BGO, by using cluster processing, i.e. by applying a 'coincidence window' over the whole detector surface so as to find all crystals hit in a given event.
We used a knife-edge slit collimator to generate 1D-projection profiles that correlated with the expected proton range position. The measured profiles were in good agreement with MCNPX simulations. The signal-to-background ratio of 0.8 obtained with BGO was higher than the ratio of 0.5 found with LYSO : Ce if only energy discrimination was used to reject background counts. However, with the knife-edge slit collimator and detector placed at only 15 cm and 30 cm from the beam axis, respectively, the S/B ratio of the LYSO : Ce detector could be improved to 1.6 by synchronizing the DPC arrays with the 106 MHz cyclotron signal and applying a 1.5 ns wide TOF selection window centered around the prompt event peak.
Using only a single detector module with a total detection area of about 6.6 cm × 6.6 cm, equipped with 4 DPC arrays coupled to a total of 256 LYSO : Ce crystals of 4 mm × 4 mm × 22 mm each, the use of TOF discrimination enabled detection of Bragg peak shifts as small as 1 mm, for a single pencil beam delivering a total number of protons as low as about 6.5 × 10⁸ in PMMA. Therefore, these results suggest that the proton range may be monitored precisely on a per-pencil beam basis, given a realistic detector size composed of multiple such detectors aligned along the slit axis (a factor of 10 approximately). In conclusion, this work shows the feasibility of using DPC-based detectors in prompt-gamma cameras for range monitoring in proton therapy and highlights the fact that TOF discrimination remarkably improves the detectability of small (~1 mm) range shifts even if the PG camera is placed at only 15 cm distance from the beam axis.
Acknowledgments
This work is funded in part by the foundation for Fundamental Research on Matter (FOM), The Netherlands (grant no. 09NIG18) and by the European Union Seventh Framework Program (grant agreement n. 241851 and 264552). P. Cambraia Lopes is supported by grant no. SFRH/BD/73705/2010 and P Crespo was supported by grant no. SFRH/BPD/39223/2007, both from FCT—Fundação para a Ciência e a Tecnologia, Lisbon, Portugal, co-funded by the European Social Fund and by POPH—Programa Operacional Potencial Humano. P Crespo is currently supported by QREN—FEDER under the Sistema de Incentivos à Investigação e Desenvolvimento Tecnológico (CENTRO-07-ST24-FEDER-002007, project 'Radiation for Life'). Enrico Clementel was funded by the Walloon Region of Belgium (convention no. 1017266).
The authors would like to thank Philips Digital Photon Counting, in particular Carsten Degenhardt, York Haemisch, Ralf Schulze and Ben Zwaans, for the fruitful discussions and help with the hardware and software implementations that made the synchronized measurements possible. Our thanks to the IBA team at WPE, in particular Andres Varga Sampedro and Pedro Vidal Caravaca, for their precious support, and to Jeroen Koning, Kees Langelaan and William van Goozen, from DEMO, TU Delft, for the technical support with the measurement setup. Our thanks to the colleagues at TU Delft, Stefan Seifert, Giacomo Borghi and Valerio Tabacchini, for the fruitful discussions, and to Mehmet Sarilar, from INAA lab., TU Delft, for preparing the Na-24 radioactive source.