


Abstract
Heat and particle loads on the plasma facing components are among the most challenging issues to be solved for a reactor design. Alternative magnetic configurations may enable tokamak operation with a lower peak heat load than a standard single null (SN) divertor. This papers reports on the creation and control of one of such alternatives: a two-null nearby divertor configuration. An important element of this study is that this two-null divertor was produced on a large superconducting tokamak as an experimental advanced superconducting tokamak. A preliminary experiment with the second null forming a configuration with significant distance between the two nulls and a contracting geometry near the target plates was performed in 2014. These configurations have been designed using the FIXFREE code and optimized with CREATE-NL tools and are discussed in the paper. Predictive edge simulations using the TECXY code are also presented by comparing the advanced divertor and SN configuration. Finally, the experimental results of ohmic and low confinement (L-mode) two-null divertor and SN discharges and interpretative two-dimensional edge simulations are discussed. Future experiments will be devoted to varying the distance between the two nulls in high confinement (H-mode) discharges.
Export citation and abstract BibTeX RIS
1. Introduction
Heat and particle loads on the plasma facing components are among the most challenging issues to be solved for a reactor design [1, 2]. One approach to handling the heat exhaust power is to use alternative magnetic configurations, such as the snowflake divertor (SF) [3] and the recently described single-legged X-divertor [4]. The single-legged X divertor [4] places the second x-point near the plate, causing flared field lines there, which spreads the heat over a larger area and increases the line connection length. The SF configuration is characterized by a second-order null (x-point) in the poloidal magnetic field (BP), where both BP itself and its spatial derivatives vanish (BP = 0,  BP = 0). This splits the separatrix near the null into six segments: two of them enclose the confined plasma and four lead to the machine wall (the divertor legs) [5]. The poloidal cross-section of the obtained magnetic flux surfaces with a hexagonal null-point has the appearance of a snowflake. Theoretical studies indicate that the SF magnetic geometry may lead to both higher power losses during scrape-off layer (SOL) transport and an increased plasma wetted area of the wall [6, 7]. The former results from an increase in the connection length and the divertor volume, the latter from an increase in flux expansion and SOL width. The SF was first established on TCV [8], and later on the spherical tokamak NSTX [9] and finally in the larger tokamak DIII-D [10]. To provide some broader perspective of recent proposals of alternative divertor configurations, we could mention a cusp divertor [11], X divertor [12], super-X divertor [13] and tripod [14].
Initial experiments on the experimental advanced superconducting tokamak (EAST) in 2014 have been motivated from the goal to test the promises/potential of a two-null magnetic divertor by first proving that it can be created and effectively controlled on a large superconducting device, and secondly by the preliminary study of the effects of a mutual position of the two nulls: they keep 'talking' to each other even when they are situated relatively far away from each other on EAST. Each of them in its vicinity behaves as a first-order null, with the magnetic field growing linearly with the distance from the null, but the coefficient in this linear dependence 'knows' of the presence of the second null. This coefficient depends linearly on the distance between the nulls, as discussed in SF's theory [15] and, in a close vicinity of each null, does not depend on the direction. The fact that the flux expansion increases in the inner strike point compared to the standard divertor is a good illustration of this 'conversation' [15]. As shown in figure 1, EAST is constructed to be up–down symmetric, with the following main parameters [16]: major radius R = 1.8 m, minor radius a = 0.45 m, toroidal field BT up to 3.5 T, and plasma current Ip up to 1 MA for highly elongated plasmas with an elongation κ = 1.9. It can be operated in quite flexible plasma shapes with an elongation factor κ = 1.5–2.0 and triangularity δ = 0.3–0.6 for double null (DN) or SN divertor configurations. EAST is equipped with 14 superconducting poloidal field coils for ohmic heating, ohmic current drive, shaping and position control [17] located outside the toroidal field coils (TFCs).

Figure 1. 2D EAST geometry schematic view, mainly indicating the TFC, the labelling of PFCs and IC coils, the vacuum vessel and first wall. The plasma contained within the device is represented here by a set of contours of constant magnetic flux, or equivalently, constant pressure.
Download figure:
Standard image High-resolution imageIt should be noted that PFCs 7 and 9 are connected in series as are PFCs 8 and 10. Thus, there are in total 12 independent PF power supplies (maximum current IPF = 14.5 kA). EAST also has in-vessel active feedback coils (IC coils) for fast control of the plasma vertical instability; they consist of two 2-turn coils symmetrically located in the upper and lower part of the vessel and connected in anti-series in order to provide a horizontal field. Unlike DIII-D and NSTX, in EAST the divertor coils, which could be used to shape the local flux distribution within the divertor region, are outside the TFCs. In addition, EAST has only 12 independent PFCs to form SF configuration, for instance considerably fewer than in TCV, that presently is the most flexible machine to realize the SF configuration. Before presenting the EAST alternative magnetic divertor studies and experimental results, it should be considered that the exact SF constitutes a single null point in the magnetic configurations space. As was realized in the first assessment of the SF [3], an exact snowflake configuration is topologically unstable. Any variation of the PF coil currents, either by choice and/or perturbations of the magnetic equilibrium caused e.g by plasma instabilities, splits the second-order null in two first-order nulls (x1, x2).
As shown in figure 2, both x-points have an associated separatrix, with the one defining the last closed flux-surface (LCFS), called primary, and the other called secondary. The distance between the two x-points, i.e the proximity to the exact SF [18], is parametrized by the dimensionless parameter σ = D/a, with D the x-points separation and a the plasma minor radius. The position of x2 relative to x1 determines the local geometry of the null region and hence the properties of the divertor. There are two classes of SF configurations [18]: (i) in the SF+, all SOL field lines connect to primary strike points (SPs), as x2 resides in the private flux region (see figure 2); (ii) in the SF −, one of the secondary SPs is connected by field lines to the SOL, as x2 resides in the SOL (not shown here). Systematic assessments of the proximity condition to exact SF in terms of exhaust properties are well described in [5, 18]. It should be noted that in EAST, due to the location of PF coils and target plates, as will be discussed later in the paper, the secondary x-point could be moved around from the primary one to form a magnetic configuration that features either a contracting or flaring geometry near the plate, the latter being a feature of a single-legged X-divertor [4]. In the rest of the paper, we shall refer to the configurations and related experiments with a two-null divertor geometry as quasi-SF (QSF) scenarios, indicating for each configuration the features of contracting or flaring geometry. The paper is organized as follows. Section 2 describes the QSF equilibrium configurations design and optimization, taking into account the technological constraints of the EAST tokamak. In section 3 edge predictive simulations by comparing SN and QSF configurations will be given. Section 4 describes first ohmic and low confinement (L-mode) QSF experiments in EAST and preliminary interpretative two-dimensional (2D) edge simulations. Finally, section 5 contains a summary and an outlook.
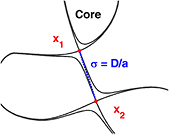
Figure 2. Schematic of the variation in the SF configuration, indicating the primary and the secondary x-points (x1, x2) and the dimensionaless SF proximity parameter σ = D/a.
Download figure:
Standard image High-resolution image2. EAST QSF equilibria modelling and optimization
QSF equilibria have been designed and optimized by means of CREATE-NL code (non-linear plasma evolution code), described in [19], in combination with the EFIT [20] and FIXFREE [21] static equilibrium codes. The tokamak simulation code (TSC) [22], a numerical model of the axisymmetric tokamak plasma and the associated control systems, has been then used to model the EAST QSF full plasma time evolution scenario. The procedure proposed for the design and optimization of QSF equilibrium using the CREATE-NL code exploits the linearized relation between the plasma-wall gaps and the PF currents, as discussed in [23]. It is composed of two steps:
- (i)the first step allows to have a first cut of the QSF equilibrium starting from a standard single null plasma configuration: a new equilibrium with a second null point within a limited distance from the SN x-point is obtained, forcing the plasma boundary to be almost unchanged, apart from the region in the vicinity of the null point;
- (ii)the second step refines the plasma shape and possibly reduces the PF coil currents while fulfilling the machine technological constraints. Recently, the same technique has been successfully used on TCV in order to optimize experimental SF configurations [24].
Here, QSF equilibria are identified as modifications of the EAST SN discharge #43362 (Ip ∼ 400 kA, BT = 1.8 T, internal plasma inductance li ∼1.4, poloidal beta βP ∼ 0.1) with the following constraints to be verified: (a) PF coil currents Ik far enough from their limits: Imin + ΔI ⩽ Ik ⩽ Imax − ΔI, with ΔI = 0.1 max{|Imin|, |Imax|}; (b) vertical instability growth rate not much larger than the reference SN configuration; c) strike points on vertical targets; d) at least 40 mm clearance (gap) between the plasma boundary and first wall. The objectives of the QSF design and optimization procedure consists of the definition of a set of QSF equilibria, at low (0.1) and high βP (0.45) with the secondary x-point close or far from the vessel structures maximizing the plasma current. Here, the vertical stability analyses have been carried out using the passive structures in their configuration before the changes made in 2014, assuming that with the new configuration, EAST can operate at least with plasmas having similar growth rates. Indeed, the main changes of the new in-vessel plasma facing components affect passive plates and upper divertor components. The passive plates have been moved inwards, but their thickness has been decreased; the effects of these two changes on vertical stability tend to compensate for each other. Previous analyses in [25] show that the upper divertor structure has a much smaller effect on vertical stability, due to its position and toroidal segmentation. Hence, the overall effect on vertical stability of the changes made in 2014 in plasma facing components is not expected to be dramatic. Nevertheless, for what concerns the effects of the new in-vessel conducting structures, a comparison of experimental results with model predictions are currently under way. The aforementioned analysis [25], consisting of detailed comparison of model predictions with the experimentally measured growth rates of VDEs, has been carried out for several configurations, ranging from low (<100 s−1), to medium (around 200 s−1) up to high (>300 s−1) values [25] by using CREATE_L (linearized axisymmetric model) [26] and CarMa0 (linearized model with a three-dimensional (3D) conducting structure and axisymmetric plasma) [27] codes. The aforementioned codes have been also used for the study presented here.
Different axisymmetric models have been computed, with the following assumptions on conducting structures (all structures are assumed as toroidally continuous with nominal resistivity): a) vessel only; b) vessel + passive plates (PP); c) vessel + passive plates (PP) + all plasma facing components. Assumption a) leads always to plasmas which are unstable on the Alfvén time scale (the vessel is 'too far' from the plasma to provide effective stabilization). Assumption c) provides a lower bound for the actual growth rate, since PP and plasma facing components are not toroidally continuous, but are connected to the vessel through suitable supports. Conversely, assumption b) provides an upper bound to growth rate, since the plasma facing components do provide some stabilizing effect. The 3D model instead self-consistently takes into account the actual geometry of the conducting structures. Figure 3 shows some details of the 3D structure used for vertical stability analyses. The optimized QSF configurations obtained with CREATE-NL and then verified by the EFIT and FIXFREE code are summarized in table 1.
Table 1. EAST QSF equilibria optimized by the CREATE-NL code.
| QSF low βP 400 kA 'close nulls' | QSF high βP 400 kA 'close nulls' | QSF low βP 480 kA 'far nulls' | QSF high βP 480 kA 'far nulls' | Reference SN 43362 | |
|---|---|---|---|---|---|
| Ip [kA] | 400 | 400 | 480 | 480 | 388 |
| βP | 0.1 | 0.45 | 0.1 | 0.45 | 0.1 |
| li | 1.4 | 1.4 | 1.4 | 1.4 | 1.26 |
| IPF1 [A] | 2560 | 3789 | 3366 | 6897 | −196 |
| IPF2 [A] | −13050 | −13051 | −13016 | −13027 | −203 |
| IPF3 [A] | 9407 | 9513 | 6635 | 4319 | 222 |
| IPF4 [A] | 2707 | 2028 | 2050 | 306 | −1432 |
| IPF5 [A] | −9398 | −12706 | −7363 | −10229 | 2158 |
| IPF6 [A] | 13050 | 13051 | 13016 | 13027 | 3956 |
| IPF7_9 [A] | 1198 | 2649 | 2222 | 4020 | 5233 |
| IPF8_10 [A] | −970 | −742 | 218 | 566 | 5282 |
| IPF11 [A] | 5322 | 4368 | 4033 | 2769 | −6055 |
| IPF12 [A] | 7145 | 6779 | 5557 | 5255 | −5981 |
| IPF13 [A] | −13050 | −13051 | −13016 | −13027 | −192 |
| IPF14 [A] | −13050 | −13051 | −13016 | −13027 | −622 |
| IC [A] | 0 | 0 | 0 | 0 | 0 |
| max(abs(currents)) [A] | 13050 | 13051 | 13016 | 13027 | 6055 |
| x-points separation D (cm) (only for QSF cases) | 39 | 45 | 84 | 92 | — |
| κ | 1.73 | 1.72 | 1.71 | 1.71 | 1.65 |
| Volume [m3] | 12.21 | 12.59 | 12.28 | 12.76 | 11.02 |
| Flux expansion f m | 26.59 | 22.29 | 9.84 | 11.09 | 2.09 |
| Connection length L (m) | 129.74 | 126.23 | 103.50 | 101.47 | 94.93 |
| Growth rate lower bound [s−1] | 186 | 161 | 148 | 120 | 88 |
| Growth rate upper bound [s−1] | 474 | 339 | 341 | 241 | 195 |
| Growth rate with 3D mesh of passive structures before 2014 changes [s−1] | 454 | 312 | 258 | 198 | 120 |
| Stability margin with 3D mesh of passive structures before 2014 changes | 0.23 | 0.31 | 0.35 | 0.44 | 0.61 |
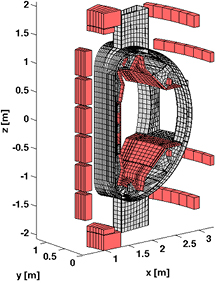
Figure 3. Details of the 3D structure used for vertical stability analyses.
Download figure:
Standard image High-resolution imageThe growth rates of the QSF equilibria are reasonably close to those of previous EAST experiments [25]. The low βP 'close nulls' option provides a somewhat more challenging value of the growth rate, which is probably related to the lower stability margin of this configuration. Also typical geometrical factors such as the connection length L and poloidal magnetic flux expansion f m [28] in the outer SP region, and the x-points separation D for the optimized QSF equilibria are reported. It should be noted that D is reported instead of the σ due to the fact that the minor radius a is almost a constant value (∼0.45 m) in EAST experiments. The connection length is evaluated averaging over an outboard equatorial depth of 2 mm. The simulated QSF and experimental reference SN equilibria at low βp are shown in figure 4.
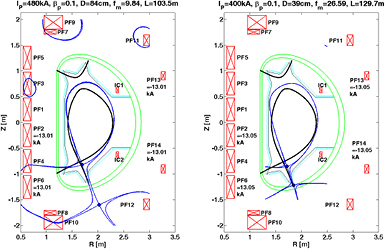
Figure 4. Plasma boundary of optimized QSF (blue solid line) and reference SN equilibria (black solid line), at low βP, calculated by the CREATE-NL code (see table 1). Also the x-point separation D, the connection length L, the polodal magnetic flux expansion f m in the outer SP region and maximum obtained PF currents are reported for QSF equilibria. For the SN configuration: L = 95 m, f m = 2.1.
Download figure:
Standard image High-resolution imageIn order to distinguish between flaring and contracting geometry, the poloidal flux gradient, that is ≈R · BP, along the separatrix at the outer strike in the direction to the main null (where R is the radial coordinate) has been calculated (see figure 5) for both configurations described in figure 4.
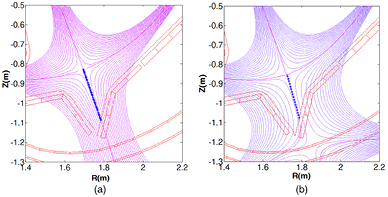
Figure 5. (a) Zoom of flux surfaces for the 'far nulls' equilibrium (see figure 4(a)). (b) Zoom of flux surfaces for 'close nulls' equilibrium (see figure 4(b)).
Download figure:
Standard image High-resolution imageIf the poloidal flux gradient on the separatrix decreases when moving along the separatrix towards the main null, this means a contracting geometry (the field lines are converging from the null to the strike point), otherwise it means a flaring geometry. The calculated poloidal flux gradients for configurations presented in figure 4, are shown in figure 6: the 'far nulls' case features a contracting geometry, whilst the 'close nulls' case features a flaring geometry at the outer strike point. In fact, for the 'close nulls' configuration, the poloidal flux gradient on the separatrix first increases then decreases when moving along the separatrix towards the main null.
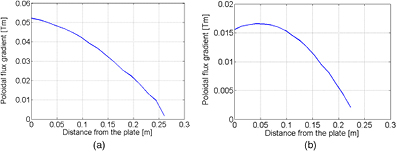
Figure 6. (a) Polodal flux gradient along the outer divertor leg starting from the plate, for the 'far nulls' case (see figure 5(a)). (b) Polodal flux gradient along the outer divertor leg starting from the plate, for the 'close nulls' case (see figure 5(b)).
Download figure:
Standard image High-resolution imageThe linear dependence of the gradient of magnetic field BP in the primary x-point on the distance between the two nulls is described in [6, 15] as criterion of 'conversation' between them. A self-explanatory way to show the aforementioned dependence is to plot contours of |BP|/|BP-midplane| = const around the nulls, with const = 0.01–0.1 [6, 15]. The iso-contours of |R · BP|/|R · BP|midplane = const around the nulls for both the optimized 'far nulls' and 'close nulls' QSF configuration are shown in figure 7. A direct manifestation of the 'conversation' between the nulls is that the flux flaring (characterized by the magnetic field gradient) in the main null is affected by the presence of the second null. Indeed, as it may be judged from the figures 7, the gradient of magnetic field BP is proportional to the distance between the nulls. This flaring is then directly translated to the increased wetted surface area and reduced heat flux [6, 15].

Figure 7. (a) Iso-contours |R · BP|/|R · BP|midplane = const for the 'far nulls' QSF configuration. (b) Iso-contours |R · BP|/|R · BP|midplane = const for the 'close nulls' QSF configuration.
Download figure:
Standard image High-resolution imageIt should be noted that for the QSF equilibria with Ip = 400 kA the secondary x-point is located on the vessel (on the inner shell at low βP, see figure 5(b), on the outer shell location for a high βP case, not shown here). However, the secondary x-point point may be brought inside the vessel at the price of a slightly lower plasma current or a higher plasma elongation and/or a further optimization of the PF coil currents. In addition, the 'close nulls' QSF equilibria present higher flux expansion at the divertor plates. Finally, the high βP configurations are slightly more demanding in terms of PF currents and present larger x-points separation D.
3. Edge predictive simulations
Predictive edge simulations of the standard SN divertor and QSF configuration, here the 'far nulls' case presented in section 3, have mainly been run with the flexible, quick and versatile multifluid 2D edge code TECXY [29]. TECXY takes into account all the main physics processes, atomic and plasma, occurring in the SOL, but the neutral dynamics, i.e. generation of atoms at the solid surfaces and transport into the SOL, is treated with an analytical model instead of the more rigorous Monte Carlo method. In addition, in TECXY the divertor plates are always assumed to be perpendicular to the flux surfaces, as discussed in [29]. The plasma status when it is detached from the divertor target cannot be reliably modelled, but only the approach to such conditions can be outlined. The parameters considered in the simulations have been: outboard density at separatrix 1.5 ⩽ ne,sep ⩽ 4.2 × 10¹⁹ m−3, corresponding roughly to the line averaged density range 3.5–10 × 1019 m−3, power input into the SOL PSOL = 3 MW, Ip = 300 kA and BT = 1.8 T. In these studies, the e-folding length power decay λ of 1 cm has been assumed for EAST, according to the studies presented in [30]. No impurity has been considered. In figure 8 the total power deposited on both (inner and outer) divertor plates for SN and QSF is shown versus the plasma density at the outboard midplane. The QSF curve is always below the SN one, i.e. the total volume losses are higher. As already found in the code runs for the tokamak proposal FAST [31] the load mitigating properties of the QSF are exalted at a higher density. Indeed, a further significant drop for the QSF total load is found for ne,sep ⩾ 2.5 × 10¹⁹ m−3 in EAST. According to the previous studies the main physics mechanism responsible for the higher QSF volume losses could be due to the longer magnetic connection length inside the divertor region. This prolongs the particle dwell time inside the SOL so that the number of interactions with the background neutrals during the particle lifetime increases and the energy losses are enhanced. In parallel to the divergence of the two curves, the features of plasma detachment are expected to appear. Indeed just at that value of ne,sep, the peak power load on the outer target for SN and QSF (see figure 9) shows a clear change in the slope for QSF with a saturation at a very low value, which is a sign of an efficient shielding of the plate.

Figure 8. Total load on both targets versus the plasma density at the outboard midplane. The power input into the SOL is 3.0 MW.
Download figure:
Standard image High-resolution image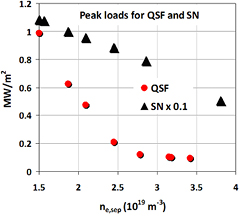
Figure 9. Peak power load onto the outer target versus the plasma density at the outboard midplane for both the standard (SN) and quasi snow flake (QSF) divertor.
Download figure:
Standard image High-resolution imageNo significant change is instead observed for SN, whose values are divided by 10 in the figure for facilitating the comparison.
It has to be noted for the sake of clarity that these loads correspond to targets perpendicular to the poloidal field: the actual values should take into account the real inclination of the plates. Validation to these results comes from the case so far considered also with the EDGE2D code [32], where the actual divertor geometry is considered and the neutrals dynamics is treated with a Monte Carlo computing technique. This is shown in figure 10 where the ratio (SN over QSF) between the peak values of the loads onto the outer target versus the density at separatrix on the outboard equator is shown. The point at the lowest density, derived from EDGE2D, is clearly the prolongation of the curve obtained from TECXY runs. This figure also clearly shows how strong the mitigation of the peak deposition power can be, as a combination of the flux expansion, which dominates at low density, and of the enhanced dissipation processes, which dominate at the higher densities. Again the slope changes close to ne,sep = 2.5 × 10¹⁹ m−3 should be attributed to the onset of detachment. The deposition profiles on the outer divertor target, with ne,sep = 1.5 and 2.1 × 10¹⁹ m−3, are finally presented in figure 11. For the higher density this figure not only details for QSF the large improved mitigation of the peak power, but also clearly puts into evidence how the load smears out over a longer distance and the peak position is slightly outwards shifted. Neither of the two last features is present in the SN curves. The second one (i.e. the peak shift) is the first hint of detachment. In summary, the predictive work with TECXY and EDGE2D indicates that a benefit, in terms of power load onto the divertor, is expected from changing the divertor magnetic configuration form the standard to the QSF configuration. In addition, the mitigation apparently improves at the highest densities, as found in other papers, and should be particularly evident with high additional heating power, since a stronger absolute drop of the loads has to develop for the same mitigation factor.

Figure 10. QSF peak mitigation factor, as derived from TECXY and EDGE2D runs. The point from this last code aligns very well to the others, despite the very different calculation method.
Download figure:
Standard image High-resolution image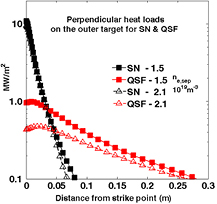
Figure 11. Power deposition profiles onto the outer target for two densities at separatrix for QSF (in red) and SN (in black). The target is set perpendicular to the poloidal field in the simulation.
Download figure:
Standard image High-resolution image4. Experimental results
First QSF experiments have been performed on EAST in 2014, after nearly 20 month-long upgrading break. The major upgrades [33] include: Heating and Current Drive (H&CD) systems increase to 26 MW from 10 MW, including a 4 MW (50–80 keV) of Neutral Beam Injection (NBI) system, new 76 different diagnostics installed and the upper divertor changed into ITER-like actively cooled W monoblock configuration with up to 10 MW m−2 heat removing capacity (where the lower divertor has been kept in Carbon material with Molybdenom-tiled vacuum vessel). In these experiments the simplest form of plasma current and position (i.e. plasma centroid) control has been used, the so-called RZIP control [34]. The control parameters are regulated by adjusting the current in the PF coils. The requested PF coil current is composed of the sum of feed-forward (FF) and feedback (FB) components. The adaptation of the more sophisticated ISOFLUX shape controller [17] to QSF configuration is still on-going and it will be tested during the next experimental campaign. The PFC currents, discussed in section 2, have been used as the FF component target in RZIP control for these first QSF experiments (only the 'far nulls' case, due to the lack of experimental time). Magnetic and plasma characteristics of QSF have been studied in discharges with Ip = 250 kA and BT = 1.8 T, κ ∼ 1.9, q95 ∼ 8, ohmic and with ∼500 kW of NBI heating. It should be noted that the plasma current in these first QSF experiments has been purposely kept low for safety reasons. Figure 12 shows the experimental magnetic equilibria, reconstructed with the Grad–Shafranov equilibrium code EFIT using standard magnetic constraints [20] at different times of the ohmic discharge #47660. Flux surfaces in the SOL are also shown.

Figure 12. Sequence of EFIT equilibria for the ohmic QSF discharge #47660 at 3.75, 4.5 and 5.25 s. Flux surfaces in the SOL are also shown.
Download figure:
Standard image High-resolution imagePoloidal flux gradient along the outer divertor leg, described in section 2, has been calculated for the equilibria presented in figure 11 and is shown in figure 13. It should be noted that in these first QSF experiments the secondary x-point is moving during the discharge (see figure 11) evolving to a configuration with a significant distance between the two nulls and with a contracting geometry near the target plates (see figure 12).
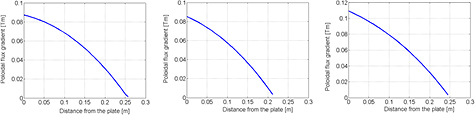
Figure 13. Polodal flux gradient decreases for each of the equilibria in figure 11, when moving along the separatrix towards the main null indicating a contracting geometry near the target plate.
Download figure:
Standard image High-resolution imageTwo L-mode discharges with similar input power (∼500 kW), similar effective charge Zeff ∼ 4.5 and electron average density ne ∼ 1.2 × 10¹⁹ m−3, but with different configurations (the standard divertor SN versus the QSF) will be compared. Core and edge diagnostic used in this study are described elsewhere [16, 35, 36]. In figure 14 the EFIT reconstructed equilibria for QSF #48971 (at t = 4.5 s, with βP = 0.76 and li = 1.28) and SN #47038 (at t = 4.5 s, with βP = 0.58 and li = 1.56) discharges are shown. Also the low-divertor Langmuir probe's (LPs) arrays are shown [36]. It should be noted that the experimental SN discussed here shows a contracting geometry near the plate. Experimental magnetic geometry properties for both configurations are compared in table 2.
Table 2. Main magnetic geometry for SN and QSF discharges.
| QSF, #48971 at t = 4.5 s | SN, #47038 at t = 4.5 s | |
|---|---|---|
| SOL volume [m3] | 0.389 | 0.260 |
| Connection Length [m] | 189.91 | 144.38 |
| Magnetic flux expansion at outer SP f m,out | 8.22 | 2.01 |
| Magnetic field angle at outer SP αout [deg] | 0.33 | 1.22 |
| Magnetic flux expansion at inner SP f m,in | 4.71 | 2.34 |
| Magnetic field angle at inner SP αin [deg] | 0.90 | 1.29 |
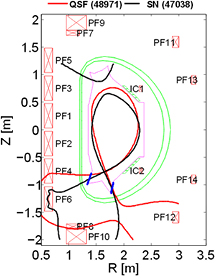
Figure 14. Schematic 2D view of EAST with SN #47039 at t = 4.5 s (black solid line) and QSF (red solid line) at t = 4.5 s plasma boundaries. The x-point separation D is = 79 cm for the QSF discharge. Also the low-divertor LPs arrays (blue solid points) are shown: inner LI01...15 (from the top to the bottom of the target) and outer LO01...LO20 probes [36].
Download figure:
Standard image High-resolution imageThese results confirm the predictions discussed in the previous sections: the presence of a secondary null-point in QSF reduces BP/Btot in the divertor separatrix region, where Btot is the magnitude of total magnetic field,  , and this increases the connection length by ∼30% and the flux expansion in the outer SP region by a factor ∼4. The experimental QSF magnetic field angle at the outer SP region is below the technological limit discussed here [18], i.e. the magnetic field angle at SPs should be greater than 1°. But, it should be noted that the QSF configuration has been obtained at high q95 ∼ 8 whilst operating at low q95 ∼ 3 the magnetic field angle should be >1°. This obtained QSF configuration shows a value PF6 = 8.3 kA as the maximum PF coil current during the discharge evolution, well below the limit of 14.5 kA. The experimental connection length is higher than the predictive one, discussed in section 2, of a factor ∼1.5 for both QSF and SN, as expected due to the fact that the experimental Ip is ∼45% lower than the simulated one. Time evolution of main plasma quantities for SN and QSF discharge are shown in figure 15: plasma current Ip, line avarage electron density ne, additional heating PHEAT (Lower Hybrid (LH) and NBI power respectively for #47038 and #48971), total radiated power PRAD from Bolometer diagnostic, q95 and elongation κ.
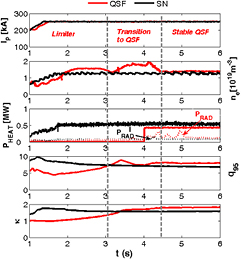
Figure 15. Time evolution of main plasma quantities for the SN (#47038) and QSF discharge (#48971): plasma current Ip, interferometer line average electron density ne, additional heating PHEAT (LH and NBI power respectively for SN and QSF), total radiated power PRAD from the Bolometer diagnostic, q95 and elongation κ.
Download figure:
Standard image High-resolution imageUp to 3 s the plasma configuration is the limiter, then a transition phase from limiter to the QSF configuration has been obtained as programmed. At ∼4.3 s the QSF shape becomes stable, i.e. no variation on elongation or q95 is present. Preliminary spatio-temporal profiles of the ion saturation current density jSAT for both QSF and SN discharges are shown in figure 16. Only inner and outer low-divertor LPs arrays are considered in this study. The error bar for LPs measurements is ±10% [36]. In the SN discharge #47038 both inner and outer LPs are quite active all the time. On the contrary, once the QSF shape becomes stable, the peak of jSAT on the outer target is observed to drastically drop indicating a possible heat flux reduction. Due to the fact that some of the LPs have been broken during the experiments, the calculation of the divertor heat flux from LPs has shown some difficulties. However, the infrared (IR) camera measurement [35] has been used for the heat flux calculation. In figure 16 the power density at the lower outer target from IR data, versus the distance along the target, is shown for the QSF and SN discharges at t = 4.5 s. In figure 16, zero is considered to be the position of the strike point. IR measurements point out a peak heat load reduction for QSF of a factor ∼2 with respect the SN configuration. Interpretative 2D edge simulations with the TECXY code have been performed in order to investigate the experimental observations. The experimental input power to the SOL used in the simulations have been: PSOL = 431.7 kW in the SN and PSOL = 414.5 kW for the QSF case (a slightly higher radiation has been observed in QSF discharge). Electron density at the outer mid-plane (OMP) separatrix ne,sep has been taken from the reflectometer diagnostic to be 6 × 10¹⁸ m−3 for both QSF and SN discharges. No impurity has been considered. In figure 17 also the simulated power densities at the lower outer target are shown. Since TECXY assumes a target perpendicular to the flux lines, all the data shown have been corrected taking into account the tilt angle of the target. The simulated peak heat flux is in reasonable agreement with the experimental data, confirming the heat flux reduction for the QSF configuration, that we consider to be related only to the higher flux expansion at this low electron density as predicted and discussed in section 3. A strong mitigation of the peak deposition power is expected to appear at the higher density, as a combination of the flux expansion, which dominates at low density, and of the enhanced dissipation processes, which dominates at the higher densities.
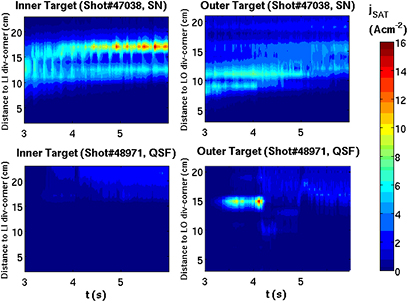
Figure 16. Spatio-temporal profiles of ion saturation current density jSAT for the SN (#47038) and QSF discharge (#48971). Once the QSF shape becomes stable, the peak of jSAT is observed to drastically drop indicating a possible heat flux reduction.
Download figure:
Standard image High-resolution image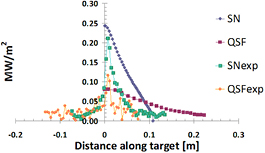
Figure 17. IR measured (labelled as 'SNexp' and 'QSFexp') and simulated power density (labelled as 'SN' and 'QSF') by TECXY at the lower outer target, at t = 4.5 s.
Download figure:
Standard image High-resolution image
5. Conclusions
The first ever demonstration of the possibility of creating and controlling the two-null divertor configuration on a large superconducting tokamak, as EAST, has been realized. First two-null divertor experiments, here called QSF, have been devoted to investigate a configuration with a significant distance between the two nulls at a low plasma current: the secondary x-point is moving during the discharge forming a configuration with a contracting geometry near the target plates. An increase of the connection length by ∼30% and the flux expansion in the outer SP region by a factor of ∼4 has been obtained for QSF with respect to the SN discharges, confirming the indications of the optimization study set up by CREATE-NL tools in combination with FIXFREE and EFIT equilibrium codes. It has been observed that in the L-mode discharge the peak of the ion saturation current density in LPs drops once the QSF shape becomes stable compared to a SN case, that could indicate a heat flux reduction. In order to verify this experimental observation, preliminary interpretative 2D edge simulations have been performed using the TEXCY code showing a good agreement between the IR measured and simulated peak heat load that highlights a reduction for this quantity in the QSF case, mainly due to the increase of the flux expansion with respect to the SN. These first experiments also indicate that the plasma current could be increased by a further optimization of the configuration and that it is possible to play around with the distance of the two x-points in order to change the topological features of the configuration. In addition, predictive 2D edge simulations highlighted that the heat flux mitigation apparently improves at the highest densities, and should be particularly evident with high additional heating power, since a stronger absolute drop of the loads has to develop for the same mitigation factor. In the coming EAST experiments the upgrade of the ISOFLUX control system will allow to control the exact position of secondary x-point. This will permit to increase the additional heating power and to easily vary some of the features of the topological configuration in the H-mode discharges at low and high plasma current, i.e moving from a contracting to flaring geometry near the target plates with the second null located on the vessel.
Acknowledgments
The authors gratefully acknowledge the helpful discussions with Dr D.D. Ryutov, Dr E. Kolemen, Prof S. Mahajan, Dr H. Reimerdes and Dr P. Micozzi. This work has been carried out within the framework of the EUROfusion Consortium and has received funding from the Euratom research and training programme 2014–2018 under grant agreement No 633053. The views and opinions expressed herein do not necessarily reflect those of the European Commission. The views and opinions expressed herein do not necessarily reflect those of the European Commission. In addition, this work was partly supported by Italian MIUR under PRIN Grant No. 2010SPS9B3, by the National Magnetic Confinement Fusion Research Program of China under Grant No 2014GB103000, the National Natural Science Foundation of China under Grant No. 11305216.