


Abstract
Progress in characterizing the edge stability and properties of the microinstabilities responsible for enhanced transport in the pedestal region is reported. The stability of the pedestal is characterized in high performance discharges on National Spherical Torus Experiment. These high performance plasmas are found to be ideal kink-peeling and ideal infinite-n ballooning unstable prior to the onset of edge-localized modes (ELM). The spatial structure of turbulence present during an ELM cycle in the pedestal region indicates poloidal spatial scales
 propagating in the ion diamagnetic drift direction at the pedestal top, and radial spatial scales
 . These propagating spatial scales are found to be poloidally elongated and consistent with ion-scale microturbulence. Both global and local gyrokinetic simulations have been performed to identify the microturbulence structure. The local gyrokinetic analysis indicates the presence of a linearly unstable hybrid kinetic ballooning mode and trapped electron mode with spatial scale and propagation direction consistent with experimental observations. In the global gyrokinetic analysis, the nonlinearly saturated potential fluctuations show radial and poloidal correlation lengths in agreement with experimental density fluctuation correlation length measurements.
Export citation and abstract BibTeX RIS
1. Introduction
Performance projections for ITER [1] hinge on the relation between fusion gain of the burning plasma core and the edge pedestal in the high confinement (H-mode) regime. Using multiple transport models, the fusion performance for ITER has been predicted to be proportional to the pedestal temperature height at fixed density (effectively proportional to the pressure pedestal height) [2]. Hence, the pedestal height emerges as a key parameter for fusion performance. The maximum achievable pedestal height, however, is limited by a class of instabilities known as edge-localized modes (ELMs). The peeling–ballooning theory is the leading candidate in explaining the processes setting this upper limit on the pedestal height [3–5].
The state-of-the-art model enabling predictive capabilities of the pedestal height and width is EPED [6]. This model includes the kinetic ballooning mode (KBM) criticality and MHD peeling–ballooning to predict the pedestal height and width just prior to reaching the stability boundary. The EPED model has been successfully tested across multiple international tokamaks [7]. However, the proven success of EPED has yet to be extended to small aspect ratio tokamaks. Extension of the EPED pedestal predictive capabilities to spherical tokamaks (ST) is needed for the optimization of the design of spherical tokamak based reactors (Fusion Nuclear Science Facility—FNSF) [8].
In the meantime, we report progress on tests of the EPED hypothesis. More specifically, the properties of the KBMs are investigated during the final part of an ELM cycle. As such, both ideal peeling–ballooning mode stability and ideal infinite-n ballooning stability of National Spherical Torus Experiment (NSTX) discharges have been studied during the final part of an ELM cycle where KBM is expected to be responsible for clamping the pressure gradient. The infinite-n ideal ballooning stability boundary is often used as a proxy for the onset of virulent KBM and associated stiff transport. Furthermore, information extracted from the ideal ballooning stability and peeling–ballooning theory have been used in the EPED model to predict the pedestal width scaling. This pedestal width scaling is obtained for small aspect ratio and a summary of fluctuation measurements in the pedestal region is reported. Finally, gyrokinetic codes are utilized to identify the turbulence in the edge region which will help quantify the transport associated with the microinstabilities supporting the hypothesis that KBMs limit the pedestal pressure gradient.
This paper focuses on characterizing the edge stability and turbulence associated in ELMy H-mode for high performance discharges on NSTX. More specifically, we show that during the final part of an ELM cycle, NSTX is near the kink/peeling–ballooning boundary using the ELITE code and that the pedestal region is infinite-n ballooning unstable (a proxy for the onset of KBM and associated transport). With this in mind, we characterize both the poloidal and radial spatial scales during the inter-ELM phase in the pedestal region and show the ion-scale nature of the turbulence. The experimental observations are accompanied with microturbulence simulations using both local and global gyrokinetic codes GENE and XGC1, respectively. The local linear simulation shows a hybrid mode TEM/KBM as the dominant instability. The global nonlinear simulations reveal that the ion temperature gradient (ITG) that spreads from the pedestal top has the spatial correlations of experimental levels. Finally, a discussion and summary are presented on the theoretical implications of the microturbulence in the pedestal region and possible links to the pedestal structure evolution.
2. Experimental method
NSTX [9] is a medium-sized low-aspect-ratio spherical torus with major radius R ∼ 0.85 m, minor radius a ⩽ 0.67 m, and Bφ ⩽ 0.55 T. H-mode discharges are typically obtained using neutral beam injection (NBI) heating with powers up to 6 MW (see figure 1 for the characteristic ELMy discharges studied here). The discharges studied used a marginally double-null divertor configuration, with the plasma slightly biased down
 , where
 represents the radial distance between the upper and lower X-points mapped to the outer midplane), and a bottom triangularity δbot ∼ 0.6. The upper triangularity was typically kept at 0.4 while the elongation κ varied between 2.3 and 2.4.
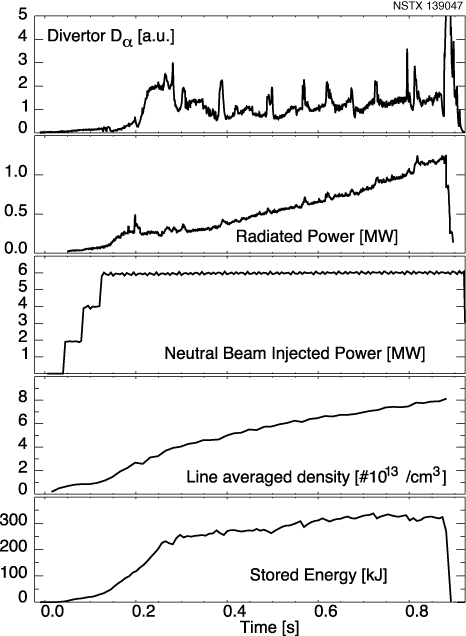
Figure 1. Time traces of the high performance ELMy H-mode discharges in NSTX.
Download figure:
Standard image High-resolution imageThe dataset shown was obtained from discharges at constant Bφ = 0.45 T, and NBI power of 6 MW, with amounts of lithium evaporated less than 50 mg between discharges to ensure reproducible ELMs. Large amounts of evaporated lithium (>200 mg) enables access to ELM-free regimes [10].
The main diagnostics utilized to characterize the pedestal parameters were the midplane Thomson scattering system (multi-point Thomson scattering—MPTS) for electron density (ne) and electron temperature (Te) sampled at 60 Hz [11], the C6+ charge-exchange recombination spectroscopy (CHERS) [12] for providing the carbon density and ion temperature Ti with a 10 ms time resolution, and the divertor light emissions for identifying ELMs.
Figure 2 displays the electron density, ion and electron temperatures, and the toroidal velocity during the last 50% of the ELM cycle. In addition, the associated profile fits are shown (the details of the profile fitting technique are given in [13]). Here, MPTS and CHERS profiles are mapped from real space coordinates into normalized poloidal flux coordinates ψn = (ψ − ψcore)/(ψseparatrix − ψcore).
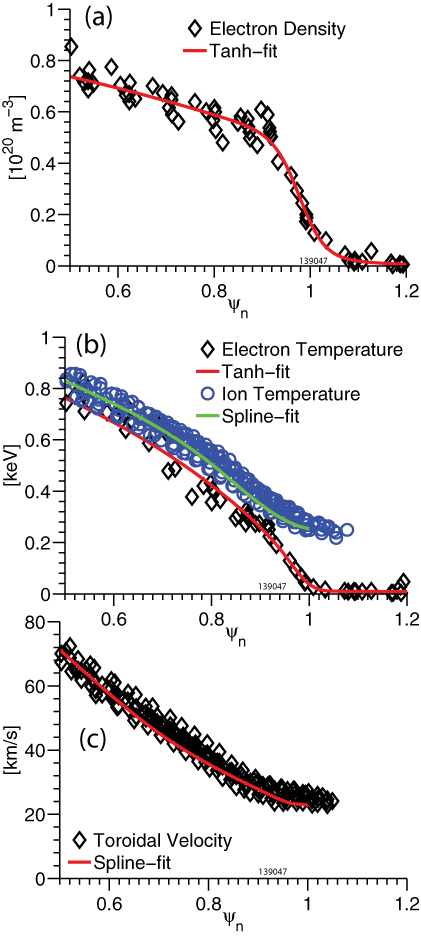
Figure 2. Experimental radial profiles: (a) electron density with overlaid tanh-fit; (b) both ion and electron temperatures with overlaid fits. Note that ion profile is spline fitted. (c) Toroidal velocity.
Download figure:
Standard image High-resolution image3. Edge stability calculations
In previous work, we analysed the inter-ELM evolution of the pressure pedestal parameters and showed that the pressure pedestal height saturates during approximatively the last 30% of the ELM cycle in low and medium plasma currents [14]. In this section, we analyse the edge stability prior to the onset of ELM for the medium plasma current.
Infinite-n ideal ballooning stability calculations are performed using the BALL code (a module of GS2) to determine the pedestal stability prior to the ELM onset [15]. Figures 3(a)–(d) display
 stability diagrams at various radii in the pedestal region during the final part of the ELM cycle (50%–99%). Here β' is the radial gradient (here taken with respect to ψn) of β = 8π P/B2 (at fixed B) and therefore is proportional to the pressure gradient. The white crosses indicate the experimental shears and pressure gradients. The pressure gradient has an uncertainty of ∼15–20% mostly due to the gradient errors. Similarly, in the magnetic shear—
 (here r defines the minor radius)—one estimates error in the range of ∼20–25% (uncertainties in the bootstrap current will cause this estimate to be larger).
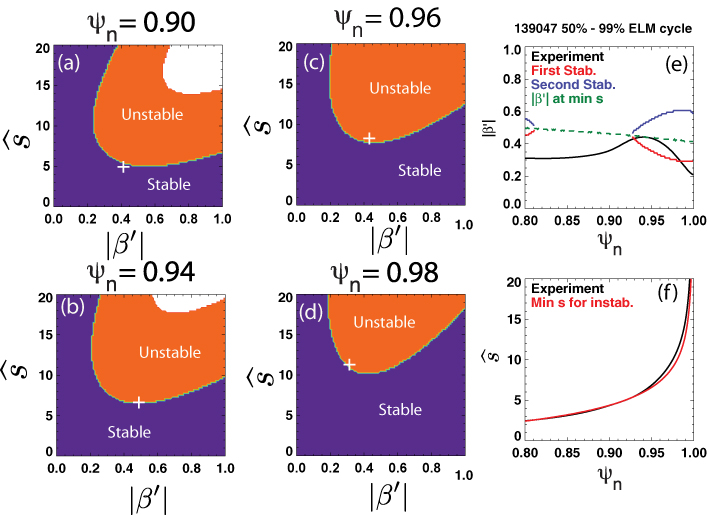
Figure 3. 'Ball' calculations for 50–99% of the ELM cycle. (a)–(d) Ideal n = ∞ MHD stability diagram
 —β' for various radii. The white cross-hairs indicate the experimental shears and pressure gradients. (e) Experimental β' showing that the pedestal (ψn = 0.93–0.98) crosses the first stability boundary and is therefore ballooning unstable. (f) Magnetic shear profile for both the experimental profile and the minimum shear required for the instability.
Download figure:
Standard image High-resolution imageNote that the magnetic shear is determined from a kinetic EFIT, which produces the experimental pressure profile specified as a function of normalized poloidal flux and flux surface averaged toroidal current density constrained at a number of points in the H-mode pedestal region. The current density is taken to be the sum of the bootstrap current from the Sauter model [16], the ohmic current density assuming it is fully relaxed, and the neutral beam driven current. This approach uses the fitted experimental profiles, and based on the current model used in the pedestal region, the approach tries to match the current profile.
Figure 3(e) displays the first and second stabilities and clearly shows that part of the steep gradient region (ψn = 0.93–0.98) is ballooning unstable. This suggests that the ballooning modes could in principle play a role in limiting the pedestal gradient assuming that the infinite-n ballooning calculations merely represent a proxy for the onset of KBM instabilities and the associated transport. Note that the stability calculations are strongly affected by the local experimental shear (see figure 3(f)), which depends on the bootstrap current model used (Sauter's model is used). Small variation in the bootstrap current models will more likely affect the experimental shears, which could enhance the stability of ballooning modes in the steep gradient region.
Using a set of fixed boundary kinetic equilibrium fits (EFITs) during the final part of the ELM cycle, while varying the edge pressure gradient at fixed edge current and vice versa, the stability of each equilibrium is computed using the ELITE MHD stability code [5] for n = 3, 6, 9, 12, 15. Figure 4 displays such equilibria-generated-boundaries with the cross-hairs representing the experimental current density and pressure gradient. Here, we display cross-hairs using the Sauter [16] and XGC0 [18] current models. As shown, XGC0 calculations of the bootstrap current is 20–30% larger than that of the Sauter model, which put the experimental point closer to the current driven kink-peeling stability boundary. Note that the NSTX stability boundary is typically at γ/(ω*/2) ∼ 0.1, with the unstable region in the bottom of figure 4 representing the ballooning unstable region and the upper region that of the kink-peeling unstable region. PEST [19, 20] calculations of this discharge equilibrium indicate instability at the low-n(n = 2, 3, 4) kink-peeling mode, with the maximum linear growth rate at n = 3 [21].
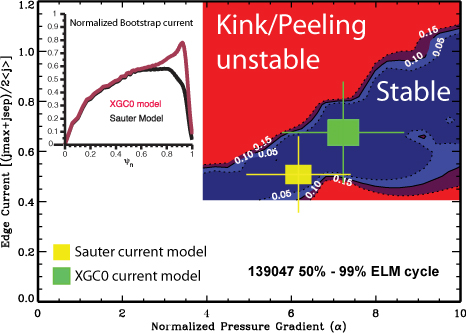
Figure 4. ELITE peeling–ballooning mode stability diagram. Contours of growth rate over 1/2 ion diamagnetic frequency (ωi*) as a function of normalized pressure gradient which is proportional to the peak pressure gradient in the edge pedestal; for the exact definition see equation (42) in [17]. The vertical axis is the normalized edge current. Inset: a plot of the normalized bootstrap current profile using the Sauter and XGC0 formulations.
Download figure:
Standard image High-resolution imageThis stability analysis is consistent with previous work where the pedestal height saturates during approximatively the last 30% of the ELM cycle for both low and medium plasma current. It can be concluded that this limit in the pedestal height is reached when the peak pedestal pressure gradient and computed edge current of the equilibrium are near the kink-peeling–ballooning boundary. These results extend previous analysis of ELMy discharges at lower injected power [22, 23] to high performance discharges. In addition, the infinite-n ballooning calculations appear to point toward the onset of KBM in the pedestal region.
4. Pedestal structure scalings
While the peeling–ballooning theory sets an upper limit on the pedestal height, the width is hypothesized—by the leading pedestal height prediction model (EPED)—to be set by the KBMs [24]. During its onset, KBM is thought to be responsible for large transport in all channels (momentum, particle and heat for both electrons and ions). Such transport could contribute to limiting the pedestal width. The pedestal width has been shown experimentally to scale with the square-root of β poloidal—
 ; Pped is the pedestal pressure height, Bθ represents the poloidal field) in several tokamaks [24–27].
This—
 —scaling is expected if the pressure gradient is limited by KBM with the assumption that the MHD parameter αcrit scales with 1/s1/2 (s is measure of the local magnetic shear across the outboard side as described in [24]) This scaling has been observed in both standard and low-aspect-ratio (MAST see [26]) tokamaks. While the difference in pedestal width scaling between NSTX and MAST (both low-aspect-ratio tokamaks) is not yet well-understood, we note that MAST plasmas have been shown to be ballooning limited contrary to NSTX discharges which are kink-peeling–ballooning limited. In addition, NSTX operates with strongly shaped plasma unlike MAST. This begs the following questions: is the scaling affected by a current- or ballooning-dominated instability? To what extent is the strong shaping playing a role in the width scaling? Is this difference in pedestal width scaling between MAST and NSTX due to different transport mechanisms?
This greater than 1/2 exponent scaling has been shown to be consistent with preliminary analyses of multiple NSTX discharges using extensive numerical studies namely the ballooning critical technique (BCP) [6], which yielded a
 scaling of the pedestal width (as shown in figure 5). Note that for standard aspect ratio shaped tokamaks, the BCP calculated KBM constraint takes the form
[6].
scaling of the pedestal width (as shown in figure 5). Note that for standard aspect ratio shaped tokamaks, the BCP calculated KBM constraint takes the form
[6].
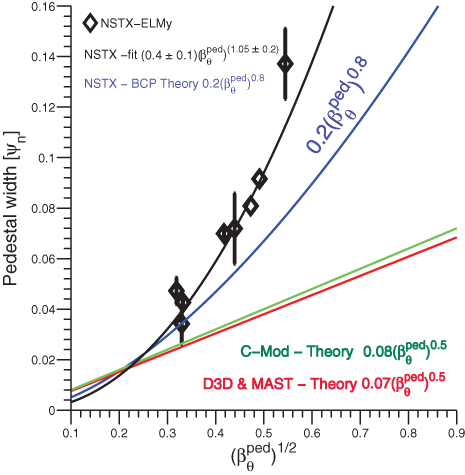
Figure 5. The pedestal width (in ψn) scaling with
. This width scaling effectively provides a relation between the width and the height of the pedestal. The best fit for NSTX width is
 . A theoretical model applied to NSTX data using BCP shows a
scaling.
. A theoretical model applied to NSTX data using BCP shows a
scaling.
Download figure:
Standard image High-resolution imageOther models, which predict the ETG modes to be a key player in the pedestal region, have shown a near linear scaling of the pedestal width with
 [28].
[28].
Finally, it is important to note that the observed width in NSTX is 2.4 times wider than DIII-D and C-Mod, and 1.7 times wider than MAST. Can differences in scaling point to competing mechanisms for setting the pedestal width? Experimental identification of KBM instabilities is challenging because it requires high spatial and temporal resolution of the local turbulence in the pedestal. However, there is growing evidence of the existence of KBM and microtearing modes in both MAST and NSTX pedestal regions using local gyrokinetic simulations [29, 30].
In the sections below, we characterize the spatial structure fluctuations and provide the associated gyrokinetic simulations for mode identifications both in a linear and nonlinear regime. Figure 6 illustrates the region spanned by the analyses that will be described below. In this figure, the steep gradient region is readily defined as the region spanned by the pedestal width. As for the pedestal top region, we choose it to begin from the pedestal top (end of the steep gradient region) and extend one radial correlation length inward. Such correlation length is obtained from the measurements presented below.

Download figure:
Standard image High-resolution image5. Spatial characterization of the edge fluctuations
In this section, we focus on characterizing the spatial scales of the fluctuations in the pedestal region which is defined as the pedestal top and steep gradient regions between ELMs. We utilized the correlation reflectometry [31] and the beam emission spectroscopy (BES) diagnostic systems [32]. Measurements of the poloidal characteristics using the BES system are performed at the pedestal top as shown in figure 6. In addition to the spatial structrure, the BES enables determination of the poloidal propagation of the fluctuation structures. The reflectometry system provided measurements of the radial correlation length in both the pedestal top and steep gradient regions (see figure 6).
Characterization of the edge fluctuations in the radial direction is facilitated by an array of fixed-frequency quadrature reflectometers allowing for excellent coverage of the pedestal region of high performance plasmas in NSTX. Figure 7 displays the evolution between ELMs of the radial correlation length of the complex electric field associated with the density fluctuations at the density pedestal top and in the steep gradient region (see inset of figure 7). Note the correspondence between electric field and density fluctuations has been described in [33]. The radial correlation length is observed to increase at the pedestal top by a factor of two. During the last 50% of the ELM cycle, the radial correlation reaches
 (
(
 is the ion larmor radius at the pedestal top). Note that the radial correlation length ranges from 3 to 7
, which yields
is the ion larmor radius at the pedestal top). Note that the radial correlation length ranges from 3 to 7
, which yields
 ranging from 0.3 to 0.7 (k is defined as 2/λc). Hereafter, the maximum normalized scale will be quoted. In the steep gradient, however, the correlation remains unchanged through the ELM cycle. A possible explanation could be that the large eddies (indicated by large radial correlation length) at the pedestal top are sheared off by the radial electric field (as shown in figure 8), which would result in consistently smaller eddies in the steep gradient region. The radial electric field is computed using CHERS measurements (see [12] for detailed discussions) as it follows
 , where θ and φ represent the poloidal and toroidal direction, respectively. An increase in the radial correlation length at the pedestal top could suggest an enhancement of the radial transport at the pedestal top assuming these correlation lengths are proxy for the eddy sizes.
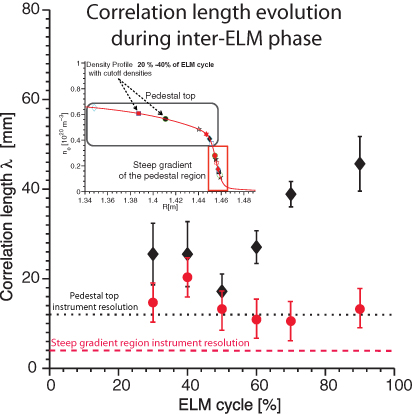
Figure 7. Evolution of the radial correlation length in the pedestal regions: pedestal top (diamond) and steep gradient (circle). The horizontal lines represent the correlation reflectometer system instrument resolution limits at the pedestal top and in the steep gradient region. Inset is an example of the density profile during the ELM cycle showing the distinction between the pedestal top and steep gradient region. In this inset the cuttoff refers to cuttoff density for the reflectometer system. From the cuttoff densities, one can determine the corresponding radial position of the reflection layers (see details in [33].)
Download figure:
Standard image High-resolution image
Figure 8. Shown here are the radial electric field profiles during the ELM cycle. The box indicates the region of strong radial electric field shear which coincides with the density steep gradient region where the radial correlation lengths remain unchanged.
Download figure:
Standard image High-resolution imageFigure 9 displays in the left and right panels the inter-ELM poloidal correlation lengths and group velocities determined from the time lags between BES channels. BES signals were frequency filtered to isolate 8–50 kHz components, the typical frequency range for observed broadband turbulence [34]. On the right panel of figure 9, the Er × B velocity is displayed at the pedestal top region (location is defined in figure 6). This velocity is inferred from the force-balance equation of the carbon ion distribution from the CHERS system. The BES velocities represent the advection velocities of the eddies. In order to relate these velocities with the propagation velocities, we account for the Er × B velocities at the pedestal top (R ∼ 1.40 m and ψn ∼ 0.72). It is clear from figure 9 that the Er × B velocities are measurably smaller at the pedestal top than BES-determined group velocities, and in the opposite direction.
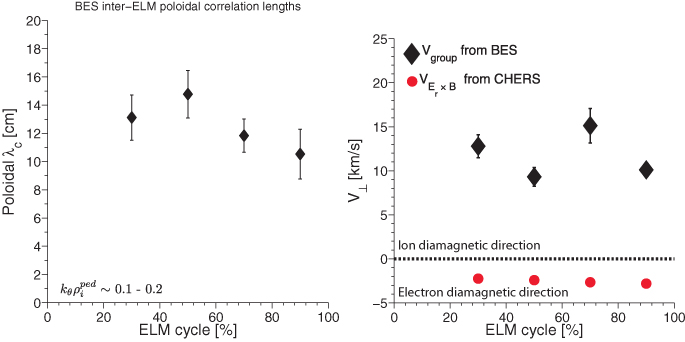
Figure 9. Left: inter-ELM poloidal correlation length evolution measured using the BES system. Right: poloidal velocity evolution. The diamond symbols represent the group velocities determined using BES at the pedestal top (see figure 6 for the extent of the pedestal top). The circle symbols indicate the Er × B velocities obtained from the CHERS system at the pedestal top. Note that positive velocity represents propagation in the ion diamagnetic direction while negative velocity indicates a propagation in the electron diamagnetic direction.
Download figure:
Standard image High-resolution imageIn the DIII–D tokamak, however, both the group and the Er × B velocities are measured in the steep gradient region where they are observed to be large and in the same direction as shown in figure 5 of [35]. These observed differences between the absolute individual values of
 and
and
 between the DIII–D and NSTX could stem from the different measurement locations.
The edge density fluctuations in the pedestal region during the ELM cycle clearly show anisotropic fluctuations with spatial scales
 (measured using BES system) and
 (measured using the reflectometer system) both indicative of ion-scale turbulence and propagating in the ion diamagnetic direction. Note that one can combine the two spatial scales to yield
 , where k⊥ is defined as
 . Given the radial correlation at the pedestal top, the fluctuations across the pedestal top will potentially be spreading in the steep gradient region. Thus, the fluctuations in the pedestal top affect the whole pedestal region and the physics affecting the pedestal top within a radial correlation is relevant for pedestal region at large.
Given these measurements of the pedestal turbulence during the inter-ELM phase, it is clear that the fluctuations exhibit ion-scale microturbulence compatible with ITG (including hybrids TEM) and/or KBM instabilities.
6. Gyrokinetic simulations
Gyrokinetic simulations for NSTX discharges have been performed to identify the relevant microinstabilities present during the pedestal evolution and to initiate first comparisons of turbulent features. Two different codes or models have been employed for these tasks: local, linear simulations considering comprehensive physics like full electromagnetic modes and collisions with the GENE [36] code and global, ITG nonlinear simulations with the XGC1 [37] studying nonlocal ITG turbulence spreading effect. Note that XGC1 contains, in its current implementation, physics only describing electrostatic instabilities. Unlike the experimental measurements which span both the pedestal top and steep gradient regions, the GENE gyrokinetic simulations are performed at the pedestal top only and the XGC1 spans the whole plasma with the last closed surface at ψn = 0.95.
6.1. Linear simulation using GENE
An initial first (comparatively) characterization of microinstabilities in a particular parameter regime or a specific discharge is typically performed by means of linear gyrokinetic simulations. For this purpose, the gyrokinetic Vlasov code GENE [36] has been employed with the nonlinear contributions being switched off. While GENE is also able to run as a global (full-torus) code [38], here it is operated in a (local) flux-tube to gain first insights in a reasonable amount of computing time while retaining relevant physics ingredients for the simulation of shaped, high-beta plasma where KBM and microtearing modes may become unstable. More specifically, these include both, perpendicular and parallel magnetic field fluctuations using fully gyrokinetic deuterium ions and electrons, collisions being modelled by a linearized Landau–Boltzmann collision operator and geometry information taken from EFIT via a field line tracing algorithm. The particular subject of investigation is NSTX discharge 139047 during the last 20% of the ELM cycle.
To facilitate comparison with the experimental characterization of the turbulence using BES described in the section above, the linear simulations were performed at the radial location where BES experimental measurements are obtained (ψn ∼ 0.72) for initial experimental-theory comparison. The growth rate and real frequency of the dominant mode as a function of the normalized binormal wavenumber kθρs are shown in figure 10. Here ρs is taken to be
 . It is clear that the maximum growth rate peaks near kθρs = 0.9. For kθρs ⩾ 1.8, two different modes with negative frequencies—that is propagating in the electron diamagnetic drift direction—and tearing parity are observed which is characteristic for microtearing modes [39, 30]. At lower wave numbers, another mode exhibiting a continuous transition from propagation in the electron diamagnetic direction to ion diamagnetic direction, which suggests a mode characteristic changing from an electron type mode to an ion type mode. At this stage the mode is identified as a hybrid mode having both ion characteristics such as ITG or KBM and an electron feature which in this case is TEM. To unambiguously identify the ion feature, a βe scan was performed at kθρs = 0.9 and fixed MHD equilibrium as shown in figure 10(c). In this plot, a threshold in the growth rate is observed when βe is scanned. This threshold is equivalent to an αcrit near 0.56. The dependence in βe is indicative of a KBM. This linear stability analysis enabled us to identify the mode as a hybrid KBM–TEM mode. Such hybrid modes have been observed in other NSTX discharges using the GYRO simulation codes as well (see Guttenfelder et al [40] for a comprehensive analysis of this mode).

Figure 10. (a) Growth rate as a function of kθρs; (b) real frequency as a function of kθρs; (c) growth rate and real frequency scan as a function of electron β. The experimental β is indicated by the black dot.
Download figure:
Standard image High-resolution imageFor completeness, the maximum linear growth rate as a function of poloidal wavenumber was performed as shown in figure 11. For each radial position two branches identified by their propagation directions are displayed. Furthermore, it is clear that growth rate increases as a function of radial positions with a large growth rate occurring for ψn > 0.8. This suggests that the maximum growth rate peaks somewhere in the region where ψn > 0.8, which would generate transport in electron and ion channels consistent with a clamping of the pedestal gradient. Future work will attempt to quantify the transport using suitable nonlinear analysis (computationally more challenging).
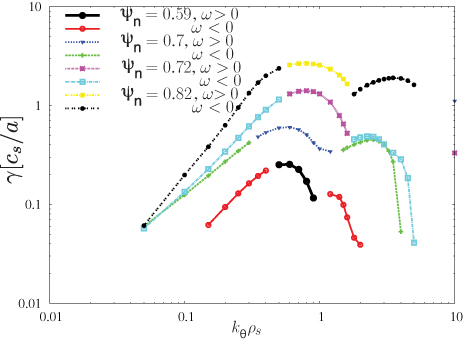
Figure 11. Shown here is a radial scan of the dominant linear instability. A clear smooth transition between ω > 0 (ion diamagnetic direction) and ω < 0 (electron diamagnetic direction) is shown. This further highlights the hybrid nature of the instability with characteristics of both KBM and TEM over a large spatial range.
Download figure:
Standard image High-resolution image6.2. Initial comparison with XGC1 simulations
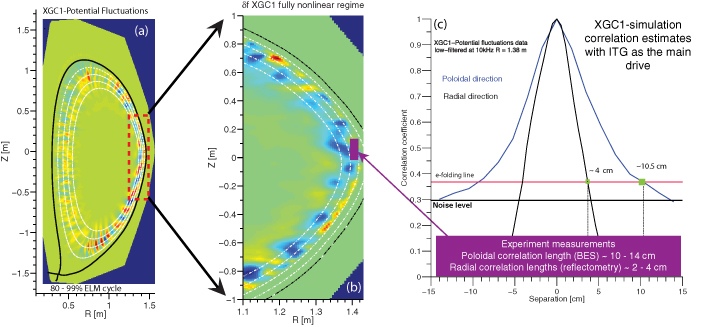
To gain different theoretical insights in the spatial characterization of the fluctuations observed in the pedestal region from the BES and the reflectometry systems, we used the full-torus gyrokinetic edge code XGC1 [37] to study the global ITG turbulence. The physics of a localized gyrokinetic simulation is highly limited in the edge pedestal. More specifically, the local gyrokinetic can only target regions spanning the radial correlation lengths in figure 7 of the steep gradient region (∼2 cm) and of the pedestal top (∼4 cm). Realistic experimental profile of 139047 during the last 20% of ELM cycle identical to that used in the above section has been used, but Coulomb collisions were not turned on in order to study the collisionless physics first. For a clearer analysis under fixed experimental plasma profiles, XGC1 was operated in the delta-f mode, even though XGC1 can operate in full-f mode in predictive simulations. In the simulations reported the delta-f mode of XGC1 is used.
Ten million particles are used for this simulation. The simulation box extends from the central core up to ψn = 0.95. Figure 12 displays a cross-section of the potential fluctuations in the nonlinear stage of the simulation, which shows characteristic poloidal structures propagating in the ion diamagnetic direction. The ITG source is found to reside at the pedestal top, but nonlinearly and nonlocally penetrated into the pedestal region. Sampling a region encompassing both BES and the reflectometer measurements (as indicated in the second panel of figure 12), one can estimate the equivalent radial and poloidal correlations as shown in the third panel of figure 12. The correlation is obtained from band-pass filtered potential fluctuations consistent with the BES frequency window. Good agreement between experiment and simulation is obtained. A poloidal correlation length of approximately 11 cm is obtained from simulation, compared to 10 to 14 cm from BES. Radial correlation length of approximately 4 cm is obtained from simulation, compared to 2 to 4 cm from correlation reflectometry. Future simulations will include kinetic electrons, as well as Coulomb collisions. Nonlocal nonlinear interaction of ITG turbulence with TEM and KBM will also be studied.
Figure 12. Left panel: 2D cross-section of the potential fluctuations from XGC1 simulations in the fully nonlinear stage. Middle panel: zoomed in edge fluctuations indicating the BES and reflectometry measurements region. Right panel: evaluations (from simulation) of both radial (4 cm) and poloidal correlation (11 cm) lengths in the edge region showing experimental level radial and poloidal correlation lengths.
Download figure:
Standard image High-resolution image
Gyrokinetic simulations using GENE and XGC1 for NSTX discharges have been performed to identify the relevant microinstabilities present during the pedestal evolution and to initiate first comparisons of turbulent features. The study compared local linear and global nonlinear gyrokinetic simulations. The local linear analysis using GENE was performed at the pedestal top and showed that the most unstable has both KBM and TEM features suggesting a hybrid mode. This hybrid mode is localized at the pedestal top and radial scans show that the mode spans the whole pedestal top (see figure 11). This analysis was expended to include a global nonlinear gyrokinetic simulation using XGC1 in a delta-f mode which only includes electrostatic instabilities (e.g., ITG drive). The study with XGC1 shows ion-scale turbulence at the pedestal top with radial and poloidal correlation lengths in agreement with experimental observations. XGC1, in this initial analysis, has not yet incorporated the physics of electromagnetic modes, but can provide a qualitative assessment of the correspondence of correlation length between experiment and simulations. Future XGC1 simulations will include the electromagnetic physics. Similarly, future GENE simulations will characterize the mode in the nonlinear regime for an optimum experiment–simulation comparison.
7. Summary
High performance ELMy H-mode discharges on NSTX are analysed in view of understanding the physical mechanisms limiting the pedestal pressure height and gradient, and for further characterizing the edge MHD stability and mircroinstabilities during the inter-ELM phase.
This paper describes the results of the edge pedestal plasma between ELMs and reports the edge stability analysis for model validation. The leading pedestal predictive model EPED hypothesizes that the KBM is the instability responsible for the transport limiting the pedestal gradient. We have studied the properties of KBMs from the point of view of ideal infinite-n MHD stability and microinstabilities. The ideal infinite-n MHD ballooning mode calculations are performed to provide a proxy for the abrupt onset of KBM instabilities and the associated stiff transport response. This stability analysis showed that in NSTX ELMy discharges during the last 50% of the ELM cycle, the edge pedestal is just beyond the stability boundary of the infinite-n ballooning mode indicating that KBM might be unstable in the pedestal region. In addition to the ideal infinite-n stability analysis, an ideal peeling–ballooning analysis (ELITE) was performed to show that ELMy discharges in NSTX are at the kink-peeling limit prior to the ELM onset. This limit is in contrast to the MAST (a low-aspect-ratio tokamak) discharges which are ballooning limited [26]. With the edge pedestal at the KBM criticality, EPED model hypothesizes that the pedestal pressure width in poloidal flux coordinate should scale as
 .
.
Experimental characterizations of the pedestal structure showed that on NSTX ELMy discharges, the pedestal pressure width scales with
 , which contrasts other tokamak's pedestal width scalings, namely
. Preliminary analysis of the NSTX discharges using the BCP technique, which has showed excellent agreement with the conventional
, was performed to show a
, which contrasts other tokamak's pedestal width scalings, namely
. Preliminary analysis of the NSTX discharges using the BCP technique, which has showed excellent agreement with the conventional
, was performed to show a
 scaling for NSTX discharges. While agreement between the BCP-derived scaling and the experimental measurements is still missing, both the experimental observations and the BCP technique seem to suggest that NSTX discharges exhibit a stronger than 1/2
 scaling. Using the same argument as in section III of [24] that led to the
scaling, it would indicate that in the case of NSTX the αcrit would scale weakly (i.e., <1/2) with s (the local magnetic shear across the outboard midplane). Obvious implications of the NSTX scaling are that the pedestal width is larger (at identical
scaling. Using the same argument as in section III of [24] that led to the
scaling, it would indicate that in the case of NSTX the αcrit would scale weakly (i.e., <1/2) with s (the local magnetic shear across the outboard midplane). Obvious implications of the NSTX scaling are that the pedestal width is larger (at identical
 than conventional scalings and that with such a large pedestal, larger edge current can be sustained.
Characterization of the edge microinstabilities along with mode identifications using gyrokinetics simulations have been performed. The results provided the characteristics of the radial spatial structure (via correlation length measurements) of the fluctuations both at the pedestal top and in the steep gradient region using the reflectometer system of
 ranging between 0.3 to 0.7. At the pedestal, the radial correlation is shown to increase during the inter-ELM phase, while the radial correlation in the steep gradient region remains unchanged. Similarly, the BES system provided poloidal measurements of fluctuations with spatial scale
 and propagating in the ion diamagnetic direction. Again, the BES measurements reflect fluctuations at the pedestal top. With radial correlation of 4 cm, it is plausible that the fluctuations at the pedestal top will spread to the top of the steep gradient region, therefore affecting the edge pedestal region. For experiment–modelling comparison and mode identifications, gyrokinetic simulation using XGC1 and GENE were performed.
Local linear gyrokinetic GENE analysis at the pedestal top identified a hybrid mode with characteristics of KBM/TEM at kθρs < 1. While this linear microinstability analysis showed the existence of a hybrid type mode with KBM/TEM characteristics at the pedestal top, nonlinear analysis is needed for quantitative comparison with experimental observations. XGC1—global gyrokinetic analysis—is used to attempt the characterization of turbulent structures via nonlinear simulations. In this initial assessment, XGC1 has limited physics and can only account for ITG modes (electrostatic version of the KBM). The initial simulations have shown good agreement between the spatial structures at the pedestal of the potential fluctuations from the simulations and the density fluctuations as measured using the reflectometer and BES systems. For realistic comparison with experiment, future simulations including electron dynamics and electromagnetic effects are planned.
Acknowledgments
A.D. acknowledges useful discussions with N. Crocker and the UCLA group for providing the reflectometer data. We also thank the anonymous referees for their constructive suggestions. This work is supported by US Dept of Energy contracts DE-AC02-09CH11466, DE-AC05-00OR22725, DE-SC0001288, and DE-FG02-99ER54524. A part of this work was carried out using the HELIOS supercomputer system at IFERC-CSC, Aomori, Japan.