
Abstract
The ozone production rate as a function of gas pressure and electric field strength is measured in a synthetic air dc low-current non-self-sustained discharge. The reduced field strength, E/N, is varied in the range 160–520 Td and the pressure, p, in the range 6.5–162 kPa. The ozone generation efficiency, i.e. the amount of ozone produced per energy unit absorbed by electrons in the discharge in air, is measured for the first time. The results obtained are compared with theoretical calculations of other authors.
Export citation and abstract BibTeX RIS
1. Introduction
Minimizing the energy consumption of ozone generation devices has been the object of intensive scientific research in the field of ozone production until now. The theoretical limit for minimum energy necessary for ozone synthesis can be estimated if physical and chemical processes involved in the ozone generation mechanism are ascertained.
In the case of ozone generation by electrical discharges using oxygen as a feed gas, ozone is almost exclusively formed from oxygen atoms that have been provided by electron impact dissociation of O2 molecules (Eliasson et al 1987). If the feed gas is air, the dissociation of O2 by excited N2 also plays an important role. The reaction schemes leading to the ozone formation in air (the theoretical models) are proposed by a number of authors (Yagi and Tanaka 1979, Eliasson et al 1984, Kogelshatz et al 1988, Braun et al 1991, Braun and Pietsch 1991, Deryugin et al 1997, Kitayama and Kuzumoto 1999, Knijnik et al 1999, Humpert and Pietsch 2005, Osawa et al 2011, Šimek et al 2012). At low ozone concentrations (at low input energies) the ozone loss processes in the discharge plasma have minor importance and can be excluded from the ozone generation model. As a consequence, the model turns into the simplest one. According to this simple model ions are not involved in oxygen dissociation processes. Thus, from the total energy supplied to the discharge cell only the fraction consumed by electrons, Fe, is spent in ozone generation (Braun et al 1991). In this paper, the ozone generation efficiency, Y, is defined as the yield of ozone per unit energy absorbed by electrons in the discharge with no ozone losses.
In the case of oxygen, the ozone generation efficiency is the sole function of the reduced field strength E/N, where E is the electric field strength and N is the gas number density. It follows from the ozone production mechanism that includes only reactions of oxygen dissociation by electron impact and ozone formation in three-body collisions of O atoms with oxygen molecules (Eliasson et al 1987). In the case of air as the feed gas, the ozone production mechanism also includes reactions that do not directly involve electrons (Eliasson et al 1984, Braun and Pietsch 1991). Thus, it is not as obvious as in the case of oxygen that efficiency can be presented as a sole function of E/N. In our recent paper (Aints et al 2012) we have brought out that in the case of pure oxygen as the feed gas, the efficiency as a function of the reduced field strength E/N is theoretically estimated by a number of authors, while the experimental verification of that characteristic is performed solely in a few works. In the case of air as the feed gas, we found only a few papers (Braun et al 1991, Braun and Pietsch 1991, Deryugin et al 1997, Kitayama and Kuzumoto 1999, Knijnik et al 1999, Humpert and Pietsch 2005), where the curve of theoretically estimated dependence Y–E/N is presented, and we found no papers, where this characteristic is measured. In the literature, the productivity as the yield of ozone per unit energy absorbed by the whole discharge (not by electrons only) is frequently presented. We refer here some values of measured productivity: 349 g kWh−1 (Buntat et al 2009), 239 g kWh−1 (Wang et al 2010), which are higher than the maximum efficiency (about 200 g kWh−1) predicted by theoretical calculations in Braun et al (1991), Braun and Pietsch (1991), Humpert and Pietsch (2005), Kitayama and Kuzumoto (1999) and Knijnik et al (1999). Somewhat higher values, 245–280 g kWh−1, for the efficiency are calculated by Deryugin et al (1997). Thus, the experimental determination of efficiency and a comparison of theoretical and measured values turn out to be a quite challenging task.
Difficulties in the measurement of efficiency arise mainly from the incorrectness of determination of the fraction of energy consumed by electrons in the discharge. In the case of a silent discharge or a streamer corona—discharge types that are almost exclusively used in commercial ozonizers—the discharge has a pulsed nature characterized with an electric field rapidly changing in time and space and differing significantly from the average value (Braun et al 1992, Kozlov et al 2001). As a result, the energy fraction consumed by electrons in these discharges can be estimated only with a great uncertainty. In some papers (Kitayama and Kuzumoto 1999) its value is taken as a free parameter to fit theoretical calculations with results of measurement.
The non-self-sustained low-current dc discharge (dark discharge) between parallel plate electrodes is a discharge type with an electric field uniform in space and time, where the E/N value can be varied in a wide range. We proposed (Aints et al 2012) a simple method to calculate the fraction of energy consumed by electrons in the dark discharge between parallel plate electrodes, and we measured the ozone generation efficiency as a function of E/N in oxygen. The ozone generation mechanism in air is much more complicated than it is in pure oxygen. Thus, the comparison of models with experimental results has a great importance. The measurement of ozone generation efficiency as a function of the gas pressure and the electric field strength in the dark discharge using air as the feed gas, and a comparison of results of measurements with theoretical calculations made by other authors, is the topic of this paper.
2. Experimental
The experimental set-up and the measurement method are similar to those we used for the measurement of ozone generation efficiency in pure oxygen, and are presented and described in Aints et al (2012). The non-self-sustained discharge was initiated between parallel plane electrodes illuminating the cathode by UV radiation. The discharge current was kept below 2 µA to avoid the distortion of the electric field homogeneity by the space charge of current carriers between electrodes, i.e. to keep the field of positive ions below 1% of the applied field (Raizer 1991, Paris et al 2005). Different values of E/N were obtained by changing the gas pressure, p, the distance between electrodes, d, and/or the voltage. We varied p in the range 6.5–162 kPa, d in the range 0.35–6.4 mm and voltage in the range 700–4600 V. Synthetic air (80% N2/20% O2 of purity 99.99%) was used as a feed gas for ozone synthesis. The gas flow rate was kept in the range w = 20–60 sccm (standard cubic centimetre per minute) keeping the ozone relative concentration below 10−4 to avoid ozone decomposition processes in the discharge (Eliasson et al 1987). The registered ozone concentration was inversely proportional to the flow rate and thus the production rate and the efficiency were independent of the gas flow rate. The ozone concentration was measured by absorption of the mercury spectral line at 253.7 nm.
In addition to ozone measurements, we took photographs of the discharge between electrodes in our discharge chamber at different E/N values by varying the inter-electrode distance and gas pressure. Photos were taken at the wavelength 337 nm using an interference filter with a bandwidth of 3 nm, and a CCD camera of 16 bit intensity resolution. From the photos taken we measured the intensity of radiation as a function of distance from the cathode. By fitting a theoretically derived formula according to Dutton (1978) for electron density with the measured curve of light distribution, the ionization coefficient, which is necessary for the estimation of the fraction of energy consumed by electrons in the dark discharge, was determined. The method we used is based on the proportionality of light intensity to the electron density in a low-current Townsend discharge in a discharge gap with a uniformly distributed electric field (Fujimoto 2004).
3. Ionization coefficient
For the estimation of the ozone generation efficiency in the dark discharge it is necessary to know the actual value of the ionization coefficient. The ionization coefficient, α, for air is measured by a number of authors. An overview of earlier papers before the year 1972 concerning basic data of air discharges is presented by Badaloni and Gallimberti (1972). The experimental data for the air ionization coefficient collected in Badaloni and Gallimberti (1972) are relatively abundant and satisfactorily consistent (within about 5%), except for the low values of E/p(p is the gas pressure), where attachment of electrons by oxygen is predominant. In this paper, analytical formulae representing α/p as a function of E/p are presented for different regions of E/p. Figure 1 presents the curve of α/N = f(E/N) according to these formulae for normal temperature. We have to note that there are misprints in table 2.1 of Badaloni and Gallimberti (1972) for coefficients of formula (2.7) for α/p in the E/p region 50–250 V cm−1 Torr−1. For this region, we used our own approximation formula compiled by data presented in figures of Badaloni and Gallimberti (1972).
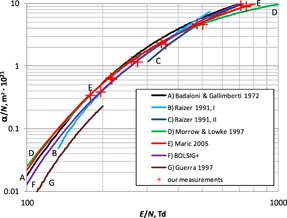
Figure 1. Ionization coefficient for air, as a function of the reduced field strength, by different approximation formulae.
Download figure:
Standard image High-resolution imageA different formula for α/p = f(E/p) is presented in Raizer (1991) (Raizer refers to Ward A L 1962 J. Appl. Phys. 33 2789 and von Engel A 1965 Ionized Gases (Oxford: Clarendorf)), and for α/N = f(E/N) in Morrow and Lowke (1997). Curves according to these formulae are also presented in figure 1. Analytical formulae based on earlier measurements of ionization coefficients for pure gases, and computing rules for calculation of α for gas mixtures are analysed in Maric et al (2005). The curve 'Maric 2005' in figure 1 is calculated according to formula (1), that is formula (3) in Maric et al (2005) and earlier proposed by Phelps and Petrovic (Petrovic and Phelps 1997, Phelps and Petrovic 1999). We took coefficients A and B for (1) from table 2 in Maric et al (2005), and the Wieland formula for the calculation of α/N for an 80% N2–20% O2 mixture. The Wieland formula is acceptable in the case of N2/O2 mixtures because those gases have similar electron energy distribution at the same E/N. In other cases, in mixtures of other gases, the Wieland formula might not be valid (Maric et al 2005).
We calculated the ionization coefficient using the program BOLSIG+ (Hagelaar and Pitchford 2005, BOLSIG+ 2013) for the gas mixture 80% N2 and 20% O2 (curve BOLSIG+ in figure 1) using cross-sections presented by BOLSIG+ (2013) as follows (Lawton and Phelps 1978, Phelps and Pitchford 1985, PHELPS 2013, SIGLO 2013). Results of calculations using the Boltzmann code for gas mixtures are also presented by Guerra et al (1997) (curve 'Guerra 1997' in figure 1).
As one can see in figure 1, the greatest variance of curves exists at lower values of E/N. The curves calculated by the program BOLSIG+ and by Guerra et al (1997) diverge from each other as well as from the curves based on measurements. The curves by Maric et al (2005), Badaloni and Gallimberti (1972) and Morrow and Lowke (1997) coincide satisfactorily in the region 100–300 Td, whereas the curve by Raizer (1991) differs substantially from others in this region. Also at higher values of E/N the divergence of curves is significant making it hard to choose the most reliable one.
To make a proper selection we measured the ionization coefficient in our discharge gap under the same experimental conditions as were used for ozone generation efficiency measurements in the present study. The results of our measurements of αef are presented in figure 1 with symbols +. The effective ionization coefficient is a function of ionization, attachment, detachment and ion conversion coefficients (Dutton 1978, Pancheshnyi 2013). At low values of E/N, where the attachment of electrons to oxygen molecules is comparable to ionization, the effective ionization coefficient turns out to be noticeably lower than the ionization coefficient. At E/N values higher than about 200 Td the difference between αef and α becomes insignificant. One can see that our measurements have the best match with the curve of Maric et al (2005). Therefore, in this study, we used coefficients of formula (1) proposed by Maric et al (2005) to calculate the values of α/N up to E/N values 550 Td despite the fact that the given validity range of that formula with given coefficients for oxygen is 70–400 Td (Maric et al 2005).
4. Ozone generation efficiency
To calculate the ozone generation efficiency, one needs the numerical value of the fraction of energy, Fe, consumed by electrons in the dark discharge. In our previous paper (Aints et al 2012) we used the model of a low-current dc discharge according to Dutton (1978) and presented a system of equations for the distribution of charges between electrodes according to this model, and a general formula (formula (4) in Aints et al (2012)) for the fraction of energy consumed by electrons in this type of discharge. This general formula has a complicated structure and contains a lot of coefficients, the value of which are known with great uncertainty. In Aints et al (2012) we also showed that in the case of oxygen, for αd ≫ 1 the fraction of energy, Fe, can be calculated as
This relationship holds also in the case of air. We used the simplified formula (2) for the calculation of Fe.
In figure 2, the fraction of energy consumed by electrons is plotted as a function of E/N and Nd. The increase in the reduced electric field strength E/N at a constant Nd has a limit determined by the breakdown of the discharge gap that can be determined from the Paschen curve. Therefore, the value of the fraction Fe also has a limit caused by the breakdown. The dashed black curve Fe min in figure 2 marks this limited value calculated from the Paschen curve which we determined under our discharge conditions. Our curve coincided in the limits of measurement uncertainties with the Paschen curve for air presented in Dakin et al (1974). The curve Fe min was determined by the following procedure. By dividing both sides of the Paschen curve U = U (Nd) (U is the breakdown voltage) by Nd we obtained a function (E/N)br = f (Nd) that defines the breakdown field (E/N)br for a given Nd. Using this experimental function (E/N)br = f (Nd), we evaluated the breakdown field for all values of Nd presented in figure 2. Then we calculated α/N((E/N)br) for the breakdown field and then Fe min = 1/(α/N((E/N)br)Nd).

Figure 2. Fraction of energy, Fe, consumed by electrons in the dark discharge in air, as a function of the reduced electric field strength E/N and Nd. In the legend, Nd has units 1021 m−2. Solid lines represent the full formula (formula (4) in Aints et al (2012)), and dotted lines reflect the simplified formula (2).
Download figure:
Standard image High-resolution imageThe grey dashed–dotted line in the figure indicates the boundary, where the difference between the values of Fe, calculated by the full formula using data for air discharges presented in Badaloni and Gallimberti (1972) and the simplified formula (2) with α according to formula (1), is 1%. Below that line, the difference is less than 1%. In the measurements reported in this paper, the fraction of energy, Fe, consumed by electrons stayed within the range 0.12–0.19 and was always below that grey dashed–dotted line. Thus, equation (2) is appropriate for Fe calculations in our case. It should be noted that Fe according to equation (2) is independent of a large number of coefficients that are required to calculate Fe according to the full formula. The ionization coefficient α remains as the only important quantity determining the energy consumed by the electrons in the dark discharge at αd ≫ 1.
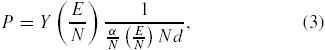
Measured values of ozone productivity, P, are presented in figure 3 by symbols with uncertainty bars. Figure 3 shows that in the case of the discharge type used the productivity is a function of two parameters: E/N and Nd. We varied the gas pressure and the inter-electrode distance, d, by keeping the product Nd constant (with 5% accuracy). It appeared that points obtained at a certain Nd but at a different E/N form a single P–E/N curve. Points corresponding to different Nd values form different curves. Solid curves in figure 3 are calculated according to formula (3):
using for Y(E/N) the curve 'Trendline' in figure 4, provided that the ozone production efficiency is a sole function of E/N. At constant Nd, the value of E/N can be changed in a rather narrow range to avoid breakdown, on the one hand, and to keep the ozone concentration sufficiently high for concentration measurements, on the other hand. For this reason, there is only a small number of points in figure 3 to represent the shape of the P–E/N curve at a certain Nd value.

Figure 3. Ozone production rate in the dark discharge. The values of Nd are indicated for each curve in the legend and they have a unit 1021 m−2. Solid curves are calculated using the trend line shown in figure 4.
Download figure:
Standard image High-resolution image
Figure 4. Efficiency of ozone generation as a function of the reduced electric field strength at different pressures. Solid red curve—trend line according to the formula Y(E/N) = 5.39 × 10⁻⁶(E/N)3−6.46 × 10−3(E/N)2 + 2.03(E/N) + 67.
Download figure:
Standard image High-resolution image
The ozone generation efficiency as a function of E/N is presented in figure 4.
The symbols in figure 4 present the efficiency calculated as Yexp = P/Fe, using our experimentally determined production rate, P, and values of Fe according to formula (2). Figure 4 shows that in the limits of uncertainty, most of the points fall on the single trend line in accordance with the supposition that the efficiency is a sole function of E/N.
Theoretically calculated Y–E/N curves of different authors are also presented in figure 4. These curves are copied from figures in Braun et al (1991), Humpert and Pietsch (2005), Kitayama and Kuzumoto (1999), Knijnik et al (1999) and Deryugin et al (1997). General shapes of curves by different authors are similar to each other and also to our trend line. The efficiency values calculated by Braun et al (1991), Kitayama and Kuzumoto (1999) and Knijnik et al (1999) are about 20% lower than our experimental points for the E/N region where the comparison is possible. Two curves by Deryugin et al (1997) are obtained using different cross-sections for excitation of electronic states of N2 by electron impact. Coincidence of curves by Deryugin et al (1997) with our experimental points is the best in the E/N region 160–200 Td.
5. Conclusions
The ozone production rate in the low-current non-self-sustained dc discharge between parallel plane electrodes in air is measured as a function of gas pressure and electric field strength, at low input energies where ozone losses in the discharge are negligible. The production rate in this type of discharge depends both on the reduced electric field strength, E/N, and on the product of the gas number density and the inter-electrode distance, Nd. The fraction of energy consumed by electrons in the discharge is calculated as a reciprocal of the product of the inter-electrode distance and the ionization coefficient, (dα)−1.
Values of ionization coefficient α for air obtained by different authors are compared with our measurements. The analytical function for α that gives the best match with our results is selected.
The ozone generation efficiency, i.e. the amount of ozone produced by energy unit absorbed by electrons, as a function of gas pressure and electric field strength in air is measured for the first time. In the limits of uncertainty, the efficiency is independent of the gas pressure and is a sole function of E/N. We compared the measured values with theoretical calculations made by different authors. The best coincidence was found for calculations made by Deryugin et al (1997).
Our experimental results can be used for the validation of theoretical models that are used for design and optimization of industrial ozone generators.
Acknowledgments
This work was financially supported by the Estonian Science Foundation grants 5675 and 6928.