


Abstract
The recently discovered Indus stellar stream exhibits a diverse chemical signature compared to what is found for most other streams due to the abundances of two outlier stars, Indus_0 and Indus_13. Indus_13 exhibits an extreme enhancement in rapid neutron-capture (r-)process elements with [Eu/Fe] = + 1.81. It thus provides direct evidence of the accreted nature of r-process-enhanced stars. In this paper we present a detailed chemical analysis of the neutron-capture elements in Indus_13, revealing the star to be slightly actinide poor. The other outlier, Indus_0, displays a globular cluster-like signature with high N, Na, and Al abundances, while the rest of the Indus stars show abundances compatible with a dwarf galaxy origin. Hence, Indus_0 provides the first chemical evidence of a fully disrupted dwarf containing a globular cluster. We use the chemical signature of the Indus stars to discuss the nature of the stream progenitor which was likely a chemically evolved system, with a mass somewhere in the range from Ursa Minor to Fornax.
1. Introduction
The detection of numerous stellar streams in large photometric surveys like the Sloan Digital Sky Survey (York et al. 2000; Stoughton et al. 2002) and the Dark Energy Survey (DES; Abbott et al. 2018) has made it clear that the Milky Way (MW) halo contains remnants from numerous accreted globular clusters and dwarf galaxies. Stellar streams form when satellite systems fall into the MW halo and are slowly disrupted and mixed into the MW stellar population. The streams thus provide a unique window to study the hierarchical build-up of the Galaxy. With the recent addition of all sky proper motions from the Gaia mission (Gaia Collaboration et al. 2016, 2018) a full chemodynamical study of the systems can be performed providing strong diagnostics of the stream progenitor systems.
In particular, the chemically distinct pattern of stars formed in globular clusters has been used to link streams to their parent object (Simpson et al. 2020; Hansen et al. 2020) and further explore the chemical enrichment channels of these systems (Casey et al. 2021). Although detailed abundance analysis of disrupted dwarf galaxy stars is still sparse, chemical characterization of some systems has revealed these to contain stars exhibiting enhancements in rapid neutron-capture (r-process) elements. Specifically, Aguado et al. (2021) found an overall enhancement of [Eu/Fe] ∼ +0.65 in their nine Gaia Sausage/Sequoia stars analyzed and Gull et al. (2021) detected a range of −0.5 < [Eu/Fe] < +1.3 in stars belonging to the Helmi debris and tail streams and the ω Centauri progenitor stream. These results suggest that the progenitors of these streams are likely relatively massive systems which experienced multiple r-process enrichment events such as neutron star mergers. In addition, the search for dynamical substructure in data from spectroscopic surveys such as the HK, Hamburg/ESO and LAMOST surveys, which includes a large number of stars with stellar abundances derived, has also revealed several dynamically tied groups (Yuan et al. 2020; Limberg et al. 2021)
In this paper we investigate the chemical signature of the stellar stream Indus, which contains both an r-process-enhanced star, Indus_13, and a globular cluster-like star, Indus_0. The Indus stream was discovered as a stellar overdensity in DES data (Shipp et al. 2018) and further characterized with radial-velocity and metallicity measurements of member stars through the Southern Stellar Streams Spectroscopic Survey (S5) project (Li et al. 2019). Seven of the Indus stream members were selected for high-resolution follow-up and their abundances are presented in Ji et al. (2020). In this paper we present new abundances, as well as further explore those from Ji et al. (2020). Section 2 describes the observations of Indus_0 and Indus_13. A detailed analysis of neutron-capture elements in Indus_13 is presented in Section 3 and the results given in Section 4. Section 5 discusses the implications of the abundance patterns of Indus_0 and Indus_13 and the general chemical signature of the stream. A summary is provided in Section 6.
2. Observations
Indus_0 and Indus_13 were observed in July 2019 with the Magellan/MIKE spectrograph (Bernstein et al. 2003) as part of the S5 high-resolution follow-up program. General background on the S5 project can be found in Li et al. (2019), and information on membership probability calculations and target selection for the high-resolution follow-up are described in Li et al. (2019) and Ji et al. (2020). Indus_13 was again observed in November 2020. All observations were executed using the 0.7'' slit and 2 × 2 CCD binning, yielding a typical resolution of R ∼ 35,000/28,000 in the blue and red arms, respectively. The data were reduced with the CarPy MIKE pipeline (Kelson 2003) and coadded. Table 1 provides an observing log for the observations listing the signal-to-noise ratio (S/N) per pixel, heliocentric radial velocities and associated uncertainty, and the number of orders (Nord) used for the cross-correlation of the spectra.
Table 1. Observing Log for Indus_0 and Indus_13
| Obs. Date | MJD | S/N | S/N | vhel | σ(v) | Nord | |
|---|---|---|---|---|---|---|---|
| (min) | 4500 Å | 6500 Å | (km s−1) | (km s−1) | |||
| Indus_0 | |||||||
| 2019-07-27 | 58691.16 | 50 | 25 | 47 | −28.8 | 0.2 | 34 |
| Indus_13 | |||||||
| 2019-07-25 | 58689.23 | 86 | 23 | 43 | −58.0 | 0.3 | 35 |
| 2020-11-17 | 59170.60 | 92 | 12 | 35 | −59.2 | 0.6 | 37 |

Download table as: ASCIITypeset image
3. Stellar Parameter Determination and Abundance Analysis
Ji et al. (2020) presented abundances for ∼25 elements in both Indus_0 and Indus_13 as part of their analysis of stars across multiple stellar streams. This star exhibits an abundance pattern consistent with it having formed in a globular cluster, and we discuss the implications of this in Section 5. Indus_13 exhibits significant r-process enhancement, such that we are able to derive abundances for 24 neutron-capture elements in addition to the measurements presented in Ji et al. (2020). These new abundances are determined following the analysis in Ji et al. and using the parameters for Indus_13 determined in that paper (see Table 2). We provide here a brief description of the procedure and refer the reader to Ji et al. (2020) for details. Effective temperatures were determined from photometry using de-reddened g − r colors from the DES survey (Abbott et al. 2018) and color−temperature relations derived from Dartmouth isochrones (Dotter et al. 2008). Surface gravities were determined using the distance modulus from Shipp et al. (2018) in combination with DES g-band magnitudes. Finally, metallicities and mictroturbulences were determined from equivalent-width measurements of Fe ii lines in the stellar spectra. All abundances presented here are derived via spectral synthesis using the analysis code SMHR 23 to run the 2017 version of the 1D local thermal equilibrium (LTE) radiative transfer code MOOG 24 . α-enhanced ([α/Fe] = +0.4) ATLAS model atmospheres (Castelli & Kurucz 2003) were used as input, with line lists generated from linemake 25 updated with CH lines from Masseron et al. (2014) 26 . Solar abundances were taken from Asplund et al. (2009). Our synthesis also includes isotopic and hyperfine structure (IS and HFS) broadening, when applicable, employing the r-process isotope ratios from Sneden et al. (2008). Values and references for the oscillator strengths () employed are listed in Table 3 along with wavelengths, and the excitation potential (ξ) values for the lines used in the analysis. Finally, Ji et al. (2020) introduced a thorough systematic and statistical abundance error analysis, which we also employ here. For completeness, we list the Ji et al. (2020) measurements for Indus_0 including errors in Table 4.

Table 2. Basic Data for Indus_0 and Indus_13
| Quantity | Indus_0 | Indus_13 | Unit | References |
|---|---|---|---|---|
| Gaia DR2 id | 6390575508661401216 | 6412626111276193920 | ||
| R.A. | 23:24:01.75 | 22:05:30.97 | hh:mm:ss.ss | |
| Decl. | −64:02:20.8 | −56:30:53.4 | dd:mm:ss.s | |
| g | 16.20 | 17.05 | mag | Abbott et al. (2018) |
| r | 15.60 | 16.46 | mag | Abbott et al. (2018) |
| Teff | 5040 ± 47 | 5063 ± 58 | K | Ji et al. (2020) |
| 1.93 ± 0.16 | 2.29 ± 0.16 | cgs | Ji et al. (2020) | |
| ξ | 1.73 ± 0.23 | 1.59 ± 0.16 | km s−1 | Ji et al. (2020) |
| [M/H] | −2.41 | −1.91 | Ji et al. (2020) |

Download table as: ASCIITypeset image
Table 3. Atomic Data and Abundances for Individual Neutron-capture Element Lines
| Element | λ | χ | Ref. | |||
|---|---|---|---|---|---|---|
| (Å) | (dex) | |||||
| Sr ii | 4077.71 | 0.00 | +0.15 | +1.68 | 0.06 | 1 |
| Sr ii | 4161.80 | 2.94 | −0.47 | +1.92 | 0.18 | 1 |
| Sr ii | 4215.52 | 0.00 | −0.17 | +1.62 | 0.08 | 1 |
| Y ii | 3950.35 | 0.10 | −0.73 | +1.17 | 0.51 | 2 |
| Y ii | 4124.90 | 0.41 | −1.38 | +0.71 | 0.28 | 2 |
| Y ii | 4358.72 | 0.10 | −1.15 | +0.85 | 0.40 | 2 |


References. (1) Kramida et al. (2018); (2) Biémont et al. (2011); (3) Ljung et al. (2006); (4) Wickliffe et al. (1994); (5) Kramida et al. (2018), using HFS/IS from McWilliam (1998); (6) Lawler et al. (2001a), using HFS from Ivans et al. (2006); (7) Lawler et al. (2009); (8) Li et al. (2007), using HFS from Sneden et al. (2009); (9) Den Hartog et al. (2003), using HFS/IS from Roederer et al. (2008); (10) Lawler et al. (2006), using HFS/IS from Roederer et al. (2008); (11) Lawler et al. (2001c), using HFS/IS from Ivans et al. (2006); (12) Den Hartog et al. (2006); (13) Lawler et al. (2001b), using HFS from Lawler et al. (2001d); (14) Wickliffe et al. (2000); (15) Lawler et al. (2004), using HFS from Lawler et al. (2009); (16) Lawler et al. (2008); (17) Wickliffe & Lawler (1997); (18) Lawler et al. (2009) for values and HFS; (19) Lawler et al. (2007); (20) Quinet et al. (2006); (21) Xu et al. (2007), using HFS/IS from Cowan et al. (2005); (22) Biémont et al. (2000), using HFS/IS from Roederer et al. (2012); (23) Nilsson et al. (2002).

Only a portion of this table is shown here to demonstrate its form and content. A machine-readable version of the full table is available.
Download table as: DataTypeset image
Table 4. Abundance Summary for Indus_0
| Element | N | [X/H] | σ[X/H] | [X/Fe] | σ[X/Fe] | Δξ | Δ[M/H] | sX | |||
|---|---|---|---|---|---|---|---|---|---|---|---|
| (dex) | (dex) | (dex) | (dex) | (dex) | (dex) | (dex) | |||||
| C-H | 2 | +6.16 | −2.27 | 0.08 | +0.20 | 0.09 | 0.09 | −0.06 | 0.01 | 0.04 | 0.03 |
| C-N | 1 | +6.53 | −1.30 | 0.47 | +1.16 | 0.47 | 0.13 | −0.05 | 0.01 | 0.05 | 0.00 |
| O i | 1 | <+7.81 | −0.88 | +1.58 | |||||||
| Na i | 2 | +4.72 | −1.52 | 0.08 | +0.94 | 0.08 | 0.07 | −0.07 | −0.07 | −0.01 | 0.06 |
| Mg i | 7 | +5.54 | −2.06 | 0.06 | +0.40 | 0.07 | 0.04 | −0.04 | −0.04 | 0.00 | 0.09 |
| Al i | 2 | +4.31 | −2.14 | 0.25 | +0.32 | 0.25 | 0.04 | −0.09 | −0.09 | −0.06 | 0.30 |
| Si i | 2 | +5.83 | −1.68 | 0.08 | +0.78 | 0.09 | 0.07 | −0.05 | −0.03 | 0.01 | 0.00 |
| K i | 2 | +3.42 | −1.61 | 0.10 | +0.85 | 0.10 | 0.04 | −0.01 | −0.05 | −0.01 | 0.07 |
| Ca i | 15 | +4.28 | −2.06 | 0.06 | +0.40 | 0.07 | 0.03 | −0.00 | −0.02 | 0.00 | 0.10 |
| Sc ii | 8 | +0.82 | −2.33 | 0.12 | +0.12 | 0.12 | −0.00 | 0.05 | −0.03 | 0.01 | 0.19 |
| Ti i | 17 | +2.73 | −2.22 | 0.08 | +0.24 | 0.08 | 0.06 | −0.01 | −0.00 | 0.01 | 0.12 |
| Ti ii | 31 | +2.79 | −2.16 | 0.07 | +0.29 | 0.09 | 0.02 | 0.06 | 0.04 | 0.02 | 0.14 |
| V i | 2 | +1.49 | −2.44 | 0.11 | +0.02 | 0.12 | 0.02 | 0.02 | 0.01 | −0.01 | 0.11 |
| V ii | 2 | +1.72 | −2.21 | 0.10 | +0.24 | 0.11 | −0.01 | 0.06 | 0.01 | 0.01 | 0.00 |
| Cr i | 7 | +3.18 | −2.46 | 0.09 | −0.00 | 0.09 | 0.05 | −0.01 | −0.02 | 0.00 | 0.14 |
| Cr ii | 3 | +3.27 | −2.37 | 0.07 | +0.08 | 0.08 | −0.01 | 0.06 | −0.01 | 0.01 | 0.00 |
| Mn i | 5 | +2.60 | −2.83 | 0.08 | −0.37 | 0.09 | 0.03 | −0.01 | −0.01 | −0.00 | 0.12 |
| Fe i | 118 | +5.04 | −2.46 | 0.05 | +0.00 | 0.00 | 0.04 | 0.00 | 0.02 | 0.01 | 0.23 |
| Fe ii | 18 | +5.06 | −2.44 | 0.09 | +0.00 | 0.00 | 0.00 | 0.06 | 0.00 | 0.01 | 0.16 |
| Co i | 4 | +2.98 | −2.01 | 0.09 | +0.46 | 0.09 | 0.05 | 0.01 | −0.00 | 0.00 | 0.04 |
| Ni i | 9 | +3.89 | −2.33 | 0.08 | +0.14 | 0.08 | 0.05 | −0.00 | 0.00 | 0.00 | 0.13 |
| Cu i | 1 | <+2.49 | −1.70 | +0.76 | |||||||
| Zn i | 2 | +2.22 | −2.34 | 0.11 | +0.12 | 0.11 | 0.02 | 0.02 | −0.01 | 0.01 | 0.10 |
| Sr ii | 2 | +0.68 | −2.19 | 0.22 | +0.25 | 0.19 | 0.04 | 0.03 | −0.12 | 0.02 | 0.00 |
| Y ii | 4 | −0.30 | −2.51 | 0.09 | −0.07 | 0.10 | 0.01 | 0.04 | −0.01 | 0.01 | 0.06 |
| Zr ii | 1 | +0.36 | −2.21 | 0.14 | +0.23 | 0.15 | −0.08 | 0.07 | −0.05 | −0.05 | 0.00 |
| Ba ii | 5 | −0.11 | −2.29 | 0.16 | +0.15 | 0.14 | 0.02 | 0.05 | −0.07 | 0.01 | 0.15 |
| La ii | 3 | <−0.91 | −2.01 | +0.43 | |||||||
| Eu ii | 2 | −1.50 | −2.02 | 0.10 | +0.42 | 0.09 | 0.02 | 0.07 | 0.01 | 0.02 | 0.00 |
| Dy ii | 1 | −0.76 | −1.85 | 0.16 | +0.59 | 0.16 | 0.01 | 0.06 | −0.02 | 0.02 | 0.00 |


Note. Abundances are taken directly from Ji et al. (2020).
Download table as: ASCIITypeset image
4. Indus_13 Abundance Results
We have derived abundances for 24 neutron-capture elements, including lead (Pb) and thorium (Th), in Indus_13. Synthesis of selected elements (Mo i, Os i, and Th ii) is shown in Figure 1 and final abundances including errors are listed in Table 5, where ΔX are the abundance errors due to stellar parameter errors and sX is the systematic error. In addition, individual line abundances are listed in Table 2. For completeness we also include abundances derived for Indus_13 from Ji et al. (2020) in Table 5. All abundances are derived assuming LTE. For the majority of the neutron-capture elements, abundances are derived from the ionized states of the species, for which effects due to departures from LTE (NLTE) are expected to be minimal. For the range of neutron-capture elements analyzed here, to our knowledge, NLTE corrections only exist for Ba and Pb. For Ba, Korotin et al. (2015) find average corrections of ±0.1 dex for the three red Ba ii lines at 5853, 6141, and 6496 Å, two of which are used in this study. However, with a Ba abundance of [Ba/Fe] = +1.29, Indus_13 falls outside the grid of Ba abundances for which Korotin et al. (2015) provide corrections. We therefore use the uncorrected Ba abundance. For Pb, Roederer et al. (2020) derived abundances using the 2203 Å Pb ii line in the UV spectra of three metal-poor stars, yielding higher Pb abundances than results from the more commonly used Pb i line at 4057 Å for all three stars. This confirms that Pb i abundances are likely affected by NLTE effects. We therefore correct our Pb abundance using the grid from Mashonkina et al. (2012), which predicts a correction of + 0.41 dex for the star with the best-matched parameters to Indus_13 (HD 6755; Teff = 5100 K, , and [Fe/H] = − 1.68), resulting in (Pb) =+1.52 for Indus_13.


Figure 1. Synthesis of Mo i, Os i, and Th ii lines in Indus_13. The top panels display the best-fit synthesis (solid lines) to the observed spectrum (black squares) along with ±0.2 dex uncertainty (shaded region). Residuals between the observed spectrum and the various synthesis are shown in the bottom panel. For the Th ii line blended features included in the synthesis are labeled.
Download figure:
Standard image High-resolution imageTable 5. Abundance Summary for Indus_13
| Element | N | [X/H] | σ[X/H] | [X/Fe] | σ[X/Fe] | Δξ | Δ[M/H] | sX | |||
|---|---|---|---|---|---|---|---|---|---|---|---|
| (dex) | (dex) | (dex) | (dex) | (dex) | (dex) | (dex) | |||||
| C-H | 2 | +6.58 | −1.85 | 0.13 | +0.19 | 0.14 | 0.10 | −0.03 | 0.00 | 0.12 | 0.02 |
| C-N | 1 | <+6.11 | −1.72 | +0.33 | |||||||
| O i | 1 | <+8.36 | −0.33 | +1.72 | |||||||
| Na i | 2 | +4.41 | −1.83 | 0.09 | +0.21 | 0.09 | 0.08 | −0.06 | −0.05 | 0.00 | 0.04 |
| Mg i | 8 | +5.86 | −1.74 | 0.06 | +0.30 | 0.08 | 0.05 | −0.04 | −0.02 | 0.01 | 0.11 |
| Al i | 2 | +3.82 | −2.63 | 0.28 | −0.58 | 0.28 | 0.00 | −0.03 | −0.03 | −0.03 | 0.30 |
| Si i | 2 | +5.82 | −1.70 | 0.14 | +0.35 | 0.15 | 0.06 | −0.03 | −0.03 | 0.02 | 0.15 |
| K i | 2 | +3.75 | −1.28 | 0.12 | +0.76 | 0.11 | 0.06 | −0.01 | −0.06 | −0.02 | 0.06 |
| Ca i | 22 | +4.72 | −1.62 | 0.06 | +0.43 | 0.08 | 0.04 | −0.00 | −0.01 | −0.01 | 0.09 |
| Sc ii | 7 | +1.26 | −1.89 | 0.10 | +0.03 | 0.10 | −0.01 | 0.06 | −0.02 | 0.01 | 0.10 |
| Ti i | 17 | +3.23 | −1.72 | 0.09 | +0.33 | 0.09 | 0.07 | −0.01 | −0.01 | −0.01 | 0.16 |
| Ti ii | 25 | +3.31 | −1.64 | 0.10 | +0.28 | 0.09 | 0.02 | 0.07 | 0.02 | 0.05 | 0.15 |
| V i | 2 | +1.99 | −1.94 | 0.11 | +0.10 | 0.12 | 0.01 | −0.01 | −0.01 | −0.07 | 0.07 |
| V ii | 2 | +2.38 | −1.55 | 0.15 | +0.37 | 0.15 | −0.01 | 0.07 | −0.00 | 0.03 | 0.00 |
| Cr i | 15 | +3.65 | −1.99 | 0.10 | +0.05 | 0.09 | 0.07 | −0.01 | −0.01 | −0.01 | 0.14 |
| Cr ii | 2 | +3.76 | −1.88 | 0.09 | +0.04 | 0.08 | −0.01 | 0.07 | −0.01 | 0.03 | 0.00 |
| Mn i | 6 | +3.11 | −2.32 | 0.09 | −0.28 | 0.10 | 0.04 | −0.02 | −0.01 | −0.02 | 0.17 |
| Fe i | 107 | +5.46 | −2.04 | 0.07 | +0.00 | 0.00 | 0.04 | −0.00 | 0.00 | 0.00 | 0.28 |
| Fe ii | 21 | +5.58 | −1.92 | 0.09 | +0.00 | 0.00 | −0.00 | 0.07 | 0.01 | 0.04 | 0.10 |
| Co i | 5 | +3.06 | −1.93 | 0.11 | +0.11 | 0.11 | 0.04 | −0.00 | −0.02 | −0.03 | 0.00 |
| Ni i | 15 | +4.35 | −1.87 | 0.07 | +0.17 | 0.08 | 0.05 | 0.00 | 0.00 | −0.00 | 0.11 |
| Cu i | 1 | <+2.76 | −1.43 | +0.61 | |||||||
| Zn i | 1 | +2.41 | −2.15 | 0.08 | −0.10 | 0.09 | 0.02 | 0.03 | −0.01 | 0.02 | 0.00 |
| Sr ii | 3 | +1.74 | −1.15 | 0.10 | +0.83 | 0.12 | 0.03 | 0.03 | −0.03 | 0.04 | 0.00 |
| Y ii | 17 | +0.88 | −1.28 | 0.10 | +0.71 | 0.13 | 0.01 | 0.07 | −0.06 | 0.04 | 0.13 |
| Zr ii | 13 | +1.64 | −0.93 | 0.10 | +1.06 | 0.12 | 0.01 | 0.06 | −0.04 | 0.02 | 0.00 |
| Mo i | 1 | +0.83 | −1.05 | 0.47 | +0.91 | 0.47 | 0.04 | 0.01 | 0.02 | −0.03 | 0.00 |
| Ru i | 2 | +1.90 | +0.14 | 0.34 | +2.11 | 0.34 | 0.18 | −0.12 | −0.15 | −0.06 | 0.00 |
| Ba ii | 3 | +1.45 | −0.70 | 0.24 | +1.29 | 0.19 | 0.10 | 0.02 | −0.10 | 0.07 | 0.10 |
| La ii | 19 | +0.61 | −0.55 | 0.07 | +1.44 | 0.12 | 0.03 | 0.06 | −0.03 | 0.04 | 0.00 |
| Ce ii | 12 | +0.84 | −0.80 | 0.08 | +1.19 | 0.12 | 0.01 | 0.06 | −0.01 | 0.03 | 0.09 |
| Pr ii | 4 | +0.32 | −0.42 | 0.09 | +1.57 | 0.11 | 0.04 | 0.07 | 0.02 | 0.04 | 0.04 |
| Nd ii | 41 | +1.01 | −0.46 | 0.04 | +1.53 | 0.13 | 0.02 | 0.05 | −0.02 | 0.04 | 0.06 |
| Sm ii | 39 | +0.75 | −0.24 | 0.06 | +1.74 | 0.12 | 0.02 | 0.06 | −0.04 | 0.04 | 0.00 |
| Eu ii | 8 | +0.43 | −0.11 | 0.14 | +1.87 | 0.13 | 0.04 | 0.07 | −0.02 | 0.04 | 0.21 |
| Gd ii | 8 | +0.86 | −0.19 | 0.07 | +1.79 | 0.13 | −0.03 | 0.08 | 0.00 | 0.00 | 0.00 |
| Tb ii | 2 | +0.09 | −0.27 | 0.17 | +1.72 | 0.15 | 0.01 | 0.06 | 0.00 | 0.04 | 0.00 |
| Dy ii | 10 | +1.03 | −0.09 | 0.10 | +1.89 | 0.14 | 0.05 | 0.07 | −0.04 | 0.04 | 0.00 |
| Ho ii | 2 | +0.27 | −0.23 | 0.18 | +1.75 | 0.14 | 0.09 | 0.07 | −0.01 | 0.06 | 0.00 |
| Er ii | 3 | +0.78 | −0.14 | 0.20 | +1.85 | 0.20 | −0.04 | 0.08 | −0.07 | −0.02 | 0.00 |
| Tm ii | 4 | +0.07 | −0.01 | 0.14 | +1.98 | 0.16 | 0.02 | 0.03 | −0.03 | 0.04 | 0.00 |
| Lu ii | 1 | +0.05 | −0.05 | 0.12 | +1.93 | 0.11 | 0.02 | 0.07 | −0.01 | 0.05 | 0.00 |
| Hf ii | 2 | +0.56 | −0.29 | 0.20 | +1.69 | 0.22 | −0.08 | 0.11 | −0.01 | 0.01 | 0.00 |
| Os i | 2 | +1.17 | −0.23 | 0.20 | +1.74 | 0.20 | −0.04 | −0.15 | −0.06 | −0.19 | 0.00 |
| Ir i | 1 | +1.43 | +0.05 | 0.53 | +2.01 | 0.54 | 0.00 | 0.00 | −0.05 | 0.02 | 0.00 |
| Pb i a | 1 | +1.52 | −0.65 | 0.60 | +1.32 | 0.60 | 0.10 | −0.05 | 0.02 | −0.02 | 0.00 |
| Th ii | 2 | −0.23 | −0.25 | 0.22 | +1.73 | 0.21 | 0.04 | 0.03 | −0.05 | 0.02 | 0.00 |


Note. Abundances C to Zn are taken directly from Ji et al. (2020).
a NLTE corrected: ΔNLTE = + 0.41 dex.Download table as: ASCIITypeset image
5. Discussion
5.1. R-process Signature in Indus
Figure 2 displays the derived neutron-capture element abundances for Indus_13 (blue dots) along with the scaled solar system r-process (black line) and s-process (gray line) abundance patterns (Sneden et al. 2008). An average of the abundances from La to Hf has been used for the scaling (Ba was excluded due to possible NLTE effects as described above). It is clear that, for the heavy elements (La−Hf), the abundance pattern of Indus_13 displays a good match to the scaled solar system r-process abundance pattern. Thus Indus_13 was enriched by an r-process nucleosynthesis event and, with an Eu abundance of [Eu/Fe] = +1.81, can be classified as an r-ii star according to the classification scheme of Holmbeck et al. (2020). The other six Indus stream stars exhibit milder enhancements in Eu (+0.40 < [Eu/Fe] < +0.67) with all having [Ba/Eu] < +0.0 (Ji et al. 2020; see also Figure 3) consistent with enrichment from an r-process event. They can thus be labeled r-i stars.

Figure 2. Top panel: neutron-capture element abundances derived for Indus_13 (dots) along with scaled solar system r-process (black line) and s-process (gray line) abundance patterns (Sneden et al. 2008). Bottom panel: residuals between observed abundances and scaled solar system r-process abundance pattern.
Download figure:
Standard image High-resolution image
Figure 3. Light and neutron-capture element abundances for the seven Indus stars and Milky Way halo stars from the JINA base (Abohalima & Frebel 2018) highlighting the separation from the rest of the stars of Indus_0 for the light elements N, Na, and Al, and of Indus_13 for the neutron-capture elements Eu and Ba. Non-local thermal equilibrium-corrected abundances for Na and Al are also shown in the top row, displaying a general shift for all the Indus stars. The dotted line in the [Ba/Eu] plot (bottom middle) marks a pure r-process [Ba/Eu] ratio while the arrows mark a dominant contribution to the neutron-capture elements being from either the s- or r-process (Sneden et al. 2008).
Download figure:
Standard image High-resolution imageAs can be seen from Figure 2, the Th abundance of Indus_13 falls +0.33 dex below what is predicted from the Sneden et al. (2008) solar system r-process abundance pattern. We find , while the Sneden et al. (2008) pattern predicts . This means that Indus_13 joins the sub-group of actinide-poor r-process-enhanced stars. This group also includes the two other r-ii stars in dwarf galaxies for which a Th abundance has been derived: COS 82 in UMi for which Aoki et al. (2007) found and DES J033523−54040 in Reticulum ii (Ret ii) for which Ji & Frebel (2018) found the extremely low ratio . The other extreme is the so-called actinide-boost stars, where the actinides are overproduced relative to the rare-earth elements. Examples include CS 31082−001 with (Hill et al. 2002) and 2MASS J09544277 + 5246414 with (Holmbeck et al. 2018). This abundance signature has been known to exist for some time in MW halo stars, and has also recently been detected in stars associated with the Helmi debris stream (Gull et al. 2021), but actinide-boost stars have yet to be discovered in any present-day surviving dwarf galaxy.


The actinide elements, Th and U, are exclusively produced via the r-process, and modelers have struggled to explain the variations seen in these elements in r-process-enhanced metal-poor stars (Mashonkina et al. 2014). However, recent results from r-process nucleosynthesis modeling suggest that the abundance patterns seen in actinide-poor and actinide-boost stars can be produced by varying the electron fraction (Ye ) distribution within the same r-process site (Holmbeck et al. 2019). The Holmbeck et al. analysis was performed for the r-process nucleosynthesis in neutron-star mergers, which is currently the only r-process element production site that has been directly observed (Drout et al. 2017). A similar analysis of actinide element production in other proposed r-process element production sites such as magneto-rationally driven supernovae and collapsars (Winteler et al. 2012; Siegel et al. 2019) may help to better identify the source of r-process elements in systems like Indus.
Another way to investigate the source of r-process elements in Indus is to calculate the fraction of lanthanide elements to lighter neutron-capture elements—the so-called lanthanide fraction (XLA)—for Indus_13, which can be directly compared to the lanthanide fraction found for the 2017 neutron-star merger GW170817 (Ji et al. 2019). We find for Indus_13 (the error is dominated by systematics). This is somewhat higher than the found for GW170817 but similar to the found for the highly r-process-enhanced stars in the MW halo. This discrepancy between the for GW170817 and the highly r-process-enhanced MW halo stars led Ji et al. (2019) to conclude that neutron-star mergers with more lanthanide-rich ejecta are needed for neutron-star mergers to remain viable as the dominant r-process element production site. It is likely that many of the stars included in the highly r-process-enhanced MW halo sample used for the calculation in Ji et al. (2019) are accreted dwarf galaxy stars similar to Indus_13. With the separation of the halo r-process-enhanced stars into dynamically tied groups, a comparison XLA can be done on a system-by-system basis, allowing us to better characterize the range of lanthanide fractions captured in metal-poor stars.


A further interesting feature of Indus_13, in connection to its r-process enrichment, is its relatively high metallicity. The stars in the Indus stream span a range in metallicity from [Fe/H] = −2.44 to −1.69 (Ji et al. 2020), where Indus_13, with a metallicity of [Fe/H] = −1.92, joins the metal-rich end of this range. With its relatively high metallicity, Indus_13 adds to the sample of r-ii stars in the MW with [Fe/H] > −2 that has emerged in recent years (e.g., Hansen et al. 2018; Roederer et al. 2018a; Sakari et al. 2018). Early exploration and surveys for r-II stars in the MW halo found r-ii stars only in a fairly narrow metallicity range from [Fe/H] = −3.19 to −2.58, suggesting that these stars are preferentially found at the lowest metallicities. On the other hand, the first r-i stars were discovered over a wider metallicity range, extending to metallicities of [Fe/H] ∼ −1.5 (Barklem et al. 2005). However, the recent extensive search for r-process-enhanced stars initiated by the R-Process Alliance (RPA) (Hansen et al. 2018) has found a number of r-ii stars with [Fe/H] > −2. In fact, of the 74 r-II stars discovered in the four RPA data release papers, 21 have [Fe/H] > −2, corresponding to 28%. This percentage is very similar to that found for the 242 r-i stars discovered, where 70 have [Fe/H] > −2, corresponding to 29% (Hansen et al. 2018; Sakari et al. 2018; Ezzeddine et al. 2020; Holmbeck et al. 2020). These results strongly suggest that the metallicity distribution function is the same for r-i and and r-ii stars in the halo. Thus the high metallicity of Indus_13 is not unexpected or unusual since r-ii stars, though rare, are equally likely to be found at high metallicities as r-i stars.
Apart from the MW, r-process-enhanced stars have also been discovered in several classical dwarf galaxies (e.g., Cohen & Huang 2009, 2010) as well as in ultrafaint dwarf (UFD) galaxies. The discovery of r-process-enhanced stars in the UFD galaxies Ret II (Ji et al. 2016; Roederer et al. 2016), Tucana III (Hansen et al. 2017; Marshall et al. 2019), and Grus II (Hansen et al. 2020) supports the idea that r-process-enhanced stars in the MW halo likely found their way into the halo through the accretion and disruption of such smaller systems (Brauer et al. 2019). With the release of kinematic data from the Gaia satellite, this theory has been tested: first on the smaller sample in Roederer et al. (2018b), and most recently by Gudin et al. (2021) on the full literature sample that includes the large number of r-process-enhanced stars discovered as part of the RPA. Both of these find that a number of r-process stars cluster in groups sharing kinematic features, suggesting that the stars were likely stripped from the same parent object. Indus_13, as the first highly r-process-enhanced star to be discovered in a disrupted dwarf galaxy stream, along with the recent discovery of r-process-enhanced stars in the Helmi debris, Helmi tail, and ω Centauri progenitor streams (Gull et al. 2021), thus provides a vital observational link supporting the accretion origin for r-process-enhanced stars. In addition, as is pointed out by Gull et al. (2021), many r-process-enhanced stars in the MW halo likely come from relatively massive galaxies that have experienced multiple r-process events and not just from UFD galaxies. As a consequence, we should expect to find stronger kinematic clustering among these stars from larger galaxies, compared with the smaller number of stars accreted from small galaxies.
5.2. A Globular Cluster Star in Indus
The Indus stream contains a second chemically distinct star, namely Indus_0, for which Ji et al. (2020) found [N/Fe] = +1.16, [Na/Fe] = +0.94, and [Al/Fe] = +0.32, clearly separating it from the other Indus stars for these elements, as can be seen in Figure 3. The abundances for other elements in this star, however, are very similar to those for the rest of Indus sample. Since both Na and Al are known to be affected by NLTE effects we have also plotted the NLTE-corrected abundances for Na and Al for the Indus stars in Figure 3 using corrections from Lind et al. (2011) and Nordlander & Lind (2017), respectively. These corrections mainly result in an overall shift of the Na and Al abundances of the Indus stars and do not change the status of Indus_0 as an outlier.
With high N, Na and Al abundances, Indus_0 is similar to the abundance pattern found in so-called "second-generation" stars in globular clusters. Such stars show distinct enhancements in N, Na and Al abundances coupled with depletions in C, O, and Mg relative to the abundances of "first-generation" or "primordial" stars in the cluster. While the enrichment process is not understood, it is clear that nuclear-burning cycles, like the CNO, Ne−Na, and Mg−Al cycles, are involved in generating the variations in the light element abundance pattern of the stars (e.g., Gratton et al. 2019). The presence of these light element abundance variations is a characteristic of globular clusters, and there is no evidence of such correlated light-element abundance variations occurring in dSph or UFD field stars (e.g., Shetrone et al. 2003; Norris et al. 2017; Salgado et al. 2019). It should be noted that, with a metallicity of [FeII/H] = −2.44, a globular cluster progenitor of Indus_0 would be among the most metal-poor globular clusters known (Beasley et al. 2019). However, Letarte et al. (2006) have shown from high-dispersion analyses of a small number of stars that similar abundance anomalies are found in the Fornax globular clusters that are only slightly more metal rich (see the discussion below).
The spread in metallicity and the velocity dispersion of the Indus stream firmly point to it being a disrupted dwarf galaxy (Li et al. 2019; Ji et al. 2020). However, given that Indus_0 is in the observed sample, and given the apparent lack of globular cluster second-generation abundance pattern stars in the field populations of other dSph and UFD systems, the inevitable conclusion from our data is that the Indus progenitor possessed a globular cluster in which Indus_0 formed.
Excluding the most massive MW satellites (Magellanic Clouds and Sagittarius) globular clusters have been detected in association with only two MW dwarf galaxies; Fornax and Eridanus 2 (Huang & Koposov 2021). Specifically, one faint (MV ≈ −3.5) cluster has been detected in the ultrafaint system Eridanus 2 (Koposov et al. 2015; Crnojević et al. 2016), while Fornax has six globular clusters (Wang et al. 2019). The Fornax globular clusters have long been known to be old and metal-poor (e.g., Zinn & Persson 1981; Buonanno et al. 1998, 1999; Strader et al. 2003), and Larsen et al. (2012) found that the four most metal-poor clusters, which have −2.5 < [Fe/H] < −2, match the metal-poor tail of the Fornax field star abundance distribution. Further, Larsen et al. (2014) have estimated the nitrogen abundances of red giants in these four clusters using multi-band HST imaging. They find a range in N abundance of Δ[N/Fe] ∼ +2 dex, with roughly equal numbers of N-normal and N-enhanced stars in each cluster. Together with the small sample of Fornax globular cluster red giants analyzed at high dispersion discussed in Letarte et al. (2006), these results point to the existence of multiple stellar populations in the Fornax globular clusters, with properties very similar to those seen in MW globular clusters. The inference that can be drawn from the Indus stars is then a similar picture to Fornax, with Indus_0 originating in a metal-poor globular cluster in which multiple stellar populations existed, and which was associated with the Indus progenitor.
Aside from the ongoing accretion and disruption of the Sgr dwarf, which possesses at least six associated globular clusters (e.g., Da Costa & Amandroff 1995; Law & Majewski 2010; Massari et al. 2019; Vasiliev 2019), our abundance results for the Indus stream members provide the first evidence for the accretion of a dwarf galaxy that contained at least one globular cluster. Other kinematic studies have found evidence for potentially similar events. For example, Malhan et al. (2019) found a cocoon of stellar material associated with the globular cluster stream GD-1, which they interpret as the remnants of the dwarf galaxy with which GD-1 was accreted. Similar analysis of the Jhelum stream has revealed a two-dimensional structure for this stream with a thin dense component and a more diffuse component (Bonaca et al. 2019). These components may represent distinct but related progenitors (Bonaca et al. 2019). In the context of the Indus stream results, this scenario is intriguing as it has been suggested that the Indus and Jhelum streams are two wraps of the same stream (Shipp et al. 2018; Bonaca et al. 2019). None of the Jhelum stars analyzed, however, displays abundance patterns compatible with a globular cluster origin (Ji et al. 2020). We note for completeness that no current Galactic globular cluster has been found to have orbital characteristics similar to those of the Indus stream in the study of Riley & Strigari (2020).
5.3. The Nature of the Indus Stream Progenitor
Apart from clues from various nucleosynthesis channels, the chemical signature and specific abundance trends of a stream also provide some information on the nature of the stream progenitor. For example, streams originating solely from globular clusters can be separated from dwarf galaxy streams using properties such as the presence or absence of iron abundance spreads, stream width, and velocity dispersion (e.g., Figure 4 of Ji et al. 2020). For dwarf galaxy streams, the mean metallicity and the iron abundance of the "knee" in the ([α/Fe], [Fe/H]) relation can also yield information on the stellar mass or luminosity of the progenitor (Kirby et al. 2011). We now use our information and that in Ji et al. (2020) to place constraints on the Indus stream progenitor.
Of the present-day intact dwarf spheroidal galaxies, a mixture of r-i and r-ii stars has been discovered in three systems: Ursa Minor (UMi), Draco, and Fornax (Shetrone et al. 2001; Cohen & Huang 2009; Letarte et al. 2010; Lemasle et al. 2014). r-i stars are also known to be present in Carina (Shetrone et al. 2003; Venn et al. 2012) and Sculptor (Kirby & Cohen 2012). Figure 4 shows the [Eu/Fe] abundances as a function of metallicity for the r-i and r-ii stars in Draco, UMi, Fornax, and Indus. For the dwarf galaxies, the stellar sample is that compiled in Hansen et al. (2017), where r-process-enhanced stars in dwarf galaxies were selected to have [Eu/Fe] > +0.3 and [Ba/Eu] < −0.4. The latter criterion is to ensure the stars were predominantly enriched by an r-process event as opposed to the slow neutron-capture process (s-process), which also produces both Ba and Eu but in a different ratio (Sneden et al. 2008). In Figure 4 we also include three of the recently re-analyzed Fornax stars from Reichert et al. (2021) satisfying the above criteria. In metallicity, the Indus stream stars mostly overlap with the r-process-enhanced stars found in Draco and UMi, whereas the r-i and r-ii stars in the more massive Fornax galaxy generally have higher metallicities, and those in the small ultrafaint, Ret II galaxy are predominantly found at lower metallicities. This suggests that the Indus's progenitor was a relatively massive galaxy with efficient chemical enrichment, similar to UMi. It should be noted, however, that the Indus stars selected for high-resolution follow-up, and thus included in this study, were preferentially selected to be metal-poor. Ongoing analysis of medium-resolution spectra for a larger sample of Indus stream stars finds a mean metallicity for the stream of [Fe/H] = −1.97 (A. B. Pace et al. 2021, in preparation). Consequently, a similar analysis of a larger sample of Indus stars would likely increase the overlap with the Fornax sample.

Figure 4. [Eu/Fe] as a function of metallicity for r-i and r-ii stars in the Draco, UMi, and Fornax dwarf spheroidal galaxies and the ultrafaint dwarf galaxy Ret II compared to the Indus stream stars.
Download figure:
Standard image High-resolution image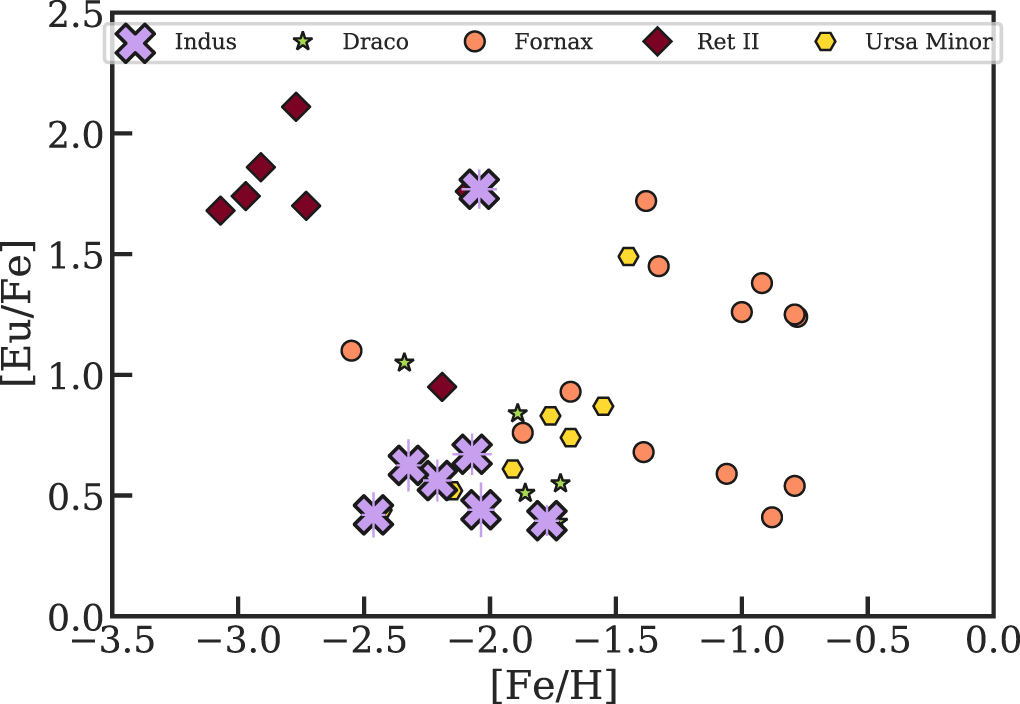
The chemical enrichment efficiency of a galaxy, and by proxy its mass, can also be estimated from the evolution of the α-element abundances with metallicity. The galaxy will initially be enriched by a population of massive stars. These have short lifetimes that end in Type II supernovae explosions resulting in an α-enhanced enrichment. After this initial enrichment, lower mass and more slowly evolving stars are formed, and eventually Type Ia supernovae will contribute to the chemical signature of the system, resulting in a decrease in the α to Fe ratio of the system, also known as the α-knee (Tinsley 1979). The metallicity at which this transition in [α/Fe] occurs reflects the chemical enrichment efficiency of the galaxy: in a low-mass galaxy, the α-knee will appear at lower metallicities than in a high-mass galaxy.
All the Indus stream stars for which detailed abundances have been derived are enhanced in the α-elements (〈[Mg/Fe]〉 = +0.40, 〈[Si/Fe]〉 = +0.49, 〈[Ca/Fe]〉 = +0.43), suggesting that the location of the α-knee of the Indus stream progenitor is at higher metallicity than the most metal-rich star included in Ji et al. (2020), which has [FeII/H] = −1.69. A recent abundance reanalysis of high-resolution data for stars in Fornax and UMi has found the α-knee in these two galaxies to be located at [Fe/H] = −1.6 and [Fe/H] = −2.2, respectively, and predicted the location in Draco to be [Fe/H] = −2.1 (Reichert et al. 2020). Comparing these numbers to the metallicity of the Indus stars supports the hypothesis from the Eu abundances that the Indus progenitor was likely a dwarf galaxy whose mass exceeded that of UMi but which may not have been as massive as Fornax.
We can also use the fact that the Indus progenitor likely possessed at least one globular cluster to estimate its luminosity by calculating the normalized globular cluster specific frequency SN (see Harris & van den Bergh 1981 and Huang & Koposov 2021 for the definition of SN ). For a system such as Fornax with MV = −13.4 (McConnachie 2012) one globular cluster results in SN = 4.5 while the same number for UMi with MV = −8.8 (McConnachie 2012) is ≈300. An SN of 300 is high compared to what is generally found for the Local Group (Mackey et al. 2019) and seems unlikely given the results of Huang & Koposov (2021) on the MW satellites, thus supporting our contention that the luminosity of the Indus progenitor likely exceeded that of systems such as UMi. This is also in agreement with the initial estimate from Shipp et al. (2018) of the Indus progenitor's dynamical mass when it was stripping stars to the stream of 6.5 × 10⁶ M⊙ based on the width of the stream. In this context we also note that the postulated Indus globular cluster was unlikely to have been of low luminosity or mass. As shown by Lagioia et al. (2019) and Milone et al. (2020) for example, globular clusters that possess multiple populations tend to have relatively large initial masses: only a few clusters with initial masses above 105 M⊙ lack multiple populations, while those that do not show multiple populations are generally of low mass (Lagioia et al. 2019; Milone et al. 2020).
6. Summary
In this paper, we have taken a closer look at the chemical signature of the Indus stream, a disrupted dwarf galaxy recently discovered in the DES data (Shipp et al. 2018) and further characterized by the S5 project (Li et al. 2019; Ji et al. 2020). In particular, a detailed neutron-capture element abundance analysis is presented for the highly r-process-enhanced star Indus_13. The neutron-capture element abundances in this star display a good match to a scaled solar system r-process abundance pattern, confirming an r-process nucleosynthesis origin for these elements. With a slightly low abundance of the actinide element Th, Indus_13 joins the subclass of actinide-poor r-process-enhanced stars, which also includes one of the r-process-enhanced stars each in Ret II and UMi (Aoki et al. 2007; Ji & Frebel 2018). The metal-rich nature of Indus_13 ([Fe/H] = −1.92) along with the general α-enhancement seen in all the Indus stars point to the Indus progenitor being a chemically evolved dwarf galaxy. In addition to Indus_13, we also discuss the globular cluster-like star Indus_0 which shows enhanced N, Na, and Al abundances. It is likely that this star formed in a globular cluster associated with the Indus stream progenitor. Stars with similar abundance patterns have also been seen in the globular clusters associated with the Fornax dwarf spheroidal galaxy (Letarte et al. 2006; Larsen et al. 2014). Taking into account all available information, we conclude that the Indus progenitor was a chemically evolved dwarf galaxy that contained at least one globular cluster and which had a mass that likely exceeded that of UMi but which was less than that of Fornax.
The authors thank the referee for a careful reading of the manuscript.
T.T.H. acknowledges generous support from the George P. and Cynthia Woods Institute for Fundamental Physics and Astronomy at Texas A&M University. A.P.J. acknowledges support from a Carnegie Fellowship and the Thacher Research Award in Astronomy. A.B.P. is supported by NSF grant AST-1813881. T.S.L. is supported by NASA through Hubble Fellowship grant HST-HF2-51439.001 awarded by the Space Telescope Science Institute, which is operated by the Association of Universities for Research in Astronomy, Inc., for NASA, under contract NAS5-26555. A.R.C. is supported in part by the Australian Research Council through a Discovery Early Career Researcher Award (DE190100656). Parts of this research were supported by the Australian Research Council Centre of Excellence for All Sky Astrophysics in 3 Dimensions (ASTRO 3D), through project number CE170100013.
This research made extensive use of the SIMBAD database operated at CDS, Straasburg, France, Wenger et al. (2000), arXiv.org, and NASA's Astrophysics Data System for bibliographic information.
This work presents results from the European Space Agency (ESA) space mission Gaia. Gaia data are being processed by the Gaia Data Processing and Analysis Consortium (DPAC). Funding for the DPAC is provided by national institutions, in particular the institutions participating in the Gaia MultiLateral Agreement (MLA). The Gaia mission website is https://www.cosmos.esa.int/gaia. The Gaia archive website is https://archives.esac.esa.int/gaia.
This project used public archival data from the Dark Energy Survey (DES). Funding for the DES Projects has been provided by the U.S. Department of Energy, the U.S. National Science Foundation, the Ministry of Science and Education of Spain, the Science and Technology Facilities Council of the United Kingdom, the Higher Education Funding Council for England, the National Center for Supercomputing Applications at the University of Illinois at Urbana-Champaign, the Kavli Institute of Cosmological Physics at the University of Chicago, the Center for Cosmology and Astro-Particle Physics at the Ohio State University, the Mitchell Institute for Fundamental Physics and Astronomy at Texas A&M University, Financiadora de Estudos e Projetos, Fundação Carlos Chagas Filho de Amparo à Pesquisa do Estado do Rio de Janeiro, Conselho Nacional de Desenvolvimento Científico e Tecnológico and the Ministério da Ciência, Tecnologia e Inovação, the Deutsche Forschungsgemeinschaft, and the Collaborating Institutions in the Dark Energy Survey. The Collaborating Institutions are Argonne National Laboratory, the University of California at Santa Cruz, the University of Cambridge, Centro de Investigaciones Energéticas, Medioambientales y Tecnológicas-Madrid, the University of Chicago, University College London, the DES-Brazil Consortium, the University of Edinburgh, the Eidgenössische Technische Hochschule (ETH) Zürich, Fermi National Accelerator Laboratory, the University of Illinois at Urbana-Champaign, the Institut de Ciències de l'Espai (IEEC/CSIC), the Institut de Física d'Altes Energies, Lawrence Berkeley National Laboratory, the Ludwig-Maximilians Universität München and the associated Excellence Cluster Universe, the University of Michigan, the National Optical Astronomy Observatory, the University of Nottingham, The Ohio State University, the OzDES Membership Consortium, the University of Pennsylvania, the University of Portsmouth, SLAC National Accelerator Laboratory, Stanford University, the University of Sussex, and Texas A&M University. Based in part on observations at Cerro Tololo Inter-American Observatory, National Optical Astronomy Observatory, which is operated by the Association of Universities for Research in Astronomy (AURA) under a cooperative agreement with the National Science Foundation.
Facility: Magellan:Clay. -
Software: MOOG (Sneden 1973; Sobeck et al. 2011), IRAF (Tody 1986, 1993), ATLAS9 (Castelli & Kurucz 2003), linemake (https://github.com/vmplacco/linemake), NumPy (van der Walt et al. 2011), Matplotlib (Hunter 2007), AstroPy (Astropy Collaboration et al. 2013, 2018), CarPy (Kelson 2003), SMHR (Casey 2014).
Footnotes
- 23
- 24
- 25
- 26