


Abstract
The Maunder Minimum (MM; 1645–1715) is currently considered the only grand minimum within telescopic sunspot observations since 1610. During this epoch, the Sun was extremely quiet and unusually free from sunspots. However, despite a reduced frequency, candidate aurorae were reported in the mid-European sector during this period and have been associated with occurrences of interplanetary coronal mass ejections (ICMEs), although some of them have been identified as misinterpretations. Here, we have analyzed reports of candidate aurorae on 1680 June 1 with simultaneous observations in central Europe, and compared their descriptions with visual accounts of early modern aurorae. Contemporary sunspot drawings on 1680 May 22, 24, and 27 have shown a sunspot. This sunspot may have been a source of ICMEs, which caused the reported candidate aurorae. On the other hand, its intensity estimate shows that the geomagnetic storm during this candidate aurora was probably within the capability of the storms derived from the corotating interaction region (CIR). Therefore, we accommodate both ICMEs and CIRs as its possible origin. This interpretation is probably applicable to a number of candidate aurorae in the oft-cited Hungarian catalog, on the basis of the reconstructed margin of their equatorward auroral boundary. Moreover, this catalog itself has clarified that the considerable candidates during the MM were probably misinterpretations. Therefore, the frequency of the auroral visibility in Hungary was probably lower than previously considered and agrees more with the generally slow solar wind in the existing reconstructions, whereas sporadic occurrences of sunspots and coronal holes still caused occasional geomagnetic storms.
Export citation and abstract BibTeX RIS
1. Introduction
Among the coverage of direct solar observations for the last four centuries, the Maunder Minimum (MM; 1645–1715) was the only grand minimum characterized with extremely suppressed solar cycles, asymmetric sunspot occurrences, and the probable loss of significant streamers from the solar corona (Eddy 1976; Ribes & Nesme-Ribes 1993; Riley et al. 2015; Usoskin et al. 2015; Vaquero et al. 2015; Owens et al. 2017; Hayakawa et al. 2021; Silverman & Hayakawa 2021). Such characteristics are quite unique within the coverage of direct solar observations, even in contrast with the Dalton Minimum and the usual cycle minima (Clette et al. 2014; Hathaway 2015; Owens et al. 2017; Muñoz-Jaramillo & Vaquero 2019; Hayakawa et al. 2020a, 2020b), and are associated with a special state of the solar-dynamo behavior (e.g., Charbonneau 2020). Being the only grand minimum within the coverage of direct solar observations, the MM forms a reference for other grand minima confirmed in the proxy reconstructions based on cosmogenic isotopes (Muscheler et al. 2007, 2016; Usoskin et al. 2007; McCracken & Beer 2014, 2015; Inceoglu et al. 2015; Usoskin 2017; Wu et al. 2018). Accordingly, open solar flux and the interplanetary magnetic field were probably weakened more than during the normal solar minima, although their exact amplitude are still under discussion (Beer et al. 1998; Cliver & Ling 2011; Owens & Lockwood 2012; Cliver et al. 2013; Lockwood 2013; Svalgaard 2013; Lockwood & Owens 2014; Usoskin et al. 2015, 2017; Vaquero et al. 2015; Zolotova & Ponyavin 2015, 2016; Svalgaard & Schatten 2016; Owens et al. 2017; Hayakawa et al. 2021).
This variability probably influenced the frequency of solar eruptions as well, although the significance of this influence has not yet been clearly determined. Statistical analyses imply that the occurrence rate of interplanetary coronal mass ejections (ICMEs) was somewhat independent and probably comparable between recent solar minima (2008/2009 and 1996/1997) and the MM (Owens & Lockwood 2012). In fact, the occurrences of large ICMEs and geomagnetic storms have been shown without an exact correlation with sunspot number (Kilpua et al. 2015; Lefèvre et al. 2016); some extreme ICMEs and geomagnetic storms are known to occur even around deep solar minima (Garcia & Dryer 1987; Daglis et al. 2007; Hayakawa et al. 2020c).
It is challenging to directly track solar eruptions during the MM, given its occurrence far before the onset of geomagnetic observations (Usoskin et al. 2015). Nevertheless, major solar eruptions leave a footprint as mid- to low-latitude aurorae, if they cause a long-lasting southward interplanetary magnetic field in ICMEs, and/or their front-side sheath region, resulting in geomagnetic storms (Gonzalez et al. 1994; Daglis et al. 1999; Tsurutani et al. 2003; Cliver & Dietrich 2013). Even before the onset of magnetic observations, such candidate aurorae have been recorded for millennia in historical documents (Siscoe 1980; Silverman 1992, 1998; Stephenson et al. 2004; Vaquero & Vázquez 2009; Schlegel & Schlegel 2011; Hayakawa et al. 2017, 2019b; Silverman & Hayakawa 2021). Archival investigations show that the candidate aurorae seemed to be reported in the European sector even during the MM (Eddy 1976, 1983; Mendillo & Keady 1976; Link 1977; Schröder 1978, 1988, 1992; Siscoe 1980; Feynman & Gabriel 1990; Schlamminger 1990, 1991; Legrand et al. 1991; Silverman 1992, 1993, 1998; Letfus 2000; Lockwood & Barnard 2015; Riley et al. 2015; Usoskin et al. 2015, 2017; Zolotova & Ponyavin 2015, 2016; Vázquez et al. 2016; Ogurtsov 2019). Some of these studies have arguably highlighted their reduced frequency and limited pairing with the observation of source sunspots, but associated them with ICMEs based on their latitudinal distributions (Letfus 2000; Riley et al. 2015; Usoskin et al. 2015; Vázquez et al. 2016).
However, a caveat must be noted in that the interactions of the high-speed coronal hole streams with the upstream slow-speed streams can generate corotating interaction regions (CIRs; Smith & Wolfe 1976; Gosling et al. 1978; Tsurutani et al. 1995, 2006; Richardson et al. 2002, 2006; Gopalswamy et al. 2015) and cause moderate geomagnetic storms and midlatitude aurorae (e.g., Tsurutani & Gonzalez 1987; Usoskin et al. 2015; Vázquez et al. 2016; Bhaskar et al. 2020). As the majority of such midlatitude auroral candidates were reported without plausible source sunspots and remained in medium geographic latitudes, it is still controversial how many of these aurorae resulted from solar eruptions (Letfus 2000; Zolotova & Ponyavin 2016; Usoskin et al. 2017).
Furthermore, careful analyses of the original historical records are needed to assess the reliability and magnitude of these reported candidate aurorae. In fact, it has been confirmed that some candidate aurorae were probably misinterpretations of other phenomena such as atmospheric optics (e.g., lunar halos) and hence should be excluded from discussions on the auroral activity during the MM (e.g., Rethly & Berkes 1963; Kawamura et al. 2016; Usoskin et al. 2017). On the other hand, the extent of the equatorial auroral boundary shows a fairly good correlation with the intensity of the associated geomagnetic storms (Yokoyama et al. 1998) and hence should be reconstructed based on the reported details (e.g., Hayakawa et al. 2018). Their origin could be inferred on the basis of contemporary sunspot observations (e.g., Letfus 2000; Willis et al. 2005), and compared to reconstructed storm intensity with the observed threshold of CIR storms (e.g., Richardson et al. 2006).
In this context, it is important to analyze likely robust geomagnetic storms in the core MM during the period 1650–1700 (Vaquero & Trigo 2015; Vaquero et al. 2015; see also Svalgaard & Schatten 2016). One such case was a major auroral storm in 1653 March confirmed by simultaneous observations in East Asia (Willis & Stephenson 2000; Isobe et al. 2019). Another candidate case with simultaneous observations is known from 1680 May (Fritz 1873; see also Schröder 1978). Here, we examine its reported details from multiple observations in central Europe to assess their reliability and reconstruct its spatial extent. We also investigate contemporary solar observations around this event and consider their plausible solar source. On their basis, we empirically infer both storm magnitude and source, to derive further implications for space weather variability during the MM.
2. Interpretation of the "Fire-sign" on 1680 June 1
The original source documents for the simultaneous candidate aurorae are found in the journal Neue Himmels Zeitung (Kirch 1681), which Gottfried Kirch (1639–1710) compiled. The recorded signs in Kirch (1681) were summarized as "the great fire-sign, which appeared at many places in Germany, particularly at Leipzig/Hamburg/Lübeck and other places on May 22 in the Sky early in the day" and interpreted as candidate aurorae in Fritz (1873) and Schröder (1978). In his publication, Kirch has collected the reports for this "fire-sign" from witnesses, whereas he himself missed this display. Reports around Hamburg were derived from Planeten-Versamblung im Majo und Junio 1680, a German pamphlet (Voigt 1681), which the astronomer Johann Heinrich Voigt (1613–1691) compiled. As the Julian calendar was in use in Germany before 1700, this date should be converted to June 1 in the Gregorian calendar (e.g., Von Aufgebauer 1969).
According to Kirch (1681) and Voigt (1681), this fire-sign was reported widely around the western coast of the Baltic Sea and Leipzig (Figure 1) "early in the day" on June 1, namely during the night between 1680 May 31 and June 1. The longest duration of the fire-sign was reported at Leipzig, between 1 hr local time (LT) and daybreak (03:48 LT), from multiple witnesses. With variable onsets, this fire-sign persisted up to 3–4 hr LT (Kirch 1681, pp. 3–5; Voigt 1681, p. 1), which is mostly consistent with the computed timing of local daybreaks (e.g., 03:34 LT at Lübeck, and 03:25 LT at Nyborg).
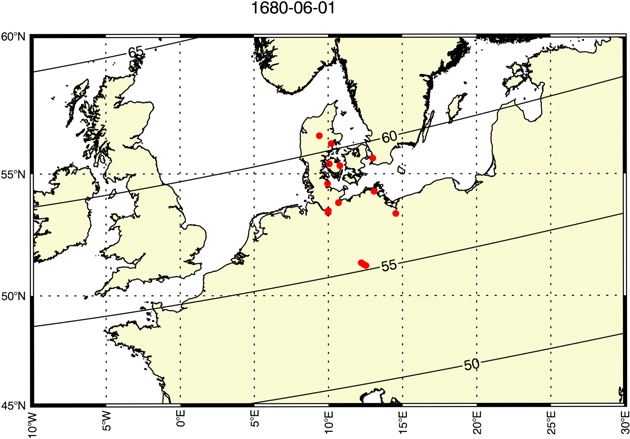
Figure 1. Observational sites of the "fire-sign" in comparison with the contours of the magnetic latitude (MLAT) for every 5°, based on the archeomagnetic field model Cals3k4b (Korte & Constable 2011).
Download figure:
Standard image High-resolution imageThis sign seemed to occupy a large part of the sky, especially northward. Haarburg (N53°28', E09°59') witnessed rays "rising like a lightning flash against NE, or in fact NNE" (Kirch 1681, p. 7). At Leipzig (N51°20', E12°23') its extension was witnessed probably overhead. A witness reported, "the whole sky which I could see toward west was filled with fiery mist" and "toward East, it was beautiful blue and brightly starred" (Kirch, 1680, p. 3). Over Carlsburg (N54°37', E09°57'), a witness stated "in all four directions of the sky appeared a great number of folks with different figures and clothing among which those of the NNE persisted the longest time" (Kirch, 1680, pp. 6–7).
This fire-sign was described as glow and strokes with various colors (reddish, bluish, golden, and silvery). At Leipzig, it was described as "reddish or fiery fog" and "fiery mist" (Kirch 1681, p. 3). At Haarburg, the reported rays were "a snake head and the rays shooting against, like VΛVΛV could well have presented a figure like a curved snake" (Voigt 1681, p. 3). At Hamburg, "On top there was a bright star, wherefrom the fire or the rays were broader and downwards they become smaller, like angles and tips, like VΛVΛV staying against each other" (Voigt 1681, p. 3). Overall, its shape was variably described as rays, fiery cloud, fire fall, open of sky, serpent, long beams, cloths with variable letters, and balls with curved trails (Voigt 1681, pp. 2–4; Kirch 1681, pp. 3–5). Its shape varied in time, as shown in Figure 2 (from N° 1 to N° 3) for a specific case at Lübeck (N53°52', E10°41'), for example. Contemporaries at Lübeck heard "some noise and strong bangs from shooting" (Voigt 1681, p. 5), "as if a rocket would be in the air" and "as if a musket was fired" (Kirch 1681, pp. 5–6).
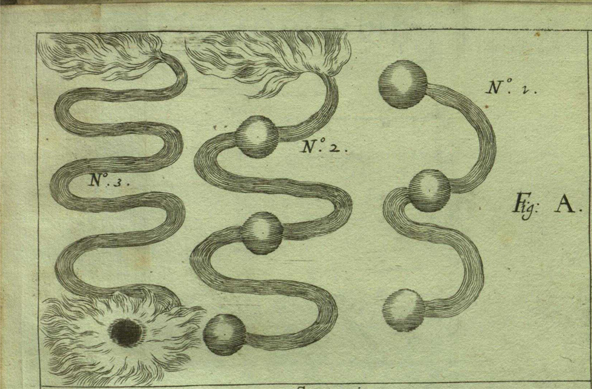
Figure 2. Depicted shape of the "fire-sign" reported from Lübeck on 1680 June 1, reproduced from Kirch (1681).
Download figure:
Standard image High-resolution imageIts interpretation is challenging, as not all the reported details fit together well. The visual accounts favor the auroral interpretation in Fritz (1873) and Schröder (1978), whereas the acoustical details sound like a fireball. Kirch immediately rejected the contemporary proposals of the anomalous planetary motion and possible solar halo, due to its motion and observational time. Atmospheric optics would contradict the reported colorations and extents, as its coloration in the night sky is virtually invisible and they should stay around the Moon (Minnaert 1993, pp. 219–213). Fireballs seem to be a favorable explanation, with reported sizzling like a rocket, and the bang and crackle noise. However, this description is inconsistent with the reported curved shape and long persistence, since fireballs fly linearly and do not last that long. In addition, a witness at Fuchshan (probably "Fuchshain" close to Leipzig) reported a "whimsical cloud" remaining after the disappearance of bright lines. The shape depicted in Figure 2 is far from what should be expected for the trail of fireballs.
This leaves Fritz and Schröder's auroral interpretation still plausible, with the support of other simultaneous observations (see Willis & Stephenson 2000). The strongest counter argument is the reported noise, which was heard locally from Lübeck and could be associated with oft-reported auroral audibility (Silverman & Tuan 1973). In fact, the reported directions, motions, and colorations are consistent with the behavior of midlatitude aurorae. The observational directions concentrated more toward the north, while the sign itself had a wider extent. The reported rays centered northeast to north-northeast at Haarburg. The north-northeast part lasted the longest at Carlsburg, even though this sign appeared in all four directions of the sky. This is also the case of its reported motions, with notable variability within hours (Figure 2). The reported colourations are dominantly reddish with some parts being whitish (silvery), bluish and yellowish (golden). The reddish glow agrees with the OI emissions in 630.0 nm or stable auroral red (SAR) arcs typical of midlatitude aurorae (Tinsley et al. 1984; Kozyra et al. 1997). The whitish glows are typically greenish emissions (557.7 nm) without enough brightness and typically seen in the ray structure (Ebihara et al. 2017; Stephenson et al. 2019; Bhaskar et al. 2020). The yellowish (golden) color could be their mixture. The bluish emissions could be sunlit aurorae derived from  emissions of 427.8 nm in the upper atmosphere at 600–1100 km (Hunten 2003; c.f, Shiokawa et al. 2019).
The event occurrence from 1–4 hr LT on June 1 indicates its visibility during twilight, and indicates that some of the electrons possibly precipitated into the sunlit area in the upper atmosphere and likely caused sunlit aurorae with a bluish coloration (see, e.g., Hunten 2003). In fact, the eastward visibility of the bluish colouration at Leipzig at 1–2 hr LT is also consistent with this scenario, as the Sun was situated more eastward below the horizon during the morning sector. The visibility in twilight also indicates its significant brightness, as confirmed in case reports during major geomagnetic storms in 1859 August, 1870 October, 1872 February, and 1921 May (Silverman & Cliver 2001; Vaquero et al. 2008; Hayakawa et al. 2019a). Bright aurorae lasting from dawn to daybreak are also reported in more moderate storms. On 1860 August 6, aurorae were reported in New York, "From 2 A.M. to daybreak, auroral beams were observed, many of them colored and shooting up to the zenith with occasional waves of light" (Hough 1872, p. 311). This chronologically agrees with an occurrence of geomagnetic disturbance at Helsinki (Nevanlinna 2004, 2006). The daybreak had unfortunately obscured its actual end, contrary to its onset at 1 hr LT.
Figure 1 shows the observational sites of this candidate aurora in comparison with the MLAT computed with the archeomagnetic field model Cals3k4b (Korte & Constable 2011). This shows the equatorial extent of the auroral visibility down to 55.3° MLAT. The overhead visibility at Leipzig (55.3° MLAT) locates the footprint of the magnetic field line for the equatorial boundary of the auroral oval below 56.5° MLAT, under assumption that the auroral upper height is ≈400 km (Roach et al. 1960; Ebihara et al. 2017). With the aid of the empirical model suggested by Yokoyama et al. (1998), the minimal disturbance storm time (Dst) is estimated to be −65 nT from this equatorward extent. However, we have to note that visual aurorae were seen overhead at London at 54.0° MLAT (Hallissey 1974; Knipp et al. 2018) during the major geomagnetic storm of 1972 August 4 (minimal Dst = −125 nT). The stronger dipole moment of the Earth in 1680 (≈1.2 times the modern one; see Figure 4 of Korte & Constable 2011) probably makes this estimate rather conservative, as this increase would require the equatorial boundary of the auroral oval to be put ≈1° MLAT poleward (Ebihara & Tanaka 2021). As such, intensity of this candidate storm can be considered even comparable to the 1972 storm (minimal Dst ≥ −125 nT). This analysis is fairly consistent with Figure 3 of Yokoyama et al. (1998), showing that Dst ranges from −30 to −100 nT for the equatorward boundary of 56.5° MLAT.
3. Solar Surface on 1680 May 20–30 and Possible Solar Origins
Interestingly, these reported candidate aurorae chronologically coincide with the occurrence of sunspots in late 1680 May, based on Gian Domenico Cassini and Gottfried Kirch's sunspot observations (Hoyt & Schatten 1998a, 1998b; Neuhäuser et al. 2018). Cassini reported visibility of a large sunspot from May 20–30: "We observed on May 20th a large spot on the Sun; it was already advanced on the disk of this star; it ceased to appear by passing over the upper Hemisphere of the Sun on the 30th of the same month" (Académie des sciences 1733, pp. 317–318).
Kirch probably witnessed the same sunspot on May 22–27 (Hoyt & Schatten 1998a, 1998b) and May 28 (Neuhäuser et al. 2018) but not on May 29 (Hoyt & Schatten 1998a, 1998b; Neuhäuser et al. 2018). This sunspot was located in −0 6 ± 132 at its latitude (Neuhäuser et al. 2018), based on Kirch's published drawing on 1680 May 22 (Kirch 1681, pp. 10). Fortunately, our investigations at Paris Observatory located his original manuscripts with sunspot drawings on 1680 May 12, 14, and 17 in the Julian calendar, i.e., 1680 May 22, 24, and 27 as per the Gregorian calendar (Figure 3). This figure explicitly shows the visibility of the said sunspot in the western hemisphere.

Figure 3. Gottfried Kirch's sunspot drawings on 1680 May 12, 14, and 17 in the Julian calendar, adapted from MS B 3/1 A at Paris Observatory (courtesy of l'Observatoire de Paris). The original dates are given in the Julian calendar; their dates are converted to 1680 May 22, 24, and 27 as per the Gregorian calendar.
Download figure:
Standard image High-resolution imageIts chronological coincidence with the candidate aurora on 1680 June 1 appears to be more than just a chance. While ICMEs from the central meridian tend to be more geoeffective, they are still reportedly capable of causing major storms (−300 nT < minimal Dst ≤ −100 nT) in the western hemisphere (e.g., Figure 28 of Lefèvre et al. 2016; Figure 2 of Gopalswamy 2018) and the distributions of geoeffective ICMEs have significant western bias (Gopalswamy et al. 2007). Given the variability of ICME transit time of 0.6–5 days from their launch to arrival at the Earth (e.g., Lefèvre et al. 2016; Chertok 2020), the solar source eruption should be located somewhere in 1680 May 27–31. Therefore, it is quite plausible to expect this sunspot as a source of the reported candidate aurorae in Kirch (1681).
However, with our intensity estimate of minimal Dst ≥ −125 nT, we cannot exclude the possibility that the storm was caused by a CIR resulting from the interaction between the high-speed coronal hole stream and upstream slow-speed stream from its potential source (Smith & Wolfe 1976; Tsurutani et al. 1995; Richardson et al. 2002, 2006; Miyoshi & Kataoka 2005, 2008). It is known that the CIR can drive a forward shock onto the Earth's magnetosphere. Its maximal intensity had actually been reported up to minimal Dst ≥ −161 nT in the interval 1972–1995 (Richardson et al. 2006) and roughly agrees with the theoretical limit of the minimal Dst ≥ −180 nT (O'Brien & McPherron 2000). As such, we conclude neither ICME nor CIR can be excluded from potential sources for the candidate aurora on 1680 June 1.
4. Frequency of Candidate Aurorae and Variation of Magnetic Latitude in the European Sector
The reconstructed equatorial auroral boundary and the expected storm magnitude are much more decent than what would be expected for the auroral visibility in modern Europe. One such reason is the secular variations of the tilt angle of the dipole moment of the Earth, which results in the secular variations of the magnetic latitude of the European sector. Figure 4 shows these variations at Leipzig (N51°20', E12°23'), Budapest (N47°30', E19°03'), and Oxford (N51°45', W01°15'), to represent observations in Germany (this study), Hungary (Rethly & Berkes 1963; Riley et al. 2015; Vaquero & Trigo 2015), and England (Usoskin et al. 2015). During the MM (1645–1715), these sites were located at ≈55° MLAT, ≈51° MLAT, and ≈57° MLAT and ≈4° closer to the magnetic pole than the modern time: Leipzig = 51.2° MLAT, Budapest = 46.3° MLAT, and Oxford = 53.9° MLAT in 2014 with the IGRF12 model (Thébault et al. 2015).
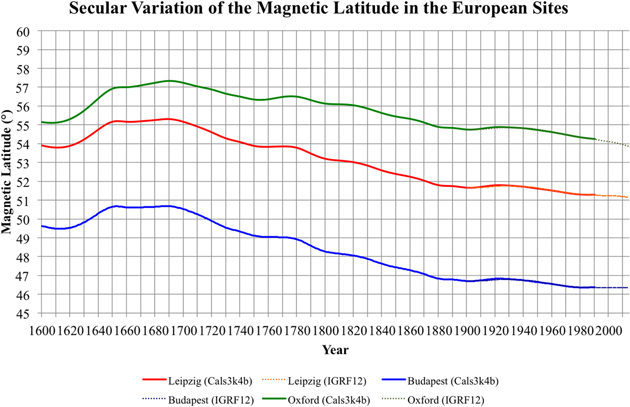
Figure 4. Secular variation of the MLATs in the European sector, represented with Leipzig in Germany (this study), Budapest in Hungary (Rethly & Berkes 1963; Riley et al. 2015; Vaquero & Trigo 2015), and Oxford in England (Usoskin et al. 2015). The MLATs have been computed with Cals3k4b for 1600–1990 (Korte & Constable 2011) and with IGRF12 for 1900–2014 (Thébault et al. 2015). These secular variations emphasize that the significance of the apparent dearth of the candidate aurorae in England between 1621–1716 is especially notable, given its proximity to the magnetic pole suggested in Usoskin et al. (2015).
Download figure:
Standard image High-resolution imageTherefore, if we assume a similar level of solar activity compared to modern times, the auroral nights during the MM would be significantly more frequent than in modern times because the European MLATs during the MM had been higher and therefore relatively closer to the auroral zone (see, e.g., Bond & Jacka 1962). However, the Hungarian auroral catalog by Rethly & Berkes (1963), which is frequently cited due to its better homogeneity (Scafetta & Wilson 2013; Riley et al. 2015; Vaquero & Trigo 2015), shows a significant decrease of the number of candidate auroral nights during the MM (Figure 2 of Vaquero & Trigo 2015; Figure 1 of Riley et al. 2015). Furthermore, Rethly and Berkes (1963, pp. 44–48) themselves had explicitly clarified that at least 5 of the 12 auroral candidates (i.e., 1660, 1663, 1664, 1687, and 1705) were probably misinterpretations of other phenomena such as haloes or fireballs in their own notes, and one candidate was observed around sunset (1687), as summarized in Figure 5. These clarifications in Rethly & Berkes (1963) caution us toward further possible misinterpretations of the existing candidate auroral records in central Europe during the MM and indicate the actual frequency of the auroral night even lower than previously considered. These contrasts strongly support the peculiarity of the MM and its significant decrease in the geomagnetic activity (e.g., Usoskin et al. 2015).

Figure 5. Estimated threshold variation (49.4° ± 1.2° MLAT) of the footprint of the magnetic field lines of the equatorial auroral boundary during the CIR storms (green horizontal lines) based on Yokoyama et al. (1998) vs. estimated ranges of the equatorial boundaries of the candidate aurorae in Rethly & Berkes (1963), Isobe et al. (2019), and this study (in magnetic latitude). The unlikely candidates in Rethly & Berkes (1963) are in black, and other candidates in red. Kirch's report examined in this study is shown in blue, and the East Asian simultaneous report data in Isobe et al. (2019) appears in purple. We have derived the error margin of the actual equatorward boundary of the auroral oval for each case, based on the descriptions of their reported altitude and direction. When neither its direction nor altitude are described, we have assumed their possible ranges of the elevation angle as 0°–180° from the poleward horizon.
Download figure:
Standard image High-resolution image
We should consider the secular variation of the strength of the dipole moment of the Earth. When the dipole moment of the Earth increases, the equatorward boundary of the auroral oval moves poleward, according to a theoretical study (Siscoe & Christopher 1975) and a simulation study (Ebihara & Tanaka 2021). This implies that stronger dipole moment of the Earth during the MM may have required a slightly stronger geomagnetic storm (and the solar wind conditions) to extend the auroral oval over the same geographical extent. The simulation results obtained by Ebihara & Tanaka (2021) demonstrate that the influence of the strength of the dipole moment on the equatorward boundary of the auroral oval was probably small, at least for the past 1000 yr.
5. Possible Contributions of the CIR Storms
The relative proximity between the European sector and the magnetic pole during the MM indicates the requirements for a weaker source geomagnetic storm to allow for the auroral visibility in the European sector, and for making CIRs from high-speed solar wind as more plausible sources, while Riley et al. (2015) expected ICMEs as the sources based on the auroral visibility in central Europe (Rethly & Berkes 1963). As stated above, the CIR-associated storms with their minimal Dst have been empirically known to be as low as −161 nT (Richardson et al. 2006), and the theoretical limit of their minimal Dst has been estimated to −180 nT (O'Brien & McPherron 2000). The empirical correlations of the storm intensity by the Dst index, and the equatorward boundary of the auroral ovals in Yokoyama et al. (1998), allow us to estimate the equatorward boundary of the auroral oval within the capacity of the CIR storms as 49.4° ± 1.2° (48.2°–50.6°) MLAT in their footprint of the magnetic field line. The 1.2-times stronger magnetic field at that time does not significantly affect this threshold line, as this would mean the equatorial boundary of the auroral oval for geomagnetic storms of the same size shifted, at best, ≈1° MLAT poleward (Ebihara & Tanaka 2021).
As the auroral visibility in central Europe does not necessarily indicate visibility of the overhead aurora there, it is more likely to expect its visibility in the poleward sky (see, e.g., Vallance Jones 1992; Shiokawa et al. 2005; Figure 6 of Kimball 1960; Figure 2 of Hayakawa et al. 2018). As such, unless the auroral displays extend beyond the zenith, the actual equatorial boundary of the associated auroral ovals stay significantly more poleward than the equatorward boundary of the auroral visibilities and yield only weaker storms.
Accommodating these uncertainties, we have reanalyzed the candidate aurorae in Rethly & Berkes (1963), which are used in a number of modern studies (e.g., Scafetta & Wilson 2013; Riley et al. 2015; Vaquero & Trigo 2015). Figure 5 shows the MLATs of the reported visibility of candidate aurorae in Rethly & Berkes (1963) and their possible margins of the equatorial boundaries. Unless the direction is otherwise specified, the variability of their elevation angle was estimated as 0°–180° from the poleward horizon of their observational sites. Here, it is explicitly shown that the reported candidate aurorae plausibly stayed within the intensity range of the CIR storms even if the candidate aurorae in Rethly & Berkes (1963) extended overhead of their observational sites (49.4° ± 1.2° MLAT). Without explicit constraints on their direction, these candidate aurorae were more likely to be seen in the poleward sky and required source geomagnetic storms of a reduced intensity from the threshold of the equatorward extent of the CIR origin aurorae.
Being derived from the high-speed solar wind from the corona hole, CIR storms do not necessarily require source sunspots, and this can explain the reported absence of their simultaneous sunspots in the MM, which has been somewhat puzzling when we expect ICMEs as their sources (Letfus 2000; Isobe et al. 2019). In fact, CIRs have been continuously reported, even during the deep solar minima, and their occurrence has not been affected as much as the solar wind properties and the number of sunspots (Jian et al. 2011; Miyoshi & Kataoka 2011). This trend can be extended to the MM with a deeper suppression of the sunspot activity (Riley et al. 2015; Usoskin et al. 2015; Vaquero et al. 2015). In this case, the auroral visibilities in central Europe do not necessarily require ICMEs and associated active region sources.
6. Summary and Discussions
We have analyzed the "fire-signs" reported in Kirch (1681) and documented their observational details. Our analyses show that this event was widely observed in the area around the southern Baltic Sea as well as in central Germany from 1 hr LT to local daybreak. The colourations were described as reddish, bluish, golden, and whitish (including silvery). The shapes were described as a combination of glow and rays, whereas the rays were often described as curved with shapes and vertical motions varying with time. The descriptions are consistent with midlatitude aurorae, rather than with other possible candidates such as fireballs.
Based on the description of the overhead coverage at 55.3° MLAT, the footprint of the magnetic field line for the equatorial boundary of the auroral oval has been estimated as ≈56.5° MLAT. With an equatorward boundary of the auroral oval comparable to those of major storms such as the one on 1972 August 4, this storm intensity can be estimated as Dst ≥ −125 nT. Its chronological coincidence with reported sunspot visibility on 1680 May 20–30 tempts us to associate this sunspot with the plausible source of this candidate storm, whereas its intensity indicates CIRs derived from the high-speed solar wind as its possible cause as well. At least, the period of 1680 May–June was peculiar in the MM, hosting both the candidate aurora and the sunspot group.
Its ICME origin is acceptable, as the sunspot active region is recorded a few days before this candidate aurora, the rate of ICMEs is estimated to be comparable between the recent solar minima (2008/2009 and 1996/1997) and the MM (Owens & Lockwood 2012), and the intensity of this storm was not that extreme (minimal Dst ≥ −125 nT). In fact, despite the empirical preference of ICME occurrence around the maximum or in the declining phase of the solar cycle (Kilpua et al. 2015; Lefèvre et al. 2016), some significant ICMEs have caused extreme geomagnetic storms around the cycle minimum or immediately afterward: e.g., the 1986 February storm (minimal Dst = −307 nT; Garcia & Dryer 1987; WDC for geomagnetism at Kyoto 2015), 1998 September storm (minimal Dst index = −207 nT; Daglis et al. 2007; WDC for geomagnetism at Kyoto 2015), and 1903 October storm (minimum Dst estimate ≈−531 nT; Hayakawa et al. 2020c; see also Ribeiro et al. 2016).
This contrasts with the other candidate aurorae in this period, mostly without simultaneous sunspot observations (e.g., Letfus 2000; Isobe et al. 2019). While ICMEs and source sunspots have been expected for the origin of these candidate aurorae (Riley et al. 2015), a considerable proportion of the candidate aurorae described during the MM in Rethly & Berkes (1963) were probably misinterpretations, as already clarified by themselves. These discussions probably indicate that the auroral night was even less frequent during the MM than previously considered (Riley et al. 2015; Vaquero & Trigo 2015), and reinforces their scenarios of its reduced auroral activity (Eddy 1976; Siscoe 1980; Feynman & Gabriel 1990; Nevanlinna 1995; Tsurutani et al. 2011; Lockwood & Barnard 2015), despite the closer proximity of the European sector to the magnetic pole than in modern times (Usoskin et al. 2015; see also Figure 4). This is consistent with the reconstructed slower solar wind and lower solar wind dynamic pressure during the MM than in the recent deep solar cycle minima (Cliver et al. 1998; Owens et al. 2017). These peculiar conditions were more likely to make the auroral oval remain at higher latitudes, while also reducing the auroral brightness (Milan et al. 2010).
Nevertheless, the auroral activity did not completely cease even in the European sector. Visibility extensions indicate that the intensity remained within the capacity of CIR storms in addition to previously suggested ICME-storms (Figure 5; see Riley et al. 2015). Notably, aurorae were probably less frequent in the European sector than previously considered despite its relative proximity to the magnetic pole (≈4° MLAT). Therefore, we conclude that the solar wind was generally slower with quieter auroral activity. However, occasional occurrences of sunspots and coronal holes have sporadically triggered geomagnetic storms and midlatitude aurorae not only with ICMEs but also with CIRs. Our results likely resolve some puzzling cases of candidate auroral records in central Europe without simultaneous sunspot records.
We thank JSPS Grant-in-Aids JP15H05812, JP17J06954, 18H01254, JP20H00173, JP20K22367, and JP20K20918, JSPS Overseas Challenge Program for Young Researchers, Young Leader Cultivation (YLC) program of Nagoya University, the 2020 YLC collaborating research fund, and the research grants for Mission Research on Sustainable Humanosphere from Research Institute for Sustainable Humanosphere (RISH) of Kyoto University. We thank Bayerische Staatsbibliothek and Bibliothek Wolfenbüttel for letting us access the copies of Kirch (1681) and Voigt (1681). H.H. thanks archivists in l'Observatoire de Paris for letting him access Gottfried Kirch's original manuscript (MS B 3/1A), and Jean-Pierre Allizart, Valérie Gadon, and Nuage for their cordial help during his surveys in Paris, and Ilya G. Usoskin and Yoshizumi Miyoshi for their valuable comments and discussion on our article. The authors also benefited from discussions within the ISSI International Team #510 (SEESUP Solar Extreme Events: Setting Up a Paradigm) and ISWAT-COSPAR S1-01 and S1-02 teams.