


Abstract
We report high-resolution (<100 nm) Mg and Si isotope data of 12 presolar silicate grains (230–440 nm) from red giant and/or asymptotic giant branch stars that were previously identified based on their anomalous O-isotopic compositions (11 Group 1 grains and one Group 2 grain) in five primitive meteorites. The data were acquired by NanoSIMS ion imaging with the new Hyperion ion source that permits Mg and Si isotope measurements of presolar silicates with higher precision than was possible before. For a subset of five Group 1 ("category A") grains, 25Mg/24Mg and 29Si/28Si ratios correlate with the inferred initial 18O/16O ratios of their parent stars, a measure of stellar metallicity. The Mg and Si isotope data of category A grains show positive correlations in the δ25Mg–δ26Mg, δ29Si–δ30Si, and δ25Mg–δ29Si spaces. The correlations between O-, Mg, and Si-isotopic compositions are best explained by Galactic chemical evolution (GCE), with only minor imprints of nucleosynthetic and mixing processes in the grains' parent stars. Six Group 1 silicate ("category B") grains have close-to-normal Mg and Si isotopic compositions, possibly the result of isotope exchange in interstellar space or the meteorite parent bodies. For Si in category A grains, we find, with ∼2σ significance, a slightly shallower slope in the δ29Si–δ30Si space for the GCE than inferred from presolar SiC mainstream grains. The 2σ upper limit on the slope for the linear trend in the δ25Mg–δ26Mg space of category A grains is slightly lower than the slope-1 predicted by GCE models around solar metallicity.
Export citation and abstract BibTeX RIS
1. Introduction
Primitive solar system materials, such as meteorites, interplanetary dust particles (IDPs), and cometary matter, contain small quantities of so-called presolar grains that formed in the winds of evolved stars and ejecta of stellar explosions, i.e., they represent samples of stardust that can be analyzed in terrestrial laboratories in great detail (Zinner 2014). Presolar grains exhibit large isotope abundance anomalies in the major and minor elements, the fingerprints of Galactic chemical evolution (GCE) and nucleosynthesis in their parent stars. The term GCE describes the evolution of elemental and isotopic abundances throughout the history of our Galaxy that result from the recycling of products of stellar nucleosynthesis, most importantly from supernovae and asymptotic giant branch (AGB) stars. Among the different types of presolar grains, O-rich dust, e.g., silicates, from low-mass red giant and/or AGB stars can be considered to have best preserved the imprints of GCE for many rock-forming elements, e.g., Mg and Si.
After passage through the interstellar medium (ISM), presolar grains became part of the interstellar gas and dust cloud from which our solar system formed some 4.6 Gyr ago. They survived all stages of solar system formation, from the collapse of the interstellar cloud to the formation of small planetary bodies, and are finally carried to the Earth as a minor component of primitive solar system materials. Laboratory studies of presolar grains provide detailed insights into physical and chemical processes in stellar and interstellar environments, and the data on isotopic compositions, elemental abundances, and mineralogy of presolar grains can be used as input and touchstone for stellar models (e.g., Pignatari et al. 2015; Lugaro et al. 2017).
Among the identified presolar grain types are carbonaceous, N-rich, and O-rich grains. Presolar silicates constitute the most abundant presolar grain type available for single-grain isotope studies (Floss & Haenecour 2016). Presolar O-rich dust grains are divided into four distinct O isotope groups, with only a few extreme grains outside this classification scheme (Nittler et al. 1997, 2008). Most presolar O-rich grains belong to Group 1. Grains from this group formed in the winds of 1.2–2.2 M⊙ red giant and AGB stars of close-to-solar metallicity (Nittler 2009). Group 1 grains show enhanced 17O/16O and about solar or slightly lower than solar 18O/16O ratios, the imprint of the first dredge-up in such stars. In contrast, the isotopic compositions of other elements, e.g., Mg and Si, are not expected to change significantly at the surface of the parent stars of Group 1 grains when O-rich dust can form (see discussion in Zinner et al. 2005; Kodolányi et al. 2014); i.e., they largely represent the isotopic compositions at the time the stars formed, mainly reflecting GCE. The rarer Group 2 grains are also believed to come from AGB stars. They exhibit strong depletions in 18O, which cannot be explained by the first dredge-up. Strong depletions in 18O are expected for cool bottom processing (CBP) in low-mass (<1.5 M⊙) AGB stars (Nollett et al. 2003; Palmerini et al. 2011) and hot bottom burning (HBB) in intermediate-mass (4–8 M⊙) AGB stars (Lugaro et al. 2017). As HBB strongly affects Mg-isotopic compositions (Zinner et al. 2006; Lugaro et al. 2017), Group 2 grains may not be good tracers for GCE of Mg isotopes.
As presolar silicates cannot be separated chemically from their host meteorites, they can be identified only in situ by ion imaging, preferentially performed with the NanoSIMS (e.g., Messenger et al. 2003; Hoppe et al. 2013). Identified presolar silicates have typical sizes of ∼150 nm, and only a small fraction have sizes exceeding 300 nm (Hoppe et al. 2017). Major elements of silicates are O, Mg, Si, Ca, and/or Fe. Because of potential dilution of the presolar silicates' native isotope anomalies by contributions from surrounding solar system material during ion imaging, most isotope measurements conducted so far focused on O and, to some extent, Si by employing the high-resolution (≤100 nm beam size) Cs+ primary ion source. In this setup, Si suffers from a relatively low secondary ion yield, which leads to large analytical errors in measured isotopic ratios. Isotope measurements for other major elements in presolar silicates, e.g., Mg, require measurements with an O− primary ion source, which, until recently, were limited to 200–300 nm spatial resolution (Duoplasmatron), not sufficient to study typical presolar silicates in situ. To circumvent this limitation, time-consuming preparation methods (based on the focused ion beam technique (FIB)) were applied, which, however, led to Mg isotope data with relatively large errors for only a few presolar silicate grains (Kodolányi et al. 2014; Nguyen & Messenger 2014).
Comprehensive Si isotope data exist for chemically separated presolar silicon carbide (SiC) grains from primitive meteorites. SiC mainstream grains, which make up the vast majority of presolar SiC grains and are believed to come from 1–3 M⊙ AGB stars of about solar metallicity (Lugaro et al. 2003), show a good correlation between 29Si/28Si and 30Si/28Si ratios, falling along a line δ29Si1 = 1.37 × δ30Si—20 (Zinner et al. 2007) called the Si mainstream line. The Si mainstream line is considered the current best estimate for the GCE of Si isotopes, although some modifications of initial Si-isotopic compositions of the parent stars of SiC mainstream grains might have occurred during the third dredge-up events on the AGB (Zinner et al. 2006; Cristallo et al. 2015), which, in principle, could be quantified by a comparison with the Si isotope data of presolar silicates. Magnesium-isotope data exist for a large number of Group 1 oxide grains (e.g., Zinner et al. 2005; Nittler et al. 2008; Gyngard et al. 2010) and a few Group 1 silicate grains (Kodolányi et al. 2014). However, although important information on GCE can be gained from combined 25Mg/24Mg and 18O/16O ratios in presolar oxide grains (Nittler et al. 2008), the interpretation of the Mg isotope data is complicated by the fact that (i) 26Mg might have significant contributions from 26Al decay in presolar oxides (Zinner et al. 2005), and (ii) currently available Mg isotope data of presolar silicates suffer from relatively large errors (Kodolányi et al. 2014), which made it impossible to put tight constraints on the GCE of Mg isotopes.
The new Oregon Physics Hyperion O primary ion source, which was recently installed on the Cameca NanoSIMS 50 at the Max Planck Institute for Chemistry (MPIC), has much better spatial resolution than the previously used Duoplasmatron and allows isotope measurements of astrophysically important elements in O-rich stardust with 100 nm spatial resolution (Nittler et al. 2018) or better. Here we report high-resolution (<100 nm) Mg and Si isotope measurements with the Hyperion O ion source on presolar silicates with sizes of >300 nm for all but one grain from red giant and/or AGB stars. Considering the expected small modifications of Mg and Si-isotopic compositions in the parent stars of Group 1 presolar silicate grains, our study provides new insights into the GCE and nucleosynthesis of Mg and Si isotopes that can be used as constraints for models of GCE and nucleosynthesis in AGB stars.
2. Experimental
The Cameca NanoSIMS 50 ion probe permits isotope measurements with submicrometer spatial resolution (Hoppe et al. 2013). Besides superior spatial resolution, the NanoSIMS is characterized by a high detection efficiency for secondary ions (up to the percent range for favorable elements) and multi-collection capability. This is particularly important if small volumes, such as presolar grains, are analyzed. By rastering the primary ion beam over a flat sample (e.g., meteoritic thin section), it is possible to record isotope maps in which presolar grains stand out by their anomalous isotopic compositions as hot spots. This technique, called ion imaging, has been used to study a variety of primitive solar system materials for the presence of presolar grains (e.g., Vollmer et al. 2009; Nguyen et al. 2010; Leitner et al. 2012; Hoppe et al. 2015a).
Twelve presolar silicates, 11 of which belong to O-isotope Group 1 and one to Group 2, with sizes from 230 to 440 nm (Table 1), previously identified in the carbonaceous chondrites Acfer 094, Elephant Moraine (EET) 92161, Meteorite Hills (MET) 00426, and Northwest Africa (NWA) 801 (Hoppe et al. 2015a; Leitner et al. 2016a, 2016b) and the ordinary chondrite Krymka (unpublished), were selected for Mg and Si isotope measurements with the MPIC NanoSIMS. An ∼0.5 pA O− primary ion beam produced in the Hyperion source was focused to 50–70 nm spot size (with lens L1 set to ∼−7 kV; Figure 1) and rastered over 2 × 2 μm2 sized areas (all grains except MET_01B_61, for which the raster size was 3 × 3 μm2) around the presolar silicate grains. Spatial resolution is generally worse than the primary ion beam spot size in geological samples due to topography, charging, and image drifts between individual image planes (corrected by cross-correlation). As evidenced from ion intensity line profiles for features visible in ion images, spatial resolution can be considered to be <100 nm for the Mg and Si isotope measurements on the samples in this study, as was similarly inferred for high-resolution ion imaging applications employing a Cs+ primary ion source at a nominal 50 nm spot size (Hoppe et al. 2015a).
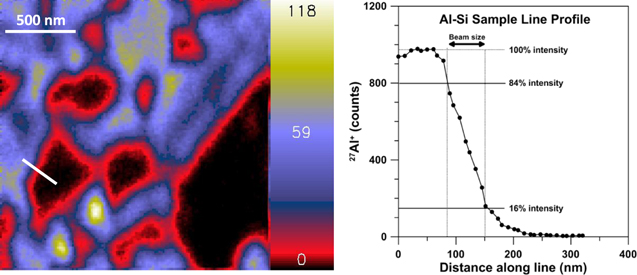
Figure 1. Positive secondary ion image of 27Al from a synthetic Al-Si sample (left) recorded with the Hyperion O ion source and a profile (right) along the line indicated in the ion image. Field of view is 2 × 2 μm2. The image is 256 × 256 pixels, i.e., 1 pixel = 8 nm. The line profile indicates a primary ion beam spot size (encompassing 68% of beam current) of ∼60 nm.
Download figure:
Standard image High-resolution imageTable 1. O-, Mg-, and Si-isotopic Compositions and Element Abundances of Silicate Stardust from the Carbonaceous Chondrites Acfer 094, EET 92161, MET 00426, and NWA 801 and the Ordinary Chondrite Krymka
| Grain | Size | Gr. | 17O/16Oa | 18O/16Oa | δ25Mgb | δ26Mgb | δ29Sic | δ30Sic | Al/Mg | Si/Mg | Ca/Mg | Ti/Mg | Fe/Mg |
|---|---|---|---|---|---|---|---|---|---|---|---|---|---|
| (nm) | (10−4) | (10−3) | (‰) | (‰) | (‰) | (‰) | (10−4) | ||||||
| Acf_C@1_21 | 440 | 1 | 10.49 ± 0.45 | 1.79 ± 0.06 | 34 ± 6 | 46 ± 5 | 61 ± 10 | 59 ± 12 | 0.004 | 0.49 | 0.013 | 5.7 | 0.087 |
| EET_10_29 | 440 | 1 | 9.66 ± 0.48 | 2.09 ± 0.07 | 123 ± 6 | 209 ± 6 | 196 ± 8 | 155 ± 10 | 0.056 | 1.22 | 0.005 | 0.9 | 0.11 |
| EET_10_5 | 300 | 1 | 12.00 ± 0.76 | 1.85 ± 0.10 | −6 ± 6 | 5 ± 6 | 18 ± 11 | 0 ± 14 | 0.022 | 0.60 | 0.011 | 5.1 | 0.35 |
| EET_07_25 | 440 | 1 | 6.22 ± 0.48 | 1.62 ± 0.08 | −1 ± 6 | 38 ± 6 | −5 ± 9 | −22 ± 11 | 0.027 | 0.74 | 0.038 | 6.4 | 0.18 |
| EET_07_2 | 380 | 1 | 5.67 ± 0.31 | 1.93 ± 0.06 | 41 ± 6 | 40 ± 6 | 54 ± 17 | 56 ± 20 | 0.069 | 0.56 | 0.017 | 7.2 | 0.29 |
| EET_2A_B_31 | 350 | 1 | 7.73 ± 0.77 | 1.82 ± 0.12 | 4 ± 5 | 7 ± 5 | 5 ± 14 | −6 ± 17 | 0.047 | 0.84 | n.m. | n.m. | n.m. |
| Kry_I_42 | 380 | 1 | 7.67 ± 0.54 | 1.26 ± 0.07 | 1 ± 5 | −4 ± 5 | 3 ± 9 | −19 ± 12 | 0.018 | 1.04 | n.m. | n.m. | n.m. |
| Acf_G1@1_15 | 340 | 2 | 8.69 ± 0.28 | 0.70 ± 0.02 | 165 ± 9 | 203 ± 9 | n.m. | n.m. | 0.253 | 0.90 | 0.33 | 43.7 | 0.21 |
| MET_01B_61 | 380 | 1 | 21.88 ± 3.26 | 2.31 ± 0.30 | 4 ± 10 | 2 ± 10 | −2 ± 17 | −7 ± 24 | 0.096 | 1.36 | n.m. | n.m. | n.m. |
| NWA_3B_03 | 380 | 1 | 19.42 ± 0.73 | 1.95 ± 0.07 | 17 ± 9 | −9 ± 9 | n.m. | n.m. | 0.046 | 0.84 | n.m. | n.m. | n.m. |
| NWA_3_25 | 320 | 1 | 19.25 ± 2.14 | 1.73 ± 0.20 | 46 ± 6 | 78 ± 6 | 96 ± 17 | 50 ± 20 | 0.013 | 0.51 | n.m. | n.m. | n.m. |
| NWA_1B_07_1 | 230 | 1 | 24.06 ± 1.55 | 1.62 ± 0.13 | 15 ± 9 | 13 ± 9 | 13 ± 34 | 8 ± 29 | 0.062 | 0.60 | n.m. | n.m. | n.m. |
| Solar | 3.80 | 2.01 | 0 | 0 | 0 | 0 | 0.082 | 0.97 | 0.059 | 24.0 | 0.82 | ||
Notes. Errors are 1σ. Gr.: group of presolar O-rich grains. n.m.: not measured.
aO-isotope data are from Hoppe et al. (2015a) and Leitner et al. (2016a, 2016b) for Acfer 094, EET 92161, MET 00426, and NWA 801 and are unpublished for the ordinary chondrite Krymka. bδxMg = [(xMg/24Mg)grain/[(xMg/24Mg)std−1] × 1000; x = 25, 26; (25Mg/24Mg)std = 0.12663; (26Mg/24Mg)std = 0.13932. cδxSi = [(xSi/28Si)grain/(xSi/28Si)std−1] × 1000; x = 29, 30; (29Si/28Si)std = 0.050804; (30Si/28Si)std = 0.033532.Download table as: ASCIITypeset image
Positive secondary ion images of Mg and Si isotopes and selected isotopes of other elements were recorded in multi-collection in three sessions. The first session was dedicated to Mg-isotopic compositions and comprised the isotopes 24Mg, 25Mg, 26Mg, 27Al, and 28Si (all 12 grains). Measurements in sessions 2 and 3 were done on a subset of these grains. Session 2 focused on Si-isotopic compositions and included the isotopes 24Mg, 27Al, 28Si, 29Si, and 30Si (10 Group 1 grains). Session 3 comprised the isotopes 24Mg, 27Al, 40Ca, 48Ti, and 56Fe (5 Group 1 grains and the Group 2 grain) to determine elemental abundances. Ion images consist of 256 × 256 pixels and several image planes (4–5 in session 1, 4–12 in session 2, and 1–3 in session 3) with integration times of 5000 μs per pixel and image plane.
Presolar silicates were located by comparing positive Mg, Al, and Si ion images with negative O, Si, and AlO ion images obtained in the preceding O-isotope ion imaging surveys, in which they clearly stand out by their anomalous O-isotopic compositions. Particularly useful is the comparison of AlO− and Al+ ion images, because of similar intensity patterns (Figure 2). In addition, in some cases, presolar silicates could be located in the Mg and/or Si ion images by their isotope anomalies, provided these are large enough, i.e., >∼50‰. The presolar silicate grains comprise more than ∼1000 pixels in Mg and Si ion images, which permits us to carefully select pixels for the determination of isotope ratios.
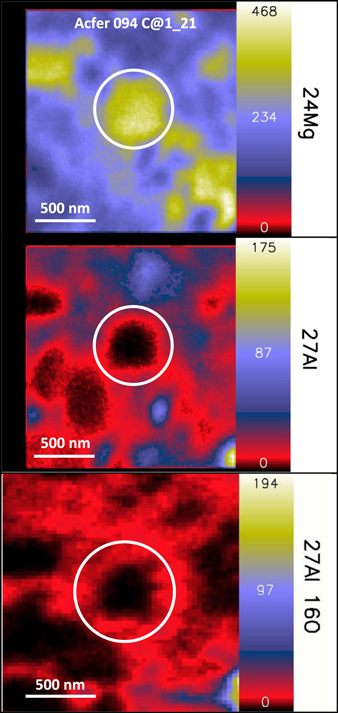
Figure 2. Secondary ion images of 24Mg+ (top), 27Al+ (middle), and 27Al16O− (bottom) of presolar silicate grain Acf_C@1_21, located in the fine-grained matrix of the Acfer 094 meteorite (inside white circle). Based on the elemental distribution maps (see also Table 1), its chemical composition is close to Fo90. Field of view is 2 × 2 μm2. Positive secondary ion images were acquired with the Hyperion O ion source. The 27Al16O− image shown was extracted from the original 5 × 5 μm2 image and recorded with the Cs ion source.
Download figure:
Standard image High-resolution imageMagnesium- and Si-isotopic ratios of presolar silicates were normalized to those of the surrounding matrix. To check for potential matrix effects on the instrumental mass fractionation, we divided individual images into 25 400 × 400 nm2 sized boxes (similar to the sizes of the presolar silicates considered here) and calculated Mg- and Si-isotopic ratios. For Mg, the standard deviation is slightly higher than expected from counting statistics, namely, by 4‰ in both δ25Mg and δ26Mg, which was (quadratically) added to the counting statistical errors of Mg-isotopic compositions of silicate grains from this study. For Si, the standard deviation was compatible with the counting statistics, i.e., at the scale of our measurement precision, there is no visible matrix effect, and reported errors are based solely on counting statistics. To infer elemental abundances, relative sensitivity factors ( ) were taken from a compilation of NanoSIMS data from the literature obtained for NIST SRM 611 glass: (Al+/Mg+) = 1.21 (Hoppe et al. 2010, 2015b), (Mg+/Si+) = 3.3 (Hoppe et al. 2015b), (Ti+/Mg+) = 1.27 (Besmehn & Hoppe 2003; Hoppe et al. 2015b), and (Fe+/Mg+) = 0.71 (Marhas et al. 2008; Hoppe et al. 2015b).
Measured Mg- and Si-isotopic compositions of presolar silicates can be strongly compromised by the effect of beam tailing (Nguyen et al. 2007). The primary ion beam has an approximately Gaussian shape, and beam spot sizes are usually defined as encompassing 68% of the beam current. The presolar silicates' intrinsic isotopic compositions will be significantly diluted by surrounding material of solar system origin if their sizes are less than 300 nm. A high ratio of object size to beam size is thus crucial to obtain meaningful isotope data. Here we selected, with one exception, only presolar silicates with sizes >300 nm for Mg and Si isotope measurements (see Tables 1 and 2) and used the best achievable spatial resolution (nominal 50 nm O− primary ion beam spot size, resulting in <100 nm spatial resolution; see above). Nevertheless, some dilution must still be considered. To quantify this, we performed simulations on synthetic ion images, as similarly conducted by Nguyen et al. (2007). We assumed a Gaussian beam shape, with the beam diameter represented by ±σ in the Gaussian distribution. We considered images of 256 × 256 pixels, image sizes of 10 (O-isotope images) and 2 (Mg and Si ion images) μm, object sizes between 230 and 440 nm (the sizes of our presolar silicates), variable grain subareas for the calculation of isotope ratios, and variable beam sizes were between 60 and 200 nm (Figure 3).
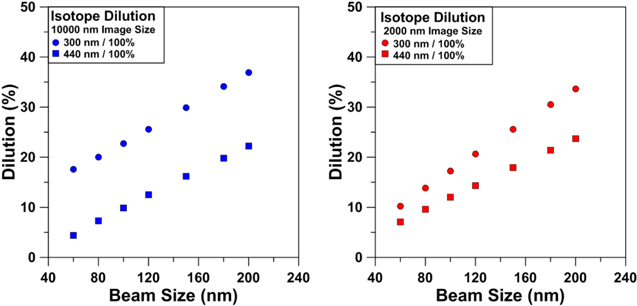
Figure 3. Dilution factors (in percent) due to primary ion beam tailing for intrinsic isotope ratios of presolar grains as a function of beam size for grains of size 300 nm and 440 nm for two image sizes, 10 × 10 (left) and 2 × 2 (right) μm2, inferred from simulations on synthetic ion images. The simulations consider 256 × 256 pixels, 100% of the grain area for the calculation of isotope ratios, and a Gaussian beam shape where the beam size is represented by ±σ in the Gaussian distribution.
Download figure:
Standard image High-resolution image3. Results
The 11 Group 1 silicate grains from this study have measured 17O/16O ratios between 5.7 × 10⁻⁴ and 2.4 × 10⁻³ and 18O/16O ratios from 1.3 × 10⁻³ to 2.3 × 10⁻³ (Table 1; Hoppe et al. 2015a; Leitner et al. 2016a, 2016b; unpublished), covering almost the full range of previously studied Group 1 grains (Figure 4). The measured O-isotopic composition of the Group 2 silicate grain is 17O/16O = 8.7 × 10⁻⁴ and 18O/16O = 7.0 × 10⁻⁴ (Table 1), which plots at the upper end of the 18O/16O ratios of Group 2 grains (Figure 4). As described above for Mg and Si, primary ion beam tailing is also expected to affect O-isotopic ratios. From structures in the O-isotope images, we estimate spatial resolution, or effective beam sizes, to be <100 nm for the Acfer 094 measurements and ∼150 nm for the other meteorites. When we apply the results from our simulations for dilution, assuming effective beam sizes of 100 nm for the Acfer 094 measurements and 150 nm for the other meteorites, and considering 50%–100% of total grain areas, which was used to calculate isotope ratios, we obtain a dilution of true O-isotope ratios of 6%–20%. The dilution-corrected O-isotopic ratios are given in Table 2. Correction for dilution does not change the overall picture of isotope ratios of the presolar silicates presented here; all Group 1 grains are still classified as Group 1, although grain Kry_I_42 plots close to the region characteristic of Group 2 grains (Figure 4). The dilution-corrected weighted average 18O/16O ratio of our Group 1 grains, a measure for GCE (see below), is (1.73 ± 0.10) × 10−3, compared to 1.63 × 10⁻³ for chemically separated micron-sized Group 1 oxide grains (Nittler et al. 1997, 2008), for which isotope dilution can be largely neglected, i.e., both numbers agree within 1σ. Similarly, we have corrected the Mg and Si isotope data for dilution. Measured δ25Mg and δ26Mg vary from −11‰ to +123‰ and −9‰ to +209‰ for the Group 1 grains, respectively, and δ29Si and δ30Si from −5‰ to +196‰ and −22‰ to +155‰, respectively (Table 1). With an effective beam size of 100 nm and considering 20%–100% of the total grain areas, which were used to calculate isotope ratios, we obtain dilutions of true Mg and Si isotope ratios of up to 17%. Respective corrections were applied to measured Mg and Si isotope ratios (Table 2). As for O, the overall picture of Mg- and Si-isotopic compositions is not changed significantly; specifically, the observed linear trends for Group 1 grains are preserved (Figures 5 and 6). Within 2σ, six grains have normal Mg-isotopic compositions; for five of those, Si isotope data are also available, all of which are compatible with normal Si. Grain EET_07_25 does not follow the linear trend for Mg isotopes spanned by the other Group 1 grains; it is shifted to a more 26Mg-rich composition (Figure 5).

Figure 4. Oxygen-isotopic ratios of presolar silicate grains from this study (original data of Group 1 grains in red and respective dilution-corrected data in blue; original data of the Group 2 grain in light green and respective dilution-corrected data in dark green) and presolar oxide and silicate grains from the literature for comparison (in gray, taken from the Washington University Presolar Grain Data Base; Hynes & Gyngard 2009). The four O-isotope groups are indicated by light gray shaded areas; the solar system O-isotopic ratios are given by dotted lines.
Download figure:
Standard image High-resolution image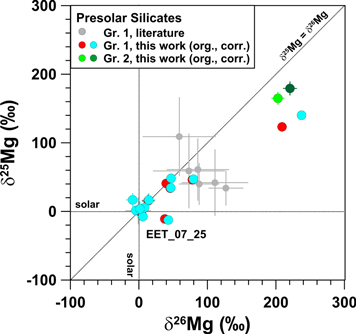
Figure 5. Magnesium-isotopic compositions given as per mill deviation from the solar system 25Mg/24Mg and 26Mg/24Mg ratios of presolar silicates from this study (original data of Group 1 grains in red and respective dilution-corrected data in blue; original data of the Group 2 grain in light green and respective dilution-corrected data in dark green) in comparison to data of Group 1 grains from the literature (in gray; Kodolányi et al. 2014). The solar system isotopic composition and slope-1 line (δ26Mg = δ25Mg) are indicated by black dotted lines. Errors are 1σ.
Download figure:
Standard image High-resolution image
Figure 6. Silicon-isotopic compositions given as per mill deviation from the solar system 29Si/28Si and 30Si/28Si ratios of Group 1 silicates from this study (original data of Group 1 grains in red and respective dilution-corrected data in blue) in comparison to selected data of Group 1 grains (error in δ30Si of less than 30‰) from previous studies (in gray; Floss & Haenecour 2016). The solar system isotopic composition and SiC Si mainstream line are indicated by black dotted lines. Errors are 1σ.
Download figure:
Standard image High-resolution imageTable 2. O-, Mg-, and Si-isotopic Compositions, Corrected for Isotope Dilution Due to Beam Tailing, of Silicate Stardust from the Carbonaceous Chondrites Acfer 094, EET 92161, MET 00426, and NWA 801 and the Ordinary Chondrite Krymka
| Grain | Size | Gr. | Category | 17O/16Oa | 18O/16Oa | δ25Mgb | δ26Mgb | δ29Sic | δ30Sic | |
|---|---|---|---|---|---|---|---|---|---|---|
| (nm) | (10−4) | (10−3) | (‰) | (‰) | (‰) | (‰) | ||||
| Acf_C@1_21 | 440 | 1 | A | 11.58 ± 0.50 | 1.76 ± 0.06 | 34 ± 6 | 46 ± 6 | 61 ± 10 | 59 ± 12 | |
| EET_10_29 | 440 | 1 | A | 10.46 ± 0.51 | 2.10 ± 0.07 | 140 ± 6 | 237 ± 6 | 204 ± 8 | 162 ± 10 | |
| EET_10_5 | 300 | 1 | B | 14.05 ± 0.89 | 1.81 ± 0.09 | −7 ± 7 | 6 ± 7 | 21 ± 13 | 0 ± 16 | |
| EET_07_25 | 440 | 1 | A | 6.55 ± 0.51 | 1.57 ± 0.08 | −13 ± 6 | 43 ± 6 | −5 ± 9 | −24 ± 11 | |
| EET_07_2 | 380 | 1 | A | 6.03 ± 0.33 | 1.92 ± 0.06 | 48 ± 7 | 47 ± 7 | 55 ± 17 | 57 ± 21 | |
| EET_2A_B_31 | 350 | 1 | B | 8.54 ± 0.85 | 1.78 ± 0.11 | 5 ± 6 | 8 ± 6 | 5 ± 15 | −6 ± 18 | |
| Kry_I_42 | 380 | 1 | B | 8.41 ± 0.59 | 1.12 ± 0.06 | 1 ± 6 | −4 ± 6 | 4 ± 11 | −22 ± 14 | |
| Acf_G1@1_15 | 340 | 2 | 9.49 ± 0.31 | 0.49 ± 0.01 | 179 ± 10 | 220 ± 10 | n.m. | n.m. | ||
| MET_01B_61 | 380 | 1 | B | 23.04 ± 3.44 | 2.33 ± 0.30 | 4 ± 10 | 2 ± 10 | −2 ± 18 | −7 ± 25 | |
| NWA_3B_03 | 380 | 1 | B | 20.42 ± 0.77 | 1.95 ± 0.07 | 17 ± 9 | −9 ± 9 | n.m. | n.m. | |
| NWA_3_25 | 320 | 1 | A | 21.36 ± 2.38 | 1.69 ± 0.20 | 47 ± 6 | 80 ± 6 | 113 ± 20 | 59 ± 24 | |
| NWA_1B_07_1 | 230 | 1 | B | 29.13 ± 1.88 | 1.52 ± 0.12 | 17 ± 10 | 14 ± 9 | 15 ± 38 | 9 ± 33 | |
| Solar | 3.80 | 2.01 | 0 | 0 | 0 | 0 | ||||
Notes. Errors are 1σ. Gr.: group of presolar O-rich grains. n.m.: not measured.
aO-isotope data are from Hoppe et al. (2015a) and Leitner et al. (2016a, 2016b) for Acfer 094, EET 92161, MET 00426, and NWA 801 and are unpublished for the ordinary chondrite Krymka. bδxMg = [(xMg/24Mg)grain/[(xMg/24Mg)std−1] × 1000; x = 25, 26; (25Mg/24Mg)std = 0.12663; (26Mg/24Mg)std = 0.13932. cδxSi = [(xSi/28Si)grain/(xSi/28Si)std−1] × 1000; x = 29, 30; (29Si/28Si)std = 0.050804; (30Si/28Si)std = 0.033532.Download table as: ASCIITypeset image
All presolar silicate grains are relatively poor in Al (see, e.g., grain Acf_C@1_21 in Figure 2), with a median Al/Mg ratio of 0.046 (Table 1). Given that Group 1 grains have 26Al/27Al ratios of <0.01 (Zinner 2014), the expected contributions to 26Mg from 26Al decay (half-life: 717,000 yr) are only between 0‰ and 5‰. This is significantly less than what can be expected for presolar Al-rich oxides, e.g., corundum (Al2O3) or spinel (MgAl2O4), and makes the interpretation of the 26Mg/24Mg data of presolar silicates much more straightforward than those of presolar oxides (see below).
4. Discussion
4.1. Mg- and O-isotopic Compositions of Group 1 Silicate Grains
The Mg isotope data presented here are much more precise than those reported previously for presolar silicates (Figure 5). Ten of the 11 Group 1 grains plot on or to the right (i.e., toward a 26Mg-rich composition) of the slope-1 line in an Mg-three-isotope representation (Figure 5). All but two Group 1 grains have δ25Mg and δ26Mg values between −20‰ and +50‰. For δ25Mg, this is compatible with observations for presolar spinel grains (Zinner et al. 2005); the latter, however, have δ26Mg values that extend to much higher values due to contributions from 26Al decay. Five (out of 11) of the Group 1 silicate grains show enrichments in 25Mg and/or 26Mg of more than 2σ, which is qualitatively consistent with the averages of previously studied Group 1 silicates (δ25Mg = 49 ± 12‰, δ26Mg = 77 ± 16‰; Kodolányi et al. 2014) and of astronomical observations of Galactic thin disk stars with −0.2 ≤ [Fe/H] ≤ +0.2 (δ25Mg = 108 ± 45‰, δ26Mg = 60 ± 55‰, taken from a compilation of data in Kodolányi et al. 2014). The Mg isotope composition of presolar grains is determined by the starting composition of their parent stars, i.e., GCE, nucleosynthesis and mixing in their parent stars, and processing in the ISM and solar system. As Group 1 presolar silicates and oxides exhibit similar O-isotopic signatures, they must have been derived from stars of about the same mass (i.e., 1.2–2.2 M⊙; Nittler 2009) and metallicity ranges. During the main-sequence phase of stellar evolution, temperatures are not high enough to change the Mg-isotopic composition of matter brought to the stellar surface during the first dredge-up. During the AGB phase of low-mass stars, however, the Mg-isotopic composition can be altered by p-capture reactions in the H-burning shell and by α-capture on 22Ne and n-capture reactions in the He-burning shell (see discussion in Zinner et al. 2005; Kodolányi et al. 2014). Effects on Mg-isotopic compositions remain small as long as C/O < 1, i.e., when O-rich dust can form. For example, the 2 M⊙ solar metallicity AGB star model of Zinner et al. (2005) predicts enhancements in 25Mg/24Mg and 26Mg/24Mg of less than 20‰ when C/O < 1 and if 26Al decay is ignored. The latter is justified for the presolar silicates from this study as long as 26Al/27Al is <0.01 (see above), which is largely true for presolar oxides; even lower anomalies in 25Mg/24Mg of <9‰ and in 26Mg/24Mg of <12‰ are predicted by the 2 M⊙ solar metallicity AGB star model of Cristallo et al. (2015). This suggests that the linear trend seen in the Mg-three-isotope plot (Figure 5) represents mostly GCE.
It has been recognized for more than 20 years that the 18O/16O ratios of presolar oxides span a wider range than can be explained by nucleosynthesis and dredge-up processes in red giant and AGB stars (Nittler et al. 1997, 2008). In fact, it was shown that a simple GCE model can explain the distribution of O-isotopic compositions of Group 1 and 3 oxides reasonably well (Nittler 2009). This model assumes an average metallicity of [Fe/H] = +0.05 for the local Galactic disk at the time of solar birth, i.e., about 12% higher than solar; an age–metallicity relationship with slope −0.02 dex Gyr–1; and a metallicity spread of approximately 0.06–0.09 dex (1σ) for stars of a given formation time. This spread is lower than the metallicity spread of 0.2 dex inferred from astronomical observations (Holmberg et al. 2007). Oxygen-isotopic ratios are expected to increase with time, and initial 18O/16O ratios can be considered proxies for the metallicity of the parent stars. Also, according to GCE models, both 25Mg/24Mg and 26Mg/24Mg increase with metallicity in the Galaxy (Timmes et al. 1995; Kobayashi et al. 2011; Fenner et al. 2013). One would therefore expect a positive correlation between Mg-isotopic compositions and 18O/16O ratios of Group 1 silicates if the GCE interpretation is correct. It should be noted, however, that the correlation between Mg-isotopic compositions and 18O/16O does not necessarily need to be perfect due to local heterogeneities in the ISM. Such heterogeneities are responsible for, e.g., the scatter of data in the correlation between δ46Ti and δ29Si in SiC mainstream grains, which is interpreted to largely reflect GCE (see below). The existence of a possible relationship between δ25Mg and 18O/16O was explored by Nittler et al. (2008) for Group 1 hibonite grains and for Group 1 spinel grains reported by Zinner et al. (2005). Nittler et al. (2008) calculated initial 18O/16O ratios of the parent stars by backtracking the evolution of O-isotopic compositions during the first dredge-up using the models of Boothroyd & Sackmann (1999). While the initial 18O/16O ratios of the spinel grains discussed by Nittler et al. (2008) span a rather large range (from 0.7 to 1.2 times solar), their δ25Mg values are mostly normal; i.e., there is no correlation between these two quantities. This has been interpreted to be the result of isotope exchange for Mg, either in space or in the meteorite parent body, without erasing the O-isotope anomaly. The existence of Mg isotope anomalies in some of the spinel grains, however, shows that Mg isotope anomalies can survive interstellar or solar system processing. Of particular interest in this respect is a Group 1 spinel grain with high 25Mg/24Mg and low initial 18O/16O (grain M20 from Zinner et al. 2005) that most likely reflects an unusual initial composition, perhaps through a binary mass transfer process (Nittler et al. 2008). The hibonite grains discussed by Nittler et al. (2008) reveal a different picture, as there is a moderate positive correlation between δ25Mg and the initial 18O/16O ratios, indicative of GCE. One outlier, grain KH14, has a low δ25Mg of ∼−200‰ together with a high initial 18O/16O, which was interpreted by Nittler et al. (2008) to reflect local heterogeneities in the ISM due to incomplete mixing of supernova (SN) ejecta. Other Group 1 presolar spinel grains with similarly low 25Mg/24Mg ratios were later reported by Gyngard et al. (2010), suggesting that there might be a distinct population of O-rich presolar grains with δ25Mg of ∼−200‰.
In Figure 7, we show δ25Mg versus initial 18O/16O for the Group 1 silicate grains from this study. Initial 18O/16O ratios were calculated following the approach by Nittler et al. (2008). At first glance, there is no correlation between δ25Mg and initial 18O/16O if the whole data set is considered. In Figure 7, we also show the prediction from the GCE model of Timmes et al. (1995) extended to supersolar metallicities, which was shown to give a good match for Group 1 oxide grains with high δ25Mg (Nittler et al. 2008). The GCE line based on Timmes et al. (1995) in Figure 7 was inferred from predicted 18O/16O ratios at [Fe/H] = −0.3 (18O/16O = 0.56 × solar) and [Fe/H] = 0 (18O/16O = 1.26 × solar); corresponding δ25Mg values are −150‰ ([Fe/H] = −0.3) and +70‰ ([Fe/H] = 0), respectively. The five Group 1 silicate grains with Mg isotope anomalies of >2σ form a linear array slightly to the left of the Timmes et al. (1995) GCE line. We will consider these grains as candidates to best represent the GCE of Mg and O and call them category A grains. The remaining six Group 1 grains are called category B grains. Two of the category B grains overlap with the trend of category A grains defined in Figure 7 and may be "hidden" category A grains. Four of the category B grains are clearly off the trend defined by category A grains and may have experienced Mg isotope exchange, either in interstellar space or in the meteorite parent bodies, as similarly proposed for the majority of presolar spinel grains (see above). High Fe concentrations in presolar silicates have been taken as evidence for secondary processing in the meteorite parent body (Floss & Haenecour 2016). It is remarkable in this respect that grain EET_10_5, the only category B grain for which Fe/Mg ratios are available, has the highest Fe/Mg ratio among the silicates of this study (Table 1). We also note that the four category B grains that are clearly off the trend of category A grains in Figure 7 tend to have higher Si/Mg ratios (0.98 ± 0.12), close to pyroxene composition, compared to category A grains (0.70 ± 0.14), whose Si/Mg ratios are closer to olivine composition. Misidentification of category B grains with true δ25Mg values along the trend of category A grains in ion images acquired during Mg isotope measurements, which would have led erroneously to normal Mg-isotopic ratios, although unlikely (see Section 2), cannot be completely ruled out. For grains Kry_I_42 and MET_01B_61, however, we can definitely rule out this possibility, as expected δ25Mg anomalies would have been approximately −100‰ and +200‰ (see Figure 7), which could not have been overlooked upon visual inspection of Mg isotope ratio images. Krymka is an ordinary chondrite of petrologic type 3.1; i.e., it has seen some thermal metamorphism that could have erased Mg isotope anomalies (see also the discussion on presolar spinel in Krymka in Nittler et al. 2008). Furthermore, the parent star of Kry_I_42 could have experienced CBP, which would mean that the 18O/16O ratio cannot be taken as a measure for metallicity. This view is supported by its low 18O/16O ratio of ∼0.001, which comes close to those of Group 2 grains (Figure 4). It is, however, unclear how large the effect of CBP on the Mg-isotopic composition of this grain would be. The interpretation of the inferred initial 18O/16O ratio of grain MET_01b_61 is complicated by its large error (Figure 7), and it may not be as much off the trend defined by the category A grains as it appears (the actual difference is <3σ).
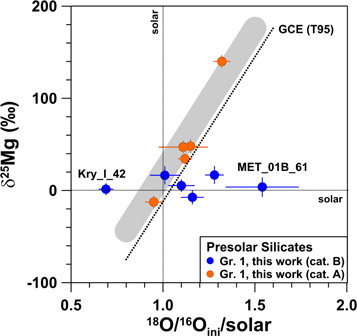
Figure 7. The δ25Mg values of Group 1 silicates from this study vs. the inferred solar-normalized initial 18O/16O ratios of their parent stars. The δ25Mg values are corrected for isotope dilution caused by beam tailing (see Section 2). Model predictions for GCE by Timmes et al. (1995) are shown by the thick dotted line, labeled "GCE (T95)," and solar compositions are shown by thin dotted lines. Category A grains are shown in orange and category B grains in blue (see text for details). Category A grains plot parallel to the left of the GCE (T95) line, visualized by the gray shaded area. Errors are 1σ.
Download figure:
Standard image High-resolution imageIn an Mg-three-isotope representation, four of our category A grains plot along a line with slope ∼0.5 and a nonzero, slightly positive intercept (Figure 8). If we include the fifth category A grain, EET_07_25, which is off the trend defined by the other grains, then an error-weighted linear regression (least-squares fit; Bevington & Robinson 1992) gives δ25Mg = (0.61 ± 0.15) × δ26Mg-(4 ± 17) (Figure 8). We call this the Mg mainstream line. The 2σ upper limit on the slope is slightly lower than the slope of ∼1 predicted by GCE models at around solar metallicity (Timmes et al. 1995; Kobayashi et al. 2011; Fenner et al. 2013) but compatible with the slope of 0.85 ± 0.54 inferred by Kodolányi et al. (2014) from a compilation of Mg isotope data for Galactic thin disk stars (Tomkin & Lambert 1980; Barbuy 1985; McWilliam & Lambert 1988; Gay & Lambert 2000; Yong et al. 2003), albeit the slope of the latter has a large uncertainty. The inferred slope of ∼0.6 is largely determined by grain EET_10_29 and should therefore still be taken with care. Grain EET_10_29 has a comparatively large 18O/16O ratio, and we can safely rule out the possibility that it is an unrecognized Group 2 grain that may have larger 26Mg than 25Mg excesses (see discussion below for the Group 2 grain Acf_G1@1_15). Even if we would have underestimated the effect of dilution, e.g., because of choosing nonperfect grain boundaries when calculating Mg-isotopic ratios, the slope of the Mg mainstream line would change only marginally. This is because the Mg mainstream line goes, within errors, through the origin, which means that dilution shifts measured Mg-isotopic compositions largely along the Mg mainstream line to less extreme compositions. Similarly, partial Mg isotope equilibration in interstellar space or meteorite parent bodies would lead to Mg compositions along the Mg mainstream line, too. We also note that the average Mg-isotopic composition of the presolar silicates studied by Kodolányi et al. (2014), for which surrounding solar system material was sputtered away by FIB prior to the Mg isotope analyses, falls almost exactly on the Mg mainstream line inferred here (Figure 8).
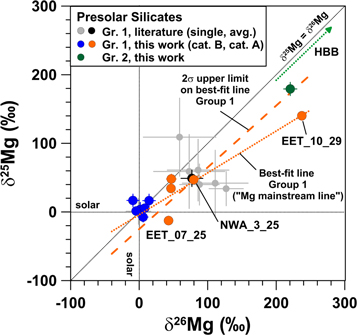
Figure 8. Dilution-corrected Mg-isotopic compositions given as per mill deviation from the solar system 25Mg/24Mg and 26Mg/24Mg ratios of presolar silicates from this study in comparison to data from the literature (single grains in gray and their average in black; Kodolányi et al. 2014). Category A Group 1 grains are shown in orange, category B Group 1 grains are shown in blue, and the Group 2 grain is shown in green. The solar system isotopic composition and the slope-1 line (δ26Mg = δ25Mg) are indicated by black dotted lines, and the best-fit line (error-weighted linear regression) through the category A Group 1 grains is shown by the orange dotted line, called the "Mg mainstream line." The orange dashed line is the best-fit line through category A Group 1 grains considering the 2σ upper limit of the slope and a y-axis intercept that was adjusted by eye to best match the category A Group 1 data points. The effect of HBB operating in intermediate-mass AGB stars is shown by the green arrow. Errors are 1σ.
Download figure:
Standard image High-resolution imageDecay of 26Al could have shifted the grains' original Mg isotope composition after their formation away from the predicted slope-1 line to more 26Mg-enriched compositions. However, because of low Al/Mg ratios (Table 1), 26Al/27Al ratios must have been exceptionally large for grains EET_07_25, EET_10_29, and NWA_3_25, which show the largest deviations from the slope-1 line, namely, 0.35 for grain EET_07_25, 0.3 for grain EET_10_29, and 0.7 for grain NWA_3_25, to bring initial Mg-isotopic compositions onto the slope-1 line. These 26Al/27Al ratios are about an order of magnitude higher than the highest values of previously studied Group 1 oxide grains (Zinner 2014). Other potential ways to shift Mg-isotopic ratios toward 26Mg-enriched compositions include much stronger imprints of nucleosynthetic and mixing processes on Mg-isotopic compositions than predicted for low-mass AGB stars when C/O < 1 and/or Mg isotope fractionation in the ISM or solar system. An Mg isotope fractionation at a level of 10–15‰ amu–1 (enrichment of the heavy Mg isotopes) has been observed in laboratory experiments for sputtering and vaporization of pure Mg and olivine, respectively (Arai et al. 1979; Wang et al. 1999). Evaporation and recondensation were also found to have caused mass-dependent isotopic shifts in calcium–aluminum-rich inclusions up to tens of ‰ in δ26Mg (e.g., Wasserburg et al. 1977). However, none of the above fractionations seems sufficient to account for the deviation of grains EET_07_25, NWA_3_25, and especially EET_10_29 from the slope-1 line. For example, EET_10_29 would require about a −100 ‰ offset in its δ25Mg and about a −200‰ offset in its δ26Mg to lie on a slope-1 line in Figure 8. An argument against significant evaporation-related kinetic fractionation of our category A grains' Mg isotopes is the lack of such isotopic effects in their O and Si isotope systems (Figures 4 and 6). Thus, local heterogeneities in Mg-isotopic compositions in the ISM due to incomplete mixing of SN ejecta may be the best explanation to account for most of the observed scatter in Mg-isotopic compositions around the Mg mainstream line. We point out that the observed scatter of category A grains around the Mg mainstream line is smaller than the scatter around the δ46Ti versus δ29Si trend in SiC mainstream grains, believed to largely represent GCE (e.g., Nittler 2005; see also Section 4.2).
4.2. Si- and O-isotopic Compositions of Group 1 Silicate Grains
As can be seen from the Si-three-isotope representation in Figure 6, most of the Si isotope data reported here are more precise than those obtained previously. The Group 1 presolar silicate grains from this study plot close to the SiC Si mainstream line, with δ29Si values between −10‰ and +200‰ and δ30Si values from −20‰ to +160‰. The five category B grains for which Si isotope data exist have solar Si-isotopic compositions within 2σ uncertainties (Table 2, Figure 9), which for some of them, as concluded for Mg, may be the result of isotope exchange, either in interstellar space or in the meteorite parent bodies. For the five category A grains, a best-fit line gives δ29Si = (1.14 ± 0.12) × δ30Si + (13 ± 12) (Figure 9); i.e., it is shallower than the SiC Si mainstream line but with a significance of only ∼2σ. The significance would be larger if the two category B grains, which might be "hidden" category A grains (see Section 4.1), would be considered. It should be noted that the slope of the SiC Si mainstream line was inferred from the Si isotope data of thousands of SiC grains, with many individual grains lying off the line. Consequently, when sampling only a few grains, as for the population of category A silicate grains presented here, the inferred slopes would be affected by individual outliers much more than for much larger data sets. Similarly, this also holds for the Mg mainstream line inferred here (see Section 4.1).
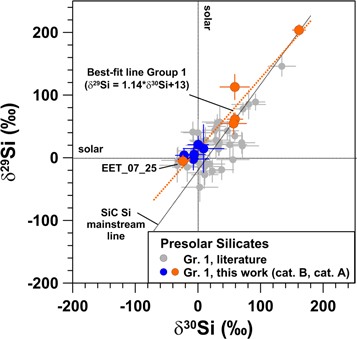
Figure 9. Dilution-corrected Si-isotopic compositions given as per mill deviation from the solar system 29Si/28Si and 30Si/28Si ratios of Group 1 silicates from this study in comparison to selected data (error in δ30Si of less than 30‰) from previous studies (in gray; Floss & Haenecour 2016). Category A Group 1 grains are shown in orange, category B Group 1 grains in blue. The solar system isotopic composition and the SiC Si mainstream line are indicated by black dotted lines, and the best-fit line (error-weighted linear regression) through the category A Group 1 grains is shown by the orange dotted line. Errors are 1σ.
Download figure:
Standard image High-resolution imageThe interpretation that the SiC Si mainstream line is dominated by GCE is undisputed (Zinner 2014). The close similarity of the SiC Si mainstream line with our best-fit line for Group 1 silicates from category A gives already strong arguments for the GCE interpretation of the latter. The small analytical errors of Si-isotopic compositions of Group 1 silicates from this study offer in principle the possibility to resolve small differences between Si correlation lines inferred for SiC mainstream grains and Group 1 silicates, e.g., due to higher contributions of s-processed matter in SiC grains (see below).
As for Mg, one would expect to find a positive correlation between δ29Si and initial 18O/16O ratios for the parent stars of category A grains if these quantities represent GCE. Indeed, there is a correlation between δ29Si and initial 18O/16O, as can be seen from Figure 10. The observed trend is a bit shallower than predicted by the GCE model of Timmes & Clayton (1996), which was inferred and extended to higher metallicities from predicted 18O/16O ratios at [Fe/H] = −0.3 (18O/16O = 0.56 × solar) and [Fe/H] = 0 (18O/16O = 1.26 × solar); corresponding δ29Si values are −500‰ ([Fe/H] = −0.3) and +260‰ ([Fe/H] = 0), respectively. It is interesting to note that astronomical observations of a variety of sources have not detected a variation in Si isotope ratios with galactocentric radius, which stands in contrast to the monotonically decreasing trend for the 18O/16O ratio (Monson et al. 2017) and our observations for category A grains. Following the approach of Nguyen et al. (2010), we have inferred a GCE relationship between δ29Si and initial 18O/16O, which is based on a tight correlation between 29Si/28Si and 46Ti/48Ti ratios in SiC mainstream grains (Figure 11, left; data from Hoppe et al. 1994; Alexander & Nittler 1999; Huss & Smith 2007) and a correlation between 46Ti/48Ti and initial 18O/16O ratios in presolar oxide grains (Figure 11, right; data from Choi et al. 1998; Hoppe et al. 2003), interpreted to represent largely GCE. Error-weighted linear regressions yield δ46Ti = (0.98 ± 0.08) × δ29Si-(11 ± 7) for SiC mainstream grains and  for Group 1 oxides. Combining the two equations gives
  , which is labeled as "SiC-Oxides GCE" in Figure 10. Note that this equation is different from the one presented by Nguyen et al. (2010), which was recognized to be in error (L. Nittler 2018, private communication). Gyngard et al. (2018) recently reported a slightly shallower slope for the δ46Ti versus δ29Si of SiC mainstream grains than inferred here, which would make the δ46Ti versus
  relationship a bit steeper. Our data for category A grains fall to the right of the SiC-Oxides GCE line but are fully compatible with this line if errors for the SiC-Oxides GCE line are taken into account (Figure 10). Finally, the good correlation between δ25Mg and δ29Si (Figure 12) rounds out the picture emerging from presolar silicate category A grains, suggesting that a subset of presolar Group 1 silicates carries resolvable signatures of the GCE of O, Mg, and Si isotopes.
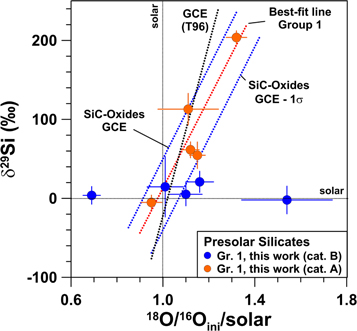
Figure 10. Dilution-corrected δ29Si values of Group 1 silicates from this study vs. the inferred solar-normalized initial 18O/16O ratios of their parent stars. Model predictions for GCE by Timmes & Clayton (1996) are shown by the thick dotted line, labeled "GCE (T96)," and solar compositions are shown by thin dotted lines. Category A grains are shown in orange, and category B grains are shown in blue. The left blue dotted line shows predictions when Ti- and Si isotope data from SiC mainstream grains (Hoppe et al. 1994; Alexander & Nittler 1999; Huss & Smith 2007) are combined with Ti- and O-isotope data from Group 1 oxide grains (from Choi et al. 1998; Hoppe et al. 2003), labeled "SiC-Oxides GCE," and the right blue dotted line, labeled SiC-Oxides GCE—1σ," shows the same line when the x-axis intercept is lowered by 1σ. Category A grains plot parallel to and between these two lines. Errors are 1σ.
Download figure:
Standard image High-resolution image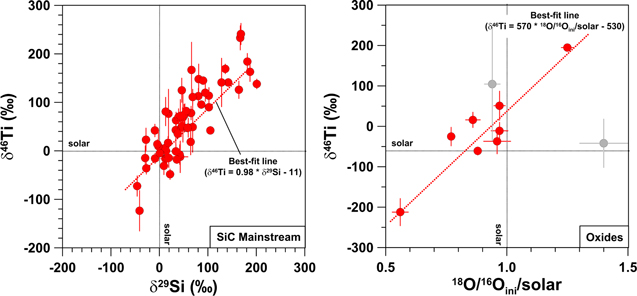
Figure 11. δ46Ti vs. δ29Si of SiC mainstream grains (left; data from Hoppe et al. 1994; Alexander & Nittler 1999; Huss & Smith 2007) and δ46Ti vs. inferred solar-normalized initial 18O/16O ratios of Group 1 oxide grains (right; data from Choi et al. 1998; Hoppe et al. 2003). Gray data points in the right panel indicate oxide grains with an error of >50‰ for δ46Ti. Solar-isotopic compositions are indicated by black dotted lines. Best-fit lines (error-weighted linear regressions) are shown by red dotted lines. Errors are 1σ.
Download figure:
Standard image High-resolution image
Figure 12. Dilution-corrected δ25Mg vs. δ29Si of Group 1 silicates from this study. Category A Group 1 grains are shown in orange, category B Group 1 grains in blue. Solar-isotopic compositions are indicated by black dotted lines, and the best-fit line (error-weighted linear regression) through the data of category A Group 1 grains is shown by the orange dotted line. Errors are 1σ.
Download figure:
Standard image High-resolution image
Three of the category A grains plot directly onto the SiC Si mainstream line. One category A grain plots to the left of the Si mainstream line but with Si-isotopic compositions compatible with this line when analytical uncertainties are considered, while grain EET_07_25 is significantly off to the 30Si-poor (or 29Si-rich) side (Figure 9). Silicon carbide can form around low- and intermediate-mass AGB stars when C/O > 1 (Lodders & Fegley 1995). In this phase of stellar evolution, material that experienced the s-process (slow neutron-capture reactions) is brought in large amounts to the stellar surface in the third dredge-up. This affects not only the isotopic compositions of typical s-process elements (e.g., Sr, Mo, and Ba) but also of Si-isotopic compositions to some extent. Models of 2 M⊙ AGB stars of solar metallicity predict enrichments in 29Si of up to 16‰ and in 30Si of up to 37‰ when C/O > 1 compared to the Si composition at stellar birth (Zinner et al. 2006; Cristallo et al. 2015). In contrast, Group 1 silicates must have formed around their parent stars when C/O < 1. In this phase of stellar evolution, fingerprints of the s-process from the third dredge-up are less pronounced, and the models referenced above predict enrichments in 29Si of <4‰ and 30Si of <9‰, i.e., smaller than the analytical errors of our Si isotope data (Table 2). The Si-isotopic composition of silicates can thus be expected to be more representative than that of SiC for the starting composition of Si in the grains' parent stars and a better proxy for the GCE of the Si isotopes. In this context, the shift of grain EET_07_25 relative to the SiC Si mainstream line to a 30Si-poorer composition by ∼40‰ is qualitatively consistent with expectations for the third dredge-up in AGB stars. The fact that grain EET_10_29, which has the highest δ29Si and inferred parent star metallicity among our category A grains, plots directly onto the SiC Si mainstream line (Figure 9) suggests that SiC mainstream grains with high δ29,30Si formed around AGB stars that had less s-process enrichment in their surface regions than the parent stars of SiC mainstream grains with low δ29,30Si (and, consequently, lower metallicity). This is in agreement with AGB star models that predict higher temperatures in the He shell (which enhance the efficiency of heavy Si isotope production by the s-process) and more extensive dredge-up of s-process matter (where 30Si is enriched relative to 29Si) in AGB stars of lower metallicities and/or higher masses (Zinner et al. 2006). This led to the proposed origin of the rare SiC Y and Z grains, which have low δ29Si values and 30Si-enriched compositions, in low-metallicity AGB stars (Hoppe et al. 1997; Amari et al. 2001; Nittler & Alexander 2003). From a study of C- and Si-isotopic compositions of more than 3000 presolar SiC mainstream, Y, and Z grains, Nittler & Alexander (2003) argued that the maximum mass of AGB parent stars must increase sharply with decreasing metallicity, also consistent with our inferences from the silicate data presented here.
4.3. Group 2 Grain Acf_G1@1_15
The Group 2 grain from this study (grain Acf_G1@1_15) has dilution-corrected O-isotopic ratios of 17O/16O = 9.5 × 10⁻⁴ and 18O/16O = 4.9 × 10⁻⁴ (Figure 4). It exhibits strong enrichments in 25Mg and 26Mg of about 180‰ and 220‰, respectively, and plots slightly above the Mg mainstream line (Figure 8). In the context of the proposed origin of Group 2 grains from intermediate-mass AGB stars that experienced HBB (Lugaro et al. 2017), the O-isotope data of grain Acf_G1@1_15 are compatible with the predictions for a 6 M⊙ AGB star and 35% dilution with matter of solar composition. The HBB is expected to lead to large 25Mg and 26Mg enrichments by factors of a few (Karakas & Lattanzio 2003), much larger than observed here, even with consideration of dilution. As discussed by Lugaro et al. (2017) for presolar oxide grains, this can be explained either by partial equilibration of Mg isotopes in the grains or by model deficiencies. Enrichments in 26Mg are predicted to be equal to or larger than those of 25Mg. For example, for a 6 M⊙ AGB star of solar metallicity that experienced HBB, δ25Mg/δ26Mg will be 0.96 (Karakas & Lattanzio 2003); i.e., mixing this composition with matter of solar composition would produce a mixing line in an Mg-three-isotope representation that passes slightly above the Mg-isotopic composition of grain Acf_G1@1_15 (Figure 8).
5. Summary and Conclusions
Here we have presented high-resolution Mg and Si isotope data of 12 presolar silicate grains (11 Group 1 and one Group 2 grain), which are discussed together with O-isotope data acquired previously. Based on δ25Mg values and inferred initial 18O/16O ratios, a measure of stellar metallicity, we have divided the Group 1 silicates from this study into category A and B grains. Category A grains show moderate-to-good correlations between δ25Mg, δ29Si, and inferred initial 18O/16O ratios, most likely the imprint of GCE. Category B silicate grains have close-to-normal Mg- and Si-isotopic compositions, possibly for some of them the result of isotope exchange in interstellar space or the meteorite parent bodies. In a δ25Mg versus δ26Mg representation, category A silicates plot along a line with slope ∼0.6, which we call the Mg mainstream line. Our preferred interpretation is that the Mg mainstream line represents largely GCE, with only minor imprints of dredge-up from low-mass AGB parent stars, 26Al decay, and Mg isotope fractionation in the ISM or solar system. The slope of the Mg mainstream line contrasts with the predicted slope-1 trend from GCE models. However, the 2σ upper limit on the slope of the Mg mainstream line is ∼0.9, which is not significantly lower than what GCE models predict. We point out that the number of Group 1 silicate grains for which high-resolution Mg isotope data exist (11 grains, five of which are category A grains) is still small, that the δ25Mg versus δ26Mg slope of category A grains is largely determined by one grain, and that presolar oxides reveal a complex picture for Mg isotope compositions (Zinner et al. 2005; Nittler et al. 2008; Gyngard et al. 2010), so that our conclusions regarding GCE must still be taken with care. More high-resolution Mg (and Si) isotope data of large presolar silicate Group 1 grains are clearly required to substantiate or disprove the GCE interpretation of the data of category A grains presented here. If it is confirmed, then it will be interesting to see whether GCE models of Mg isotopes can be fitted accordingly, e.g., in that uncertainties of reaction rates involved in the nucleosynthesis of the heavy Mg isotopes in intermediate-mass AGB stars and supernovae, the major suppliers of Mg to our Galaxy (Timmes et al. 1995; Kobayashi et al. 2011), are taken into account.
The Si isotope data of category A Group 1 silicates plot close to the SiC mainstream line. In AGB stars, silicates are expected to form before significant dredge-up of s-process matter occurs, which changes Si-isotopic compositions, and their Si-isotopic compositions can therefore be expected to largely represent GCE. Later, SiC forms, and may thus show detectable imprints of dredge-up on Si-isotopic compositions. One category A grain with δ29Si ∼200‰ falls directly onto the SiC mainstream line, suggestive of only a little dredge-up of s-process matter in the parent stars of SiC mainstream grains with high δ29Si (and thus high metallicity), even less than predicted by stellar models. Another category A grain with low δ29Si (and, consequently, comparatively low metallicity of its parent star) plots significantly to the left of the SiC mainstream line. This is in agreement with stellar models that predict more surface enrichment in s-process matter for stars of lower metallicities and/or higher masses. The best-fit line for category A silicates in the δ29Si–δ30Si space is somewhat shallower than the SiC mainstream line, however, with a significance of only ∼2σ. It will be interesting to see whether future high-resolution studies of additional Group 1 silicate grains can substantiate our findings. Extension of high-resolution isotope studies of presolar silicates to other elements, e.g., Ca and Fe, could provide additional constraints for models of stellar nucleosynthesis and GCE.
PH thanks the International Space Science Institute (ISSI) in Bern, Switzerland, for hospitality and financial support for a visit in May/June 2018, when a first version of this manuscript was written. We thank Antje Sorowka for her help with SEM analyses, Elmar Gröner for technical support on the NanoSIMS, and Larry Nittler for his helpful and constructive review. Meteoritic thin sections were provided by the Natural History Museum in Vienna (Acfer 094), the Natural History Museum in London (NWA 801), and the Antarctic Search for Meteorites (ANSMET) program (EET 92161, MET 00426). US Antarctic meteorite samples are recovered by the ANSMET program, which has been funded by NSF and NASA, and characterized and curated by the Department of Mineral Sciences of the Smithsonian Institution and Astromaterials Curation Office at NASA Johnson Space Center.
Footnotes
- 1
δxSi = [(xSi/28Si)grain/(xSi/28Si)std−1] x 1000; x = 29, 30; (xSi/28Si)std: terrestrial standard ratio.