


Abstract
We study the metallicity distribution and kinematic properties of 4680 A/F/G/K-type giant stars with 5 kpc selected from the LAMOST spectroscopic survey. The metallicity distribution of giant stars with kpc can be described by a three-peak Gaussian model with peaks at [Fe/H] ∼ −0.6 ± 0.1, −1.2 ± 0.3 and −2.0 ± 0.2, corresponding to the ratio of 19%, 74%, and 7%, respectively. The [α/Fe] is used to associate the three peaks with the thick-disk, inner-halo and outer-halo components of the Galaxy. The metallicity distribution of these giant stars, which is fit with Gaussians corresponding to the three components, show a growing fraction of inner-halo components and declining fraction of the thick-disk components with increasing distance from the Galactic plane. Adopting a galaxy potential model, we also derive the orbital parameters of the sample stars, such as orbit eccentricity and rotation velocity. The peak values of derived orbital eccentricity for stars covering different metallicity regions maintain e ∼ 0.75, independent of height above the plane, within the range 15 kpc. By comparing the MDFs of stars in different rotation velocity intervals, we find that the majority of the retrograde stars are more metal-poor than the prograde stars.


1. Introduction
The Galactic halo comprises only 1% of the total stellar mass in our galaxy. However, due to the very old age (∼10–13 Gyr) of most halo stars, they play a pivotal role in our study of the formation and evolution of our galaxy. In our current understanding of the evolutionary process that formed the halo stars, the different components of the halo have different formation mechanisms: (1) the accreted halo stars found in the outer halo formed mainly through the accretion of smaller stellar systems like dwarf spheroidal (dSph) galaxies (Sales et al. 2007; Diemand et al. 2008; Springel et al. 2008; Klypin et al. 2011); (2) the "in situ" halo stars primarily formed from dissipative collapse of gaseous material onto the central region of the Galaxy (Zolotov et al. 2010; Font et al. 2011; Cooper et al. 2015), and were then joined by stars formed in the disk component and then kicked into the halo. The proposed mechanisms for ejecting disk stars into the halo include dwarf galaxy heating (Purcell et al. 2010), binary supernova ejection (Bromley et al. 2009), and other gravitational mechanisms.
Massive accretion events are believed to heat more metal-rich disk stars so that they are ejected into the halo (Purcell et al. 2010). This theory is supported by recent observations. For example, Hawkins et al. (2015a) found a metal-rich halo star in the RAVE spectroscopic survey that has likely been dynamically ejected into the halo from the Galactic thick disk. Using the first Gaia data release, metal-rich halo stars have been discovered in the local stellar halo (Bonaca et al. 2017). However, up until now, the vast majority of stars found in the halo are the metal-poor stars, with metal abundances less than one-tenth of the solar value (Chiba & Beers 2000; Carollo et al. 2007, 2010).
In recent decades, evidence for the dual halo (the inner-halo and outer-halo populations) has been found by Carollo et al. (2007, 2010) and Beers et al. (2012). Other works (de Jong et al. 2010; Kinman et al. 2012; Hattori et al. 2013; Kafle et al. 2013, 2017; Chen et al. 2014; Fernandez-Alvar et al. 2015; Das & Binney 2016) that trace the more distant halo with giant stars or BHB stars also provide evidence for the duality of the halo. The two components exhibit distinct spatial density profiles, kinematics, and metallicities. For example, the inner halo demonstrates a flat density profile, and the nearly spherical profile in outer halo. Carollo et al. (2007, 2010) provided the metallicity distribution functions (MDFs) of inner halo and outer halo which peaks at [Fe/H] ∼ −1.6 and [Fe/H] ∼ −2.2, respectively. An et al. (2015) used a sample of stars from SDSS to discover that the metallicity distribution of halo stars can be described by two Gaussian components with peaks at [Fe/H] ∼ −1.4 and −1.9 in the distance range 5 kpc < dhelio < 10 kpc. In addition, the inner-halo stars, with distances up to 10–15 kpc from the Galactic center, exhibit a small net prograde rotation around the center of the Galaxy with Vϕ ∼ 7 ± 4 km s−1, and the outer-halo stars which dominate in the region beyond 15–20 kpc exhibit a retrograde net rotation with Vϕ ∼ −80 ± 13 km s−1. The difference in the characteristics of the components likely results from different formation mechanisms. Observations of spatial substructure in the Galaxy show that the outer halo was likely built purely via mergers (Newberg et al. 2002; Belokurov et al. 2006; Deason et al. 2015), while the formation process of the inner halo is still debated. Some have suggested that the majority of the inner-halo stars accreted in 10 Gyr ago, though some of them may formed in situ (Norris 1994; Chiba & Beers 2000). By studying the right structure of the nearby stellar halo with data from Gaia and RAVE, Helmi et al. (2017) found that a high fraction of the local halo stars are on retrograde orbits, and provided the evidence that the inner halo was built entirely via accretion.
Studies of the detailed chemical abundances of halo stars have sought to place further constraints on the formation of the Galactic halo (Nissen & Schuster 1997; Stephens & Boesgaard 2002; Nissen & Schuster 2010; Feltzing & Chiba 2013; Haywood et al. 2013). Because the α-element to iron abundance ratio [α/Fe] reflects the nucleosynthesis and chemical enrichment history of a stellar population (Tinsley 1979; Matteucci & Greggio 1986), the distribution of [α/Fe] provides information about the birthplace of the stars. Most α− elements are produced in the explosion of Type II supernovae, which increase element abundance in a timescale of 106–107 years. Type Ia supernovae produce primarily iron peak elements (especially Fe) and enrich the interstellar medium after a longer timescale (∼109 year; Maoz & Badenes 2010). The [α/Fe] abundance therefore indicates the timescale and environment in which a stellar population is born.
The [α/Fe] abundance has been shown to be very powerful at disentangling the various Milky Way components, indicating that they have had different formation histories. Recent research found that the thick-disk and the inner-halo stars have high-[α/Fe] abundances (Ishigaki et al. 2012). Nissen & Schuster 2010 demonstrated that in a local sample of stars, those with high [α/Fe] have a constant [α/Fe] of ∼0.3 in the metallicity range −2 < [Fe/H] < −0.5, while stars with lower [α/Fe] of about 0.15 exhibit a decrease in [α/Fe] toward higher metallicity; the two halo populations can be separated based on measurements of [α/Fe]. Carollo et al. (2012, 2014) used Carbon-enhanced stars to show that the Galactic halo is composed of two stellar populations instead of one. Hawkins et al. (2015b) discovered that the thick disk and halo are not chemically distinct in [α/Fe], indicating a smooth transition between thick disk and halo. They analyzed the chemical distribution of stars with −1.20 < [Fe/H] < −0.55 in the SDSS-III's Apoche Point Observatory Galactic Evolution Experiment (APOGEE; Eisenstein et al. 2011) to argue that the Galactic halo and thick disk are formed from chemically similar gas, but one component is pressure-supported while the other is angular momentum-supported.
A better understanding of the Galactic halo requires more information such as chemical abundance and kinematics of large number of individual stars. The ongoing Large Sky Area Multi-Object Fiber Spectroscopic Telescope (LAMOST) survey has released more than 6 million stellar spectra with stellar parameters in the DR4 catalog. This data set allows us to expand on previous studies of the halo and to constrain the structure and evolution of the Galaxy.
In this study, we make use of A/F/G/K-type giant stars selected from the LAMOST survey to explore the metallicity distribution and kinematics of the Galactic halo. The outline of this paper as follows. In Section 2, we present a brief overview of the LAMOST observational data and list the selection criterion for our stellar sample. In Section 3, we present the observed metallicity distribution of halo stars. Kinematics analysis of halo stars are presented in Section 4. A brief summary is given in Section 5.
2. Data
LAMOST is a large field multi-object telescope located at Xinglong Station, which is part of the National Astronomical Observatories, Chinese Academy of Sciences (NAOC). LAMOST is a reflecting Schmidt telescope with its optical axis fixed along the north–south meridian. It can take 4000 spectra simultaneously in a single exposure (Cui et al. 2012; Deng et al. 2012; Zhao et al. 2012). Its effective aperture varies from 3.6 to 4.9 m in diameter, depending on the altitude and azimuth observed, and it has a large, 20 deg2 field of view. The LAMOST spectrographs have a resolution of R ∼ 1800 and the observed wavelength range spans 3700 Å ∼ 9000 Å (Cui et al. 2012). The survey reaches a limiting magnitude of r = 17.8 (where r denotes magnitude in the SDSS r-band), but most targets are brighter than r ∼ 17. The LAMOST Spectroscopic Survey of the Galactic Anticentre (LSS-GAC; Xiang et al. 2017b) adds distance, [α/Fe] abundance ratio ([α/M]), elemental abundances [C/H] and [N/H], and absolute magnitudes MV and MKs to the LAMOST Data Release catalogs.
The stellar parameters ([Fe/H], log(g)) are derived with the ULySS software by template matching with the MILES spectral library (Sánchez-Blázquez et al. 2006; Wu et al. 2011). The accuracy of the pipeline was tested by selecting 771 stars from the LAMOST commissioning data with spectra of relatively good quality, and comparing with the SDSS/SEGUE Stellar Parameter Pipeline (SSPP). The precisions of the log(g) and [Fe/H] were found to be 0.34 dex and 0.16 dex, respectively. The [α/Fe] are derived by template matching with the Kurucz synthetic spectral library (Li et al. 2016; Xiang et al. 2017b). To provide a realistic error estimate for [α/Fe], the random error induced by spectral noise is combined with the systematic error, which is assumed to have a constant value of 0.09 dex. The systematic error was estimated by a comparison with high-resolution measurements (Li et al. 2016). A cross-identification of the LSS-GAC catalogs with APOGEE giant stars with 3500 < Teff < 5300 K and log(g) < 3.8 yields 3533 common objects that have a signal-to-noise ratio (S/N) higher than 50 in the LAMOST spectrum. The standard deviation of the residuals between these two catalogs are only 0.04 dex for [α/Fe] (as shown in the upper right panel of Figure 8 of Xiang et al. 2017a).
The data used in our work from two catalogs. The stellar parameters ([Fe/H], log(g)) and the line-of-sight velocity are from the LAMOST DR4 A/F/G/K-type stars catalog, and the proper motion and distance are from the LSS-GAC catalog. There are 3350,614 with measurements in both of these catalogs. In this work, we select giant stars by restricting 0 < log(g) < 3.5 and S/N > 15 in the g-band; we eliminate those stars without stellar atmospheric parameters (including spectral types, [Fe/H], [α/Fe], log(g), radial velocity, distance and proper motion).
To check the systematics of the radial velocities, we match our data with the APOGEE data released in SDSS DR14 (average S/N > 15) and obtain 17203 giant stars in common. Figure 1 shows that the radial velocity offset between LAMOST DR4 stars and APOGEE stars in SDSS DR14 catalog is −7.328 km s−1 with a standard deviation is 8.095 km s−1. Jing et al. (2016) reports the offset in radial velocities between the LAMOST dwarfs and the SDSS-SSPP concentrate on −6.76 km s−1 with a dispersion of 7.9 km s−1. Tian et al. (2015) also finds that the radial velocity derived from the LAMOST pipeline is slower by 5.7 km s−1 relative to APOGEE. In this paper, we reduce the LAMOST radial velocities to match the other surveys.

Figure 1. Offsets of the radial velocities between LAMOST and APOGEE. The histogram shows the distribution of radial offset for 17203 giant stars found in both surveys, and the solid curve is a Gaussian fit to this distribution. Note that LAMOST spectra are systematically offset by −7.328 km s−1 from the APOGEE measurements.
Download figure:
Standard image High-resolution imageThe proper motion from PPMXL catalog (Roeser et al. 2010), combined with the tabulated distances and radial velocities, are used to derive the Galactocentric Cartesian velocity components of U, V, W, and Galactocentric cylindrical velocity components of Vϕ, VR, VZ. Here, we adopt a Local Standard of Rest (LSR) velocity VLSR = 220 km s−1 (Gunn et al. 1979; Feast & Whitelock 1997), and a solar peculiar motion (U⊙, V⊙, W⊙) = (−11.1, − 12.24, 7.25) km s−1(Schönrich et al. 2010), and R⊙ = 8 kpc.
We add the criteria of the relative error of distance less than 0.4, the error of proper motion less than 10 mas yr−1, and (, , ) < 500 km s−1 (the escape speed of the Galaxy). The upper panel of Figure 2 gives the spatial distribution in R − Z plane for the sample of total 350,385 giant stars. As shown in Figure 2, most stars lie in the region 20 kpc. In order to derive possible halo sample stars, we restrict the , as shown in the lower panel of Figure 2. There are 5300 stars with kpc.


Figure 2. The space distribution in cylindrical Galactic coordinates for the sample of 350,385 giant stars (upper panel), and 5300 giant stars with (lower panel). Z is the distance from the plane of the Galaxy, and R is the projected distance from the Galactic center in the Galactic plane. Note that most stars have .


Download figure:
Standard image High-resolution image3. The Metallicity Distribution of Halo Stars
Galactic components have been distinguished in phase space, and by using [α/Fe] to probe the Galactic components, using relatively large samples of high-resolution spectra (Nissen & Schuster 2010; Feltzing & Chiba 2013; Haywood et al. 2013). It has been shown that the α-element to iron abundance ratio [α/Fe] is a good indicator of the Galactic chemical enrichment history (Lee et al. 2011). In our sample, the upper panel of Figure 3 shows the chemical abundance distribution [α/Fe] versus [Fe/H]. As shown in Figure 3, we found that the sample stars in the region [Fe/H] > −1 are divided into two sequences: a lower α sequence and an higher α sequence. The two sequences correspond to the lower [α/Fe] thin-disk component and the higher [α/Fe] thick-disk component (Lee et al. 2011). The lower panel shows the distribution of [α/Fe] versus metallicity for the possible halo stars (red color) and total stars (blue color), respectively.

Figure 3. Upper panel: chemical abundance distribution, [α/Fe] vs. [Fe/H], of sample stars; the color coding corresponds to the number density in each pixel. Lower panel: the distribution, [α/Fe] vs. [Fe/H], for likely halo stars (red color) and all stars (blue color), respectively.
Download figure:
Standard image High-resolution imageComparing the upper and lower panels of Figure 3, the halo stars have a similar distribution of [α/Fe] (0.1 ≤ [α/Fe] ≤ 0.3) to that of thick-disk stars within −1.0 < [Fe/H] < −0.5; most halo stars are concentrated in more metal-poor regions. Hawkins et al. (2015b) also discovered that there is no chemical distinction between canonical thick-disk and canonical halo stars in APOGEE data with −1.20 < [Fe/H] < −0.55. We notice that a small fraction of our sample stars have a lower value of [α/Fe], which indicates the presence of disk stars in our sample; we therefore remove the stars with both low α-element abundance and higher metallicity ([α/Fe] < 0.1 and [Fe/H] > −1), which reduces the sample to 4850 halo stars.
In order to remove the influence of the Sagittarius stream on our results, we have tagged Sagittarius in the distribution of energy E versus total angular momentum L. We adopt the gravitational potential model provided by Xue et al. (2008), which includes three components: a spherical Hernquist (1990) bulge, an exponential disk, and an NFW dark matter halo (Navarro et al. 1996). The energy E is derived by gravitational potential and total velocity:

where . The total angular momentum L:


where and . Sagittarius stream member stars are primarily found at E = −90000 (km s−1)2 and L = 6000 kpc km s−1 (Bird et al. 2018). As shown in Figure 4, we mark these stars with green points, and there are 170 giant stars. We remove them from the sample and remain 4680 halo stars.


Figure 4. Energy E vs. total angular momentum L for the full sample of 4850 halo stars (black points). Stars identified with the Sagittarius stream have been marked in green.
Download figure:
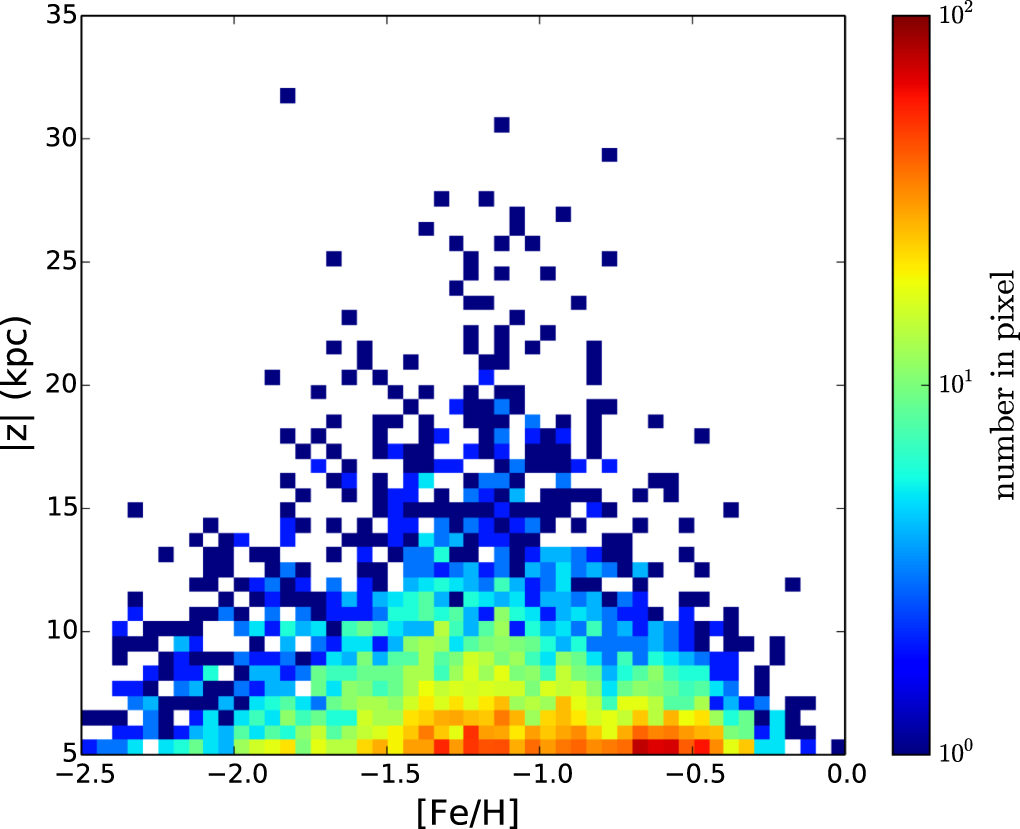
Standard image High-resolution imageFigure 5 shows vertical distance versus metallicity [Fe/H] in our final sample of primarily halo stars. The figure shows that metallicity is concentrated in two peaks: one located between [Fe/H] ∼ −0.5 and ∼−0.8, and the second between [Fe/H] ∼ −1 and ∼−1.3. The higher metallicity peak probably represents a small percentage of thick-disk stars that remain in the sample despite the distance cut ( kpc) and the selection based on α-elements ([α/Fe] ≤ −1). It is difficult to derive a pure halo sample of stars. In addition, our sample is small enough that it does not include representatives of very metal-poor stars ([Fe/H] < −2.0), especially for . Therefore, we restrict our study of the metallicity distribution of halo stars to the region . In order to explore the relationship between MDFs and distance from the Galactic plane, we divide the sample stars into different distance intervals. Assuming the MDFs of stars from a single stellar population are expressed by a single Gaussian function, we fit the observed MDFs with Gaussian mixture model and derive the optimal parameters of each component (Zuo et al. 2017).


Figure 5. The distribution of vertical distance vs. metallicity [Fe/H]; the color coding corresponds to the number density in each pixel.

Download figure:
Standard image High-resolution imageWe determine the optimal number of Gaussian functions using the Bayesian information criterion (BIC):

where L0(M) represents the maximum value of the likelihood function of the model, N is the number of data points, and k represents the number of free parameters. More information about the BIC can be found in Ivezić et al. (2014). Figure 6 shows the lowest BIC fits to the data: a three-peak, three-peak, three-peak, and two peak Gaussian mixture models fit to MDFs with 5 kpc 15 kpc, 5 kpc 7 kpc, 7 kpc 10 kpc, and 10 kpc 15 kpc, respectively. We infer that blue, green, and red curves represent the thick-disk, inner-halo, and outer-halo components, with peaks at [Fe/H] ∼ −0.6 ± 0.1, −1.2 ± 0.3, and −2.0 ± 0.2, respectively, in the distance of 5 kpc 15 kpc.


Figure 6. The metallicity distribution of sample stars in different intervals of distance from the Galactic plane. The red, green, and blue curves represent components associated with the outer-halo, the inner-halo, and the thick-disk components, and their sum is illustrated by the black curve.
Download figure:
Standard image High-resolution imageThe upper panel in Figure 6 shows that there are three components in the distance interval, and the inner-halo component occupies the vast majority. The lower three panels in Figure 6 illustrate the change in the fraction of each component with increasing distance . Table 1 gives the detailed results of the mean metallicites, weights, and full width at half maximum (FWHM) of the three components in different vertical distance intervals. These results show that the proportions of thick disks decline from 35% to nearly 0%, so that the bin farthest from the Galactic plane can be fit with only two components. The fraction of stars in the inner-halo component rises from 52% to 91% with increasing distance from the plane. However, for the outer-halo component, it shows that there is no clear correlation between the proportion in this component and increasing distance, due to the incompleteness of very metal-poor stars at large distances from the plane in our sample.

Table 1. The Mean Metallicites, Weights and FWHM of Thick-disk, Inner-halo, and Outer-halo in Different Distance Intervals
| Distances | Thick-disk | Inner-halo | Outer-halo | ||||||
|---|---|---|---|---|---|---|---|---|---|
| (kpc) | Mean | Weight | FWHM | Mean | Weight | FWHM | Mean | Weight | FWHM |
| −0.6 | 19% | 0.3 | −1.2 | 74% | 0.8 | −2.0 | 7% | 0.5 | |
| −0.6 | 35% | 0.4 | −1.2 | 52% | 0.6 | −1.8 | 13% | 0.6 | |
| −0.6 | 8% | 0.3 | −1.2 | 89% | 0.9 | −2.2 | 3% | 0.3 | |
| ⋯ | ⋯ | ⋯ | −1.2 | 91% | 0.8 | −1.9 | 9% | 0.5 | |


Download table as: ASCIITypeset image
Note that the result in Figure 20 of Carollo et al. (2010) shows the shift of metallicity peak from −0.6 at 0 kpc 1 kpc to −1.3 at 3 kpc 4 kpc, reaching to −1.6 at 6 kpc 7 kpc and −2.2 at . In our work, the inner halo and outer peak at [Fe/H] = −1.2 ± 0.3 and −2.0 ± 0.2. As compared with the results which peak at [Fe/H] = −1.6 and −2.2 from MS stars with 4 kpc of the sun in the SDSS survey by Carollo et al. (2007, 2010), our result is higher than their values. However, some other studies also give different results. For example, An et al. (2015) used a sample of main-sequence stars from SDSS and discovered that the metallicity distribution of halo stars peaks at [Fe/H] ∼ −1.4 and −1.9 in the distance range 5 kpc < d < 10 kpc. Zuo et al. (2017) used F/G main-sequence turnoff stars in the south Galactic cap to find that the halo stars peak at [Fe/H] ∼ −0.63, −1.45, and −2.0. Chen et al. (2010) used a large sample of red horizontal-branch to determine two peak metallicity distributions: one peaking at [Fe/H] ∼ −0.6, mainly originates from the thick disk, and the other peaking at [Fe/H] ∼ −1.3, generally belongs to the halo. Therefore, the exact metallicity peaks at a given between the present work, and those references are somewhat different due to sample selection of different spectral types of stars.


4. Kinematics of Halo Stars
4.1. Correlation of Orbital Eccentricities with Metallicity and Distance
Based on the gravitational potential model proposed by Xue et al. (2008), we compute the orbital eccentricity, e, defined as e = (rapo − rperi )/(rapo + rperi), where rapo and rperi represent the farthest and the closest extent of an orbit from the Galactic center, respectively. Errors in the derived orbital parameters for each star are primarily due to errors in the distance and proper motion. Figure 7 shows the distribution of derived orbital eccentricity for stars in different metallicity ranges and different intervals on distance from the Galactic plane of 5 kpc 7 kpc, 7 kpc 10 kpc and 10 kpc 15 kpc, respectively. For stars with −1.0 < [Fe/H] < −0.5, the canonical thick-disk stars exist in the range of 5 kpc 7 kpc, and the ratio of e < 0.4 declines with increasing vertical distance and decreasing metallicity. Farther from the Galactic plane the observed distribution of eccentricity is more consistent with the inner-halo stars, and the peak values maintain e ∼ 0.75 in most panels. But the peak values of lower left two panels, for metal-poor halo stars with −2.5 < [Fe/H] < −1.5, change to e ∼ 0.65, e ∼ 0.85, in vertical distance of 5 kpc 7 kpc and 7 kpc 10 kpc. We consider this distribution in the metal-poor regions reflects the contribution from an outer-halo population with a fraction of stars on high eccentric orbits, superposed on the inner-halo population. Figure 5 of Carollo et al. (2010) shows a similar distribution of orbital eccentricity in two different vertical distance intervals of 1 kpc 2 kpc and 2 kpc 4 kpc, and it also shows a linear eccentricity distribution for the metal-poor halo stars with −2.0 < [Fe/H] < −1.5. But the approximate linear distribution of eccentricity appears to not be prominent in our distribution. Comparing to their study, our sample stars have higher vertical distances, so the thick-disk stars have less influence, and our sample stars are dominated by halo stars.


Figure 7. Distribution of the orbital eccentricity in different metallicity ranges and different intervals on distance from the Galactic plane of 5 kpc 7 kpc, 7 kpc 10 kpc, and 10 kpc 15 kpc, respectively.


Download figure:
Standard image High-resolution image
Figure 8. The probability distributions of the metallicity for sample stars within , and rotation velocity () in the range 0–80 km s−1 (top left; 519 stars), 80–160 km s−1 (top right; 454 stars), 160–240 km s−1 (bottom left; 311 stars), 240–500 km s−1 (bottom right; 527 stars). Stars with prograde velocity are represented by the red histogram and retrograde velocity are shown by the blue histogram.


Download figure:
Standard image High-resolution image4.2. Correlation of Rotational Velocity with Metallicity
In this section, we study the correlation of rotational velocity with metallicity, [Fe/H]. Stars with vϕ > 0 km s−1 are prograde, while stars with vϕ < 0 km s−1 are retrograde. The Galactic disk has a rotation velocity of vϕ = 220 km s−1, and is thus prograde. To eliminate the influence of the thick-disk stars and obtain a pure halo sample, we selected only the 1889 stars in the sample with 7 15 kpc. We divide these stars into four velocity intervals. Figure 8 shows the MDFs in different vϕ intervals of prograde and retrograde velocities; there are 519, 454, 311, and 527 stars in intervals, [0, 80], [80, 160], [160, 240], and [240, 500], respectively. The number of retrograde stars, which are represented by the blue histogram, is 264, 224, 169, and 319 in each panel, from low to high angular speed.


As seen in this figure, the majority of the most metal-poor stars are retrograde. Zuo et al. (2017) also derived a similar result based on SCUSS and SDSS data. However, as they lacked radial velocity measurements, they only selected higher Galactic latitude (b < −45°) stars, because the rotational speeds of these stars were only related to the proper motions and relied much less on line-of-sight velocity measurements. In comparison to their work, our results have more distinct distributions of prograde and retrograde components in the halo sample.
5. Summary
Based on 4680 giant stars from the LAMOST DR4 stars, combined with measurements of [α/Fe], proper motion and distance from the LSS-GAC catalog, we investigate the metallicity distributions and kinematics of stars with 5 kpc. [α/Fe] and zmax are used to distinguish various components of the Galaxy. The distribution of [α/Fe] (0.1 ≤ [α/Fe] ≤ 0.3) is similar for the thick-disk and halo stars within the metallicity range −1.0 < [Fe/H] < −0.5; most halo stars are concentrated in metal-poor regions. To eliminate thin-disk and thick-disk stars from our sample, we remove the stars with [α/Fe] < 0.1. In addition, we select only stars with zmax > 5 kpc to increase the purity of the halo sample. Then, we study the metallicity distribution of the sample stars within 5 15 kpc.


The metallicity distribution can be described by three-peak Gaussian model with peaks at [Fe/H] ∼ −0.6 ± 0.1, −1.2 ± 0.3, and −2.0 ± 0.2, and weights of 19%, 74%, and 7%, corresponding to the thick-disk, inner-halo, and outer-halo, respectively. We also derive the mean metallicites and weights of three components in different distance intervals, and show that the proportions of thick-disk stars in the sample decline from 35% to nearly 0%; the metallicity distribution is well fit with only two components when kpc. For the inner-halo component, the proportions rise from 52% to 91% with the increasing distance. However, for the outer-halo component, our results show that there is no clear correlation between the proportion and the vertical distance, due to the incompleteness of our halo stars in very metal-poor and distant regions.

To better understand the kinematics of the sample stars, we derive their orbital parameters by adopting a gravitational potential model. According to the orbital eccentricity distribution in different metallicity ranges and different distance intervals , we notice that the canonical thick-disk stars exist in the range of 5 kpc 7 kpc and −1.0 < [Fe/H] < −0.5, and the ratio of e < 0.4 declines with increasing vertical distance and decreasing metallicity. Farther from the Galactic plane, the observed distribution of eccentricity is more consistent with the inner-halo stars, and the peak values maintain e ∼ 0.75, independent of height above the plane, within the range 15 kpc. Also, we study the correlation of rotational velocity with metallicity for sample stars within . By comparing the MDFs in different rotation velocity intervals, we find that the majority of the retrograde stars are more metal-poor than the prograde stars.


We thank especially the referee for insightful comments and suggestions, which have improved the paper significantly. This work was supported by joint funding for Astronomy by the National Natural Science Foundation of China and the Chinese Academy of Science, under Grants U1231113. This work was also by supported by the Special funds of cooperation between the Institute and the University of the Chinese Academy of Sciences, and China Scholarship Council (CSC). H.J.N. acknowledges funding from NSF grant AST-1615688. Funding for SDSS-III has been provided by the Alfred P. Sloan Foundation, the Participating Institutions, the National Science Foundation, and the U.S. Department of Energy Office of Science. This project was developed in part at the 2016 NYC Gaia Sprint, hosted by the Center for Computational Astrophysics at the Simons Foundation in New York City. In addition, this work was supported by the National Natural Foundation of China (NSFC, No.11373033, No.11373035, No.11625313, No.11573035), and by the National Basic Research Program of China (973 Program) (No. 2014CB845702, No.2014CB845704, No.2013CB834902). The Guoshoujing Telescope (LAMOST) is a National Major Scientific Project has been provided by the National Development and Reform Commission. LAMOST is operated and managed by the National Astronomical Observatories, Chinese Academy of Sciences.