


ABSTRACT
An accurate spectroscopic characterization of protonated oxirane has been carried out by means of state-of-the-art computational methods and approaches. The calculated spectroscopic parameters from our recent computational investigation of oxirane together with the corresponding experimental data available were used to assess the accuracy of our predicted rotational and IR spectra of protonated oxirane. We found an accuracy of about 10 cm−1 for vibrational transitions (fundamentals as well as overtones and combination bands) and, in relative terms, of 0.1% for rotational transitions. We are therefore confident that the spectroscopic data provided herein are a valuable support for the detection of protonated oxirane not only in Titan's atmosphere but also in the interstellar medium.
Export citation and abstract BibTeX RIS
1. INTRODUCTION
The study of Titan's atmosphere has attracted great attention due to recent measurements that revealed Titan's atmosphere to be characterized by a rich and complex organic chemistry (see Ali et al. 2013 and references therein). Furthermore, Titan is thought to represent a model of primitive Earth because its atmosphere contains significant quantities of carbon (∼2% CH4) and nitrogen (98% N2), and traces of oxygen (∼50 ppm CO; Raulin et al. 2009). Photochemical production of complex molecules containing C, N, O, and H is therefore possible, and so, the investigation of Titan's atmosphere might provide an unique opportunity to shed light on the organic evolution in the atmosphere of early Earth.
The Ion Neutral Mass Spectrometer (INMS) on the Cassini spacecraft is a dual-ion source quadrupole mass spectrometer designed to measure both ions and neutrals in the approximate mass range from 1 to 100 amu with a mass resolving capability of only one atomic mass unit between adjacent masses (Waite et al. 2004). This implies that the CO molecule cannot be mass resolved from the major species N2, nor can atomic oxygen be resolved from the second most abundant species, CH4. Similarly, for ionic species, we cannot distinguish the composition of water group ions, such as H2O+, from NH . The oxygen chemistry cannot therefore be constrained by instruments on board the Cassini spacecraft. On the other hand, the Ion Mass Spectrometer (IMS) of the Cassini Plasma Spectrometer (CAPS) measurements allowed for the definitive detection of O+ in Titan's upper atmosphere as a consequence of much larger precipitating fluxes from the magnetosphere than originally foreseen (Hartle et al. 2006).
Recent photochemical models suggest that those oxygen ions should be incorporated into CO and CO2: Hörst et al. demonstrated that the O+ flux is responsible for the synthesis of CO (Hörst et al. 2008). The (C, H, N, O) chemistry in the upper atmosphere of Titan may evolve from N2, CH4, and CO in the presence of ultraviolet radiation and energetic electron impact to complex species. The surprising detection of an important prebiotic species like oxirane (c-C2H4O) in experimental simulation of Titan's atmosphere including CO at the 100 ppm level on N2–CH4 mixtures (Bernard et al. 2003) clearly indicates that astrophysical observation of this molecule must be sought for its identification either in the infrared or millimeter-wave region. Moreover, this molecule has a significant proton affinity (PA; Hunter & Lias 1998), and thus in Titan's reducing environment it may undergo protonated via proton-transfer ion–neutral reactions with ions whose parent neutrals have a lower PA. The protonated oxirane may also initiate a completely new chemical pathway for complex prebiotic chemistry.
A surprising population of negative ions was first revealed by the CAPS electron spectrometer (ELS; Coates et al. 2007). Although there are not many studies on the kinetics of ion–ion recombination processes in the gas phase (Hickman 1979), it is anticipated here that protonated oxirane may even participate in diverse reactions with many strong nucleophiles such as OH−, NH , and CN−. As an example, the mutual neutralization between protonated oxirane c-C2H4OH+ and OH− may lead to the capture and formation of ethylene glycol, one of the larger interstellar organics. Under the origins of life theme, in this paper we carried out an accurate spectroscopic characterization of protonated oxirane, thus providing a valuable route to its identification in Titan's atmosphere and assignment of unidentified Cassini Composite Infrared Spectrometer (CIRS) infrared bands. An opportunity to detect protonated oxirane might also be provided by the James Webb Space Telescope (JWST), which will cover the infrared 5.0–29 μm wavelength range (Gardner et al. 2006). This molecule could also be searched for in the millimeter–submillimeter part of the spectrum through the Atacama large Millimeter/submillimeter Array (ALMA) as well as in the mid-infrared region by means of the high-resolution EXES instrument mounted on NASA's Stratospheric Observatory for Infrared Astronomy (SOFIA); further, the archived data from the HIFI instrument on the Herschel satellite might disclose signatures of protonated oxirane.
The astrophysical interest in protonated oxirane as a possible component of Titan's atmosphere has been pointed out above. While the investigation of the chemical reactions that can lead to the protonation of oxirane and those involving the protonated species itself will be the subject of future work, in this paper we report on its accurate spectroscopic characterization. This in turn can provide a valuable support to the detection of protonated oxirane not only in Titan's atmosphere but also in the interstellar medium. The spectroscopic signatures of protonated oxirane in interstellar clouds, in Titan's atmosphere, and in the environment of extrasolar planets reminiscent of young Earth will permit the establishment of a clear link between Titan's prebiotic atmospheric chemistry and organic chemistry in the atmosphere of primitive Earth. Therefore, searches for rotational and/or vibrational signatures with millimeter/submillimeter and infrared astronomy, respectively, will have a major impact on our understanding of prebiotic organic synthesis in the early Earth.
2. COMPUTATIONAL DETAILS
The coupled-cluster (CC) singles and doubles approximation augmented by a perturbative treatment of triple excitations (CCSD(T); Raghavachari et al. 1989) was employed in molecular structure and anharmonic force-field calculations. Harmonic force fields were also computed using the less expensive and less accurate second-order Møller–Plesset perturbation theory (MP2; Møller & Plesset 1934). CCSD(T) and MP2 calculations were carried out in conjunction with the correlation-consistent basis sets, (aug)-cc-p(C)VnZ (n = T, Q) (Dunning 1989; Kendall et al. 1992; Woon & Dunning 1995), with the quantum-chemical CFour5 program package employed throughout.
Since the present spectroscopic characterization is based on rotational and vibrational spectroscopies, we briefly recall how the corresponding parameters are computationally obtained. The equilibrium rotational constants were straightforwardly derived from the equilibrium structure. The vibrational corrections to these, the centrifugal-distortion constants, as well as the vibrational frequencies and infrared (IR) intensities, were obtained by second-order vibrational perturbation theory (VPT2; Nielsen 1951; Mills 1972; Isaacson et al. 1981; Amos et al. 1991; Barone 2005; Bloino & Barone 2012) applied to the hybrid force field, which was obtained by replacing the harmonic part of the CCSD(T)/cc-pVTZ anharmonic force field with the best-estimated harmonic frequencies (referred as "Best/CC(VTZ)" in the following; the corresponding force constants are collected in the Supplementary Material6). VPT2 computations were performed using Cfour and the Gaussian (Frisch et al. 2009) suites of programs for quantum chemistry. The best-estimated harmonic frequencies were obtained using a composite scheme which involves extrapolation to the complete basis set (CBS) as well as inclusion of core correlation and diffuse function corrections at the MP2 level, with effects of triple excitations assured by the CCSD(T)/cc-pVTZ contributions. (Interested readers are referred to, for example, Barone et al. (2013) and Puzzarini et al. (2014).) To accurately determine the equilibrium structure of protonated oxirane (and thus to accurately evaluate the equilibrium rotational constants), a composite scheme based on additivity at an energy-gradient level (Heckert et al. 2005; Heckert et al. 2006) was employed as well, with extrapolation to the CBS limit (using the cc-pVTZ and cc-pVQZ sets) and effects of core–valence correlation (using cc-pCVTZ) considered at the CCSD(T) level (the overall level of theory is denoted by CCSD(T)/CBS(T, Q)+CV(CT)). The corresponding geometrical parameters are displayed in Figure 1.
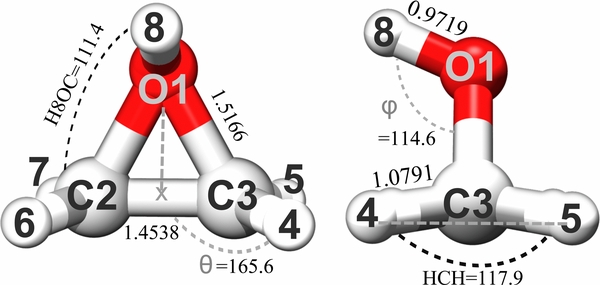
Figure 1. Representation of the molecular structure of protonated oxirane at the CCSD(T)/CBS(T, Q)+CV(CT) level.
Download figure:
Standard image High-resolution imageTable 1. Ground-state Spectroscopic Parametersa of Oxirane and Protonated Oxirane
| Parameter | Oxirane | Protonated Oxirane | ||
|---|---|---|---|---|
| Theoryb | Experimentc | Theoryb | ||
| A | (MHz) | 25528.576 | 25483.86060(96) | 2150.155 |
| B | (MHz) | 22122.424 | 22120.87122(88) | 2035.246 |
| C | (MHz) | 14111.338 | 14097.82440(55) | 1261.903 |
| ΔJ | (kHz) | 20.601 | 20.68572(77) | 28.469 |
| ΔJK | (kHz) | 22.393 | 20.91000(216) | 14.521 |
| ΔK | (kHz) | 26.434 | 27.59143(275) | −15.930 |
| δJ | (kHz) | 6.107 | 6.210757(211) | 10.123 |
| δK | (kHz) | 17.956 | 18.10778(120) | 28.073 |
| ΦJ | (Hz) | −0.0008 | 0.0036 | |
| ΦJK | (Hz) | 0.5805 | 0.61135(302) | −0.0985 |
| ΦKJ | (Hz) | −2.4802 | −2.5999(68) | 0.1544 |
| ΦK | (Hz) | 2.1118 | 2.2142(50) | −0.0545 |
| ϕJ | (Hz) | −0.0011 | −0.001324(179) | 0.0101 |
| ϕJK | (Hz) | 0.2627 | 0.27716(153) | −0.0210 |
| ϕK | (Hz) | −0.2704 | −0.3297(43) | 0.0558 |
Notes. aWatson's A reduction in the Ir representation. bVibration–rotation interaction and quartic and sextic centrifugal-distortion constants computed from the hybrid "Best/CC(VTZ)" force field (see the text). Equilibrium rotational constants corresponding to the best-estimated equilibrium structure (see the text). cExperiment: Medcraft et al. (2012).
Download table as: ASCIITypeset image
Table 2. Best Estimates of the Vibrational Wavenumbers, Wavelengths, and IR Intensities for Oxirane and Protonated Oxirane in the 500–3500 cm−1 Region of the Spectra
| C2H4O | C2H5O+ | ||||||||
|---|---|---|---|---|---|---|---|---|---|
| Assignment | Calculateda | Experimentb | Assignment | Calculateda | |||||
| ν | λ | I c | ν | I c,d | ν | λ | I c | ||
| (cm−1) | (μm) | (km mol−1) | (cm−1) | (km mol−1) | (cm−1) | (μm) | (km mol−1) | ||
| υ13(CH2 a stretch) | 3071.3 | 3.26 | 31.89 | 3066. | 36.24(4.69) | υ1(OH stretch) | 3497.0 | 2.86 | 299.82 |
| υ6(CH2 a stretch) | 3058.2 | 3.27 | 0.00 | . | . | υ2(CH2 a stretch) | 3147.1 | 3.18 | 26.40 |
| υ1(CH2 s stretch) | 3018.1 | 3.31 | 13.77 | 3018.35 | . | υ11(CH2 a stretch) | 3130.7 | 3.19 | 0.33 |
| υ9(CH2 a stretch) | 3009.5 | 3.32 | 29.45 | 3006.5 | 44.31(5.95) | υ3(CH2 s stretch) | 3054.2 | 3.27 | 1.24 |
| 2υ2 | 2943.4 | 3.40 | 0.10e | . | . | υ12(CH2 s stretch) | 3047.2 | 3.28 | 13.65 |
| υ2 + υ10 | 2919.0 | 3.43 | 17.13f | 2930.8 | . | υ4+υ13 | 2898.4 | 3.45 | 0.81 |
| 2υ10 | 2914.3 | 3.43 | 0.90 | . | . | υ13+υ14 | 2641.1 | 3.79 | 0.86 |
| υ10 + υ11 | 2611.5 | 3.83 | 0.20 | . | . | υ13+υ15 | 2630.9 | 3.80 | 0.60 |
| υ2 + υ4 | 2596.1 | 3.85 | 0.39 | . | . | υ4+υ5 | 2465.8 | 4.06 | 0.66 |
| υ10 + υ5 | 2330.5 | 4.29 | 0.13 | . | . | υ5+υ6 | 2462.1 | 4.06 | 0.62 |
| 2υ11 | 2300.1 | 4.35 | 0.27 | . | . | 2υ6 | 2379.6 | 4.20 | 0.63 |
| υ7 + υ14 | 2298.3 | 4.35 | 0.17 | . | . | υ7+υ14 | 2315.8 | 4.32 | 0.63 |
| υ2 + υ12 | 2286.7 | 4.37 | 0.35 | . | . | υ7+υ15 | 2301.5 | 4.35 | 0.93 |
| υ11 + υ4 | 2257.3 | 4.43 | 1.02 | . | . | υ14+υ16 | 2260.0 | 4.42 | 0.54 |
| υ11 + υ8 | 2168.2 | 4.61 | 0.06 | . | . | υ4+υ9 | 2249.4 | 4.45 | 0.66 |
| υ14 + υ8 | 2154.7 | 4.64 | 0.05 | . | . | υ6+υ8 | 2174.1 | 4.60 | 2.50 |
| υ3 + υ5 | 2122.9 | 4.71 | 0.37 | . | . | υ15+υ17 | 2040.6 | 4.90 | 0.78 |
| υ3 + υ12 | 2065.9 | 4.84 | 0.44 | . | . | 2υ8 | 1983.3 | 5.04 | 1.96 |
| υ11 + υ5 | 2016.7 | 4.96 | 0.91 | . | . | υ6+υ10 | 1942.4 | 5.15 | 0.73 |
| υ14 + υ5 | 2007.0 | 4.98 | 0.10 | . | . | υ16+υ17 | 1912.2 | 5.23 | 1.78 |
| υ11 + υ12 | 1956.7 | 5.11 | 0.18 | . | . | 2υ17 | 1708.7 | 5.85 | 2.95 |
| υ14 + υ15 | 1949.2 | 5.13 | 0.07 | . | . | υ9+υ10 | 1546.3 | 6.47 | 1.53 |
| υ4 + υ15 | 1924.0 | 5.20 | 0.39 | . | . | 2υ10 | 1511.8 | 6.61 | 0.86 |
| υ8 + υ15 | 1826.5 | 5.48 | 0.14 | . | . | υ4(CH2 scissor) | 1474.8 | 6.78 | 2.30 |
| 2υ5 | 1736.4 | 5.76 | 0.29 | . | . | υ13(CH2 scissor) | 1448.1 | 6.91 | 16.68 |
| 2υ12 | 1613.0 | 6.20 | 1.79 | . | . | υ10+υ18 | 1337.7 | 7.48 | 0.61 |
| υ2(CH2 scissor) | 1486.6 | 6.73 | 1.16 | 1497.83 | 0.92(0.06) | υ5(ring breath) | 1272.0 | 7.86 | 35.19 |
| υ10(CH2 scissor) | 1461.8 | 6.84 | 0.30 | 1471.35 | 0.25(0.06) | υ6 (OH bend) | 1203.2 | 8.31 | 40.13 |
| υ3(ring breath) | 1264.5 | 7.91 | 13.82 | 1270.37 | 13.16(0.45) | υ14(CH2 rock) | 1197.5 | 8.35 | 3.25 |
| υ7(CH2 rock) | 1156.5 | 8.65 | 0.00 | . | . | υ15(CH2 twist) | 1184.7 | 8.44 | 5.48 |
| υ11(CH2 wag) | 1150.5 | 8.69 | 0.23 | . | . | 2υ18(CH2 rock) | 1169.8 | 8.55 | 0.22 |
| υ14(CH2 twist) | 1141.3 | 8.76 | 4.20 | . | . | υ7(CH2 wag) | 1121.5 | 8.92 | 0.39 |
| υ4(CH2 wag) | 1115.1 | 8.97 | 0.36 | . | . | υ16(OH+CH2 bend) | 1065.0 | 9.39 | 26.42 |
| υ8(CH2 twist) | 1019.3 | 9.81 | 0.00 | . | . | υ8(OH+CH2 bend) | 993.1 | 10.07 | 34.12 |
| υ5(ring deform) | 869.4 | 11.50 | 72.71 | 876.72 | 64.76(3.6)g | υ17(OH+CH2 bend) | 856.2 | 11.68 | 74.45 |
| υ12(ring deform) | 809.1 | 12.36 | 8.56 | 822.27 | 8.56(0.80) | υ9(CH2 rock) | 784.2 | 12.75 | 52.34 |
| υ15(CH2 rock) | 806.5 | 12.40 | 0.45 | 808.13 | 0.21(0.21) | υ10(ring deform) | 756.6 | 13.22 | 244.85 |
| . | . | . | . | . | υ18(ring deform) | 590.3 | 16.94 | 78.17 | |
Notes. All fundamental transitions, overtones, and combination bands (up to two quanta) with intensities greater than 0.05 km mol−1 for oxirane and greater than 0.5 km mol−1 for protonated oxirane are reported. aBest-estimated "Best/CC(VTZ)" vibrational wavenumbers and IR intensities (see the text). bLafferty et al. (2013); Flaud et al. (2012); Kwabia et al. (2013); Russell and Wesendrup (2003); Nakanaga (1981); Kwabia et al. (2014). Further details can be found in Puzzarini et al. (2014). cThe conversion factor to cm molecule−1 is cf = 6.023 × 10¹⁸ (i.e., values in km mol−1 should be divided by cf to obtain the corresponding values in cm molecule−1). dNumbers given in parentheses are the experimental errors. eInvolved in the Fermi-II interaction with υ1; total intensity ascribed to υ1 can be possibly distributed over these two transitions. fInvolved in the Fermi interaction with υ9. gTotal intensity in the spectral region 750–950 cm−1 corresponding to υ5, υ12, and υ15 fundamental transitions.
Download table as: ASCIITypeset image
While most of the computational results for the parent species oxirane are taken from Puzzarini et al. (2014), for a complete account of the computational techniques and approaches employed, we also refer interested readers to Puzzarini et al. (2008), Puzzarini et al. (2010a), Puzzarini et al. (2010b), Barone et al. (2013), and Barone et al. (2014).
3. RESULTS
The first issue to be addressed in the identification of protonated oxirane by means of molecular spectroscopy is the possibility of distinguishing its spectrum from that of oxirane. This is rather straightforward in the case of rotational spectroscopy, and therefore the recent investigation of oxirane (Puzzarini et al. 2014) is used to assess the accuracy of the present spectroscopic characterization. Less straightforward is the situation regarding IR spectroscopy. Therefore, a detailed comparison of the IR spectra of oxirane and protonated oxirane is carried out in order to point out which features would permit an unambiguous identification.
3.1. Rotational Spectroscopy
The vibrational ground-state rotational and centrifugal-distortion constants of oxirane and protonated oxirane computed at the same level of theory are collected in Table 1, where the rotational parameters of the former are compared with the available experimental data. Watson's A reduction in Ir representation (Watson 1977) is considered. For the main isotopic species, good agreement between our computed values and experiment is evident, with average discrepancies on the order ∼0.1%, 2%–3%, and ∼5% for rotational and quartic and sextic centrifugal-distortion constants, respectively. We therefore consider that similar relative uncertainties affect the spectroscopic parameters of protonated oxirane. More interesting in view of astronomical detections is addressing the accuracy of the corresponding predicted rotational transitions. While the complete set of predictions for protonated oxirane can be retrieved from the parameters of Table 1 (they are otherwise available from the authors upon request), Figure 2 shows the portion of the rotational spectrum of oxirane and protonated oxirane in the 220–260 GHz frequency range. For the former molecule, the comparison with the actually observed transitions is provided. This comparison allows us to point out that calculated frequencies are overestimated in relative terms by about 0.1%. In particular, the comparison for the J = 55, 0 ← 44, 1 transition, for which the largest discrepancy is observed, is highlighted in the inset. The same accuracy is expected for the protonated species. We furthermore note that the spectrum of protonated oxirane is more crowded and less intense than that of oxirane. The reduced intensity is due to the smaller component of the dipole moment component of the protonated species along the b inertial axis (1.57 D versus 1.91 D), while the increased number of transitions is related to the small dipole moment component along the c-axis (∼0.48 D) due to the H+, which is lying out of the molecular plane. From Figure 2, it is clear that, as expected from the rotational parameters given in Table 1, the rotational spectra of the two molecules are well distinguishable.

Figure 2. Comparison of calculated (red, solid line) and experimental (black, solid line) rotational spectra of oxirane in the 220–260 GHz frequency range. The most intense calculated rotational transitions with J < 10 of protonated oxirane are also shown (blue, dashed line).
Download figure:
Standard image High-resolution image3.2. Vibrational Spectroscopy
As mentioned above, the IR spectrum of protonated oxirane was computed using VPT2 in conjunction with the hybrid "Best/CC(VTZ)" force field. This level of theory was chosen because of its cost effectiveness and because it was proven to provide results with an accuracy comparable to that obtainable from an anharmonic force field at the CCSD(T) level in conjunction with a large basis set, which also accounts for core correlation effects (see, for example, Barone et al. 2013; Puzzarini et al. 2014).
Predictions of the most intense transitions of protonated oxirane, also including overtones and combination bands up to two quanta, are reported in Table 2. Based on these results and those for oxirane computed at the same level of theory, the comparison of the IR spectra of protonated oxirane and oxirane has been carried out. This is exemplified by Figure 3, which shows the 1.5–3.5 μm and 7–17 μm regions. We note that the most intense band of protonated oxirane is the O–H stretching lying at 2.9 μm, which is very intense (∼300 km mol−1) and, of course, does not have any counterpart in the oxirane spectrum. In the left panel of Figure 3, the insets make it evident that the protonated oxirane and oxirane IR spectra are rather different; in particular, the former species shows fewer features in the 3.2 μm region but a more crowded spectrum in the 2.1–2.7 μm range with respect to oxirane. Moving to the right panel of Figure 3, we note characteristic bands at 9.4, 10.1, 13.2, and 16.9 μm, which are well shifted with respect to the oxirane features. While the first two bands are characteristic of protonated oxirane being described in terms of the coupling between the CH2 and O–H bending modes, the last two bands correspond to ring deformation modes that are also present in oxirane. The overall conclusion drawn by Figure 3 is that protonated oxirane and oxirane can be easily distinguished on the basis of their IR spectra.

Figure 3. Comparison of the calculated IR spectra of oxirane (red, dotted line) and protonated oxirane (blue, solid line) in the 1.5–3.5 and 7–17 μm ranges. The less intense transitions are made more evident in the insets.
Download figure:
Standard image High-resolution image
Table 2 allows us to point out the accuracy of the predicted vibrational frequencies of protonated oxirane. By comparing to experiment, for oxirane the mean absolute error (MAE) is 6.4 cm−1, with a maximum error (MAX) of 13.2 cm−1. Due to the limited number of experimental data available (see Table 2), it is worthwhile noting the very good agreement with the highly accurate results (best-estimated force field obtained exclusively employing CCSD(T) calculations) reported in Puzzarini et al. (2014): MAE = 3.7 cm−1, MAX = 7.9 cm−1. A similar accuracy is expected for protonated oxirane, which turns out to be sufficiently good for guiding astronomical detections.
4. CONCLUDING REMARKS
To the best of our knowledge, the present study provides the first spectroscopic characterization of the IR and rotational spectra of protonated oxirane. In view of the well documented accuracy of the computational methods and approaches employed, we are confident that spectroscopic parameters herein provided are suitable for guiding future experimental investigations, either in the laboratory or in space.
This work was supported by the Italian MIUR (PRIN 2012 "STAR: Spectroscopic and computational Techniques for Astrophysical and atmospheric Research" and PON01-01078/8) and by the University of Bologna (RFO funds). This work was also supported in part at the NASA Goddard Space Flight Center by the Cassini Plasma Spectrometer (CAPS) Project through NASA Jet Propulsion Laboratory contract 1243218 with the Southwest Research Institute in San Antonio, TX. The high performance computer facilities of the DREAMS center (http://dreamshpc.sns.it) are acknowledged for providing computer resources. The support of COST CMTS-Action CM1002 "COnvergent Distributed Environment for Computational Spectroscopy (CODECS)" is also acknowledged. The research leading to these results has received funding from the European Union's Seventh Framework Programme (FP7/2007-2013) under grant agreement No ERC-2012-AdG-320951-DREAMS.
Footnotes
- 5
CFour, a quantum chemical program package written by J. F. Stanton, Gauss, J., Harding, M. E., Szalay, P. G. with contributions from Auer, A. A., Bartlett, R. J., Benedikt, U., et al. and the integral packages MOLECULE (Almlöf, J., & Taylor, P. R.), PROPS (Taylor, P. R.), ABACUS (Helgaker, T., Jensen, H. J. Aa., Jørgensen, P., & Olsen, J.), and ECP routines by Mitin, A. V., & van Wüllen, C. For the current version, see http://www.cfour.de.
- 6