


ABSTRACT
We have measured dielectronic recombination (DR) for Fe12 + forming Fe11 + using the heavy ion storage ring TSR located at the Max Planck Institute for Nuclear Physics in Heidelberg, Germany. Using our results, we have calculated a plasma rate coefficient from these data that can be used for modeling astrophysical and laboratory plasmas. For the low temperatures characteristic of photoionized plasmas, the experimentally derived rate coefficient is orders of magnitude larger than the previously recommended atomic data. The existing atomic data were also about 40% smaller than our measurements at temperatures relevant for collisionally ionized plasmas. Recent state-of-the-art theory has difficulty reproducing the detailed energy dependence of the DR spectrum. However, for the Maxwellian plasma rate coefficient, recent theoretical results agree with our measurements to within about 30% for both photoionized and collisionally ionized plasmas.
Export citation and abstract BibTeX RIS
1. INTRODUCTION
Astrophysical plasmas can be divided into two broad classes, electron ionized and photoionized. Electron-ionized plasmas form, for example, in stars, supernova remnants, galaxies, and the intracluster medium in clusters of galaxies. Photoionized plasmas can form in sources such as planetary nebulae, X-ray binaries, and active galactic nuclei (AGNs). Interpreting observations and modeling astrophysical processes of these plasmas requires knowing the underlying ion charge state distribution (CSD) of the gas. The CSD is determined by the competition between ionization and recombination. Electron impact ionization processes and recent experimental studies are reviewed in Müller (2008) and Hahn (2014). Photoionization has been reviewed in Kallman & Palmeri (2007). For both classes of sources, the dominant recombination process for most ions is dielectronic recombination (DR). Therefore, accurate DR rate coefficients are needed to reliably calculate the CSD of astrophysical plasmas (e.g., Bryans et al. 2006). Recent reviews of experimental DR measurements have been given by Schippers (2009) and Schippers et al. (2010).
A particular example illustrating the importance of accurate DR data is the unresolved transition array (UTA) absorption feature at 15–17 Å seen in AGNs (Sako et al. 2001). This feature is caused by 2p–3d photoabsorption by iron ions with a partially filled M shell. Behar et al. (2001) have shown that the UTA can be used to diagnose properties of the AGN. However, attempts to model the absorption features could not accurately reproduce the observed UTAs. The problem has been attributed to underestimated DR rate coefficients for iron M-shell ions that are used by the CSD models (Netzer et al. 2003; Kraemer et al. 2004; Netzer 2004). This hypothesis is supported by recent theoretical and experimental DR studies of iron M-shell ions (Badnell 2006; Schmidt et al. 2006, 2008; Lukić et al. 2007; Lestinsky et al. 2009; Müller & Schippers 2012). Recent modeling studies by Chakravorty et al. (2008) and Kallman (2010) have investigated some of the astrophysical implications of these new atomic data. Here we present additional Fe M-shell DR studies, specifically for the ion Fe12 +.
DR is a two step process in which a free electron approaches an ion, excites a bound electron, and is simultaneously captured. The resulting doubly excited state can relax by emitting a photon or by autoionizing. Recombination occurs when the intermediate state relaxes radiatively to below the ionization threshold of the recombined system. By conservation of energy, DR occurs at E = ΔE − Eb, where E is the energy of the incident electron, ΔE is the electronic core excitation energy of the recombined ion, and Eb ≈ 13.6Z2/n2 eV is the bound-state energy of the captured electron in a Rydberg level with principal quantum number n of the ion with initial charge Z. DR is a resonant process because both ΔE and Eb are quantized. Here we label the core electron transition  , where N is the principal quantum number of the core electron, l is the orbital angular momentum, and j is the total angular momentum.
We have measured DR for Si-like Fe12 + forming P-like Fe11 + over the collision energy range of 0–1800 eV. Between 0 and ≈70 eV, we expect the DR spectrum to be dominated by resonances from ΔN ≡ N' − N = 0 excitations, such as
The core excitation energies for ΔN = 0 excitations are given in Table 1.
Table 1. Energy Levels of Fe12 + Relative to the 3s23p2 [3P0] Ground Level for Excitations with ΔN = 0 (Kramida et al. 2013)
| Level | Energy |
|---|---|
| (eV) | |
| 3s23p2 [3P1] | 1.1534 |
| 3s23p2 [3P2] | 2.30127 |
| 3s23p2 [1D2] | 5.9597 |
| 3s23p2 [1S0] | 11.346 |
| 3s3p3 [5S2] | 26.6080 |
| 3s3p3 [3D1] | 35.6089 |
| 3s3p3 [3D2] | 35.6281 |
| 3s3p3 [3D3] | 35.9815 |
| 3s3p3 [3P1] | 40.8710 |
| 3s3p3 [3P2] | 40.9494 |
| 3s3p3 [1D2] | 44.9232 |
| 3s3p3 [3S1] | 51.5107 |
| 3s3p3 [1P1] | 54.3113 |
| 3s23p 3d[3P2] | 60.3007 |
| 3s23p 3d[3P1] | 61.3650 |
| 3s23p 3d[1D2] | 61.8520 |
| 3s23p 3d[3P0] | 62.4062 |
| 3s23p 3d[3D1] | 62.7982 |
| 3s23p 3d[3D3] | 63.1298 |
| 3s23p 3d[3D2] | 63.1389 |
| 3s23p 3d[1F3] | 69.0431 |
| 3s23p 3d[1P1] | 70.7565 |
Download table as: ASCIITypeset image
The experimental energy range from 70 to 1800 eV covers DR via ΔN ⩾ 1 core excitations due to both 3–N' and 2–N' transitions. Level energies for some 3–4 transitions are given by Vilkas & Ishikawa (2004) and Del Zanna & Storey (2012). Energies for some 2–3 transitions are reported by Gu et al. (2006). However, we are unaware of published energies for ΔN > 1 transitions.
2. EXPERIMENTAL SETUP AND ANALYSIS
The experiment was performed with the TSR heavy-ion storage ring at the Max-Planck-Institut für Kernphysik in Heidelberg, Germany. The procedures for DR measurements at TSR have already been described in detail elsewhere (e.g., Kilgus et al. 1992; Lampert et al. 1996; Schippers et al. 2001; Lestinsky et al. 2009; Novotný et al. 2012). Additionally, many of the details of a recent study of electron impact ionization of Fe12 +, reported in Hahn et al. (2011), are also relevant for this work. Here we provide only a brief outline of the experiment.
We injected a beam of 148 MeV 56Fe12 + ions into the TSR where it was merged with two separate electron beams, called the Cooler (Steck et al. 1990) and the Target (Sprenger et al. 2004). In the merged beams sections, electrons and ions collide at the collision energy E according to their relative motion. The variation of the DR rate as a function of E is measured and yields the DR spectrum. Each electron beam has a nearly mono-energetic electron energy distribution, which can be described as a flattened Maxwellian. The resulting experimental energy spread at a collision energy of E is then mainly determined by the parallel and perpendicular electron beam temperatures and can be approximated as δE = {[ln (2)kBT⊥]2 + [16ln (2)EkBT∥]}1/2. By fitting the low-energy data as described in Section 3, we inferred temperatures of  meV, and
  μeV for the Cooler and
  meV and
  μeV for the Target. Due to the complexity of the Fe12 + DR spectrum, this system is not ideal for estimating the electron beam temperatures, but the values given are in line with those found in other TSR DR measurements.
During injection and for an additional 8 s after, both electron beams were set to the cooling energy, at which the average relative velocity between the electrons and ions is zero, corresponding to E = 0. At this energy, cooling of the ion beam occurs through collisions between the single-pass electrons and the recirculating ions. Also, during this initial cooling cycle, essentially all the metastable levels in the ion beam radiatively relaxed to the ground state so that the metastable ion population during data collection was negligible (Hahn et al. 2011).
Measurements were performed by scanning either the Cooler or Target electron beam energy while the other electron beam was maintained at the cooling energy. The recombined ions were magnetically separated from the Fe12 + beam and directed onto one of two possible particle counting detectors (Rinn et al. 1982; Lestinsky 2007). For collision energies below about 1.8 eV, measurements were performed using the Target as the variable energy probe to make use of its higher-energy resolution. The experimental energy spread δE grows essentially as  , so that at higher energies the resolution of the Cooler and Target become comparable. Thus, for energies above 1.8 eV, measurements were performed with the Cooler because its electron beam was denser and thereby permitted better statistical accuracy.
The energy scans consisted of several hundred pairs of steps with one step at a variable measurement energy and the other at a fixed reference energy. The reference step was used to determine the background count rate due to electron capture off the residual gas. Scan ranges were chosen to overlap by at least 50% in order to correct for any run-to-run fluctuations and to improve statistical accuracy.
The experiment measures the recombination cross section σ times the relative velocity vrel convolved with the energy spread of the experiment yielding <σvrel >, which we refer to as the merged beams recombination rate coefficient (MBRRC). It is obtained from the data by normalizing the background-subtracted count rates by the electron density and the number of ions in the interaction region. We stitched together the data from the different measured energy ranges to determine the MBRRC from 0 to 1800 eV. Finally, these data were corrected for toroidal effects due to the merging and demerging sections on either side of the interaction region using the method described by Lampert et al. (1996).
The total measured electron-ion recombination signal includes radiative recombination (RR) in addition to DR. We estimated the non-resonant background RR signal using a hydrogenic approximation (Schippers et al. 2001) and subtracted it from our data. The error on the DR measurement incurred from using the hydrogenic approximation is expected to be negligible since RR contributes, on average, only about 3% of the total electron–ion recombination signal.
Uncertainties from counting statistics average to about 3% for E ≲ 70 eV and about 17% for recombination at higher energies. Here and throughout the paper, uncertainties are quoted at an estimated 1σ statistical accuracy. The energy dependence of the uncertainty level is mainly due to the large DR rate coefficient for ΔN = 0 resonances which dominate the energy range below about 70 eV, while above 70 eV the DR rate coefficient is relatively small. There are systematic uncertainties of about 3% each from the counting efficiency (Rinn et al. 1982; Lestinsky 2007) and electron density (Lestinsky et al. 2009). The ion current measurement and calibration was performed as is described in Hahn et al. (2011) and the uncertainty was estimated to be about 4%. All these sources of uncertainty are summarized in Table 2.
Table 2. Major Sources of Uncertainty
| Source | Estimated 1σ Uncertainty |
|---|---|
| Counting statisticsa | 3%–17% |
| Ion current measurement | 4% |
| Electron density | 3% |
| Detection efficiency | 3% |
| Quadrature sum | 7%–18% |
Note. aThe average of 3% is for E < 70 eV (ΔN = 0 DR) and of 17% for E > 70 eV (ΔN ⩾ 1 DR).
Download table as: ASCIITypeset image
3. RESULTS AND DISCUSSION
3.1. MBRRC
Figure 1 compares the experimental DR MBRRC (filled circles) to the AUTOSTRUCTURE calculations of Badnell (2006) for E < 70 eV. These state-of-the-art theoretical calculations included all low-energy excitations in the model. The theoretical cross section has been multiplied by vrel and convolved with the energy spread of the experiment. The calculation includes DR contributions from capture into Rydberg states up to n = 1000 and is shown by the dotted line in the figure. However, in the experiment, the ions experience motional electric fields as they pass through the TSR magnets. These fields ionize high-n Rydberg levels (Schippers et al. 2001). Here, field ionization was possible for levels with n ≳ 46. In order to compare the experimental MBRRC to theory, we modified the theoretical results to include the effects of field ionization in the experiment following the procedure of Schippers et al. (2001). The solid line in Figure 1 shows the theoretical MBRRC after accounting for field ionization.
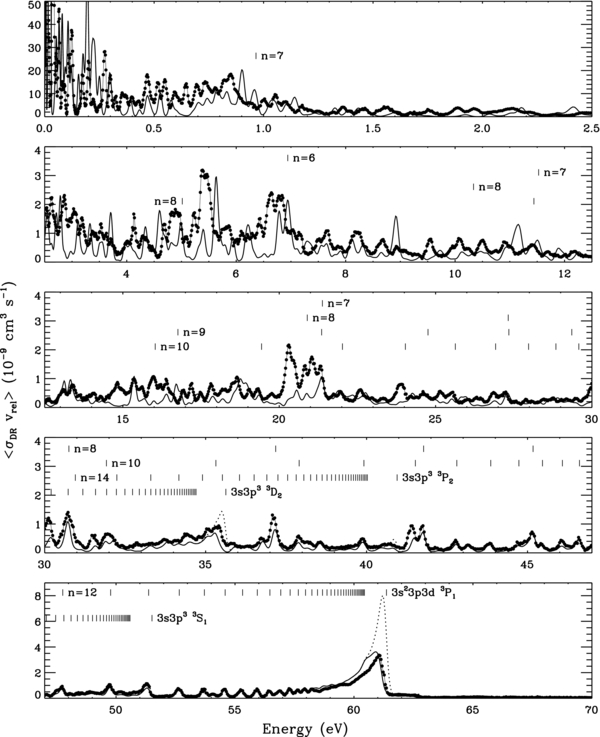
Figure 1. Experimental DR MBRRC as a function of relative energy (connected filled circles). These data are compared to AUTOSTRUCTURE calculations modified to model field ionization in the experiment (solid line) as well as the unmodified calculations (dotted line). Vertical lines illustrate selected Rydberg series and the series limits label the corresponding core excitation. The series are illustrated for n ⩽ 46, the semiclassical field ionization cutoff, with a final line to indicate the series limits at E = ΔE.
Download figure:
Standard image High-resolution imageThe MBRRC shows a dense spectrum of resonances dominated by ΔN = 0 core excitations. Some of the expected resonance positions, based on the core excitation energies of Kramida et al. (2013), are illustrated by vertical lines in the figure. For lower energies, below ∼1 eV, it is difficult to assign resonances to individual peaks. The clearest structures in the MBRRC are the series arising from 3s23p3d 3P0, 1, 2 core excitations at about 61 eV. The resonances associated with these excitations are resolved for n up to about 25.
The agreement between theory and experiment is not particularly good below about 40 eV, but they match fairly well near the series limit at 61 eV. One way to quantitatively compare the experimental and DR rate coefficients is by comparing the integrated DR rate coefficients for different energy ranges. We did this using the ratio of the integrated theory to experimental MBRRC:
where the theoretical MBRRC used here includes the field ionization model so that it can be directly related to the experiment. The results for selected energy ranges are presented in Table 3. Below about 2.5 eV, the integrated rates are in surprisingly good agreement, despite the fact that theory does a poor job of reproducing the measured DR structure. For the energy range from 2.5 eV to about 47 eV we find κ ∼ 0.6. The details of the resonances are not well reproduced in this energy range, but the agreement improves with increasing energy, especially above about 30 eV. Finally, from 47 to 70 eV there is good agreement in terms of both κ and the detailed structure.
Table 3. Integrated DR Rate Coefficients
| Energy Range | ∫ < σDRvrel > expdE | ∫ < σDRvrel > theorydE |  |
|---|---|---|---|
| (eV) | (cm3 s−1 eV) | ||
| 0.002–0.14 | 4.91 × 10⁻⁹ | 4.63 × 10⁻⁹ | 0.94 |
| 0.14–2.5 | 1.16 × 10⁻⁸ | 9.17 × 10⁻⁹ | 0.79 |
| 2.5–12.5 | 7.79 × 10⁻⁹ | 5.06 × 10⁻⁹ | 0.65 |
| 12.5–30.0 | 8.48 × 10⁻⁹ | 5.07 × 10⁻⁹ | 0.60 |
| 30.0–47.0 | 6.14 × 10⁻⁹ | 3.83 × 10⁻⁹ | 0.62 |
| 47.0–70.0 | 9.96 × 10⁻⁹ | 9.64 × 10⁻⁹ | 0.97 |
| 70.0–272.0 | 6.51 × 10⁻⁹ | 2.53 × 10⁻⁹ | 0.39 |
Note. The theoretical data used in this comparison accounts for field ionization.
Download table as: ASCIITypeset image
Figure 2 shows the DR MBRRC for collision energies E > 70 eV. Our results are similar to what was found by Novotný et al. (2012) in the corresponding energy range for Fe11 +. As was seen earlier, we find that the MBRRC for E > 70 eV is much smaller than for lower energies. Most individual resonances are not resolved in this range, except possibly for some resonances at ≈200 eV due to the 3s23p4d configuration. The threshold for ionization of N = 3 electrons is 361.0 eV, and the DR below this limit is dominated by core excitations of the N = 3 electrons with ΔN ⩾ 1. The energies of the series limits for 3–N' core excitations were estimated using a hydrogenic approximation and are also indicated in the figure. AUTOSTRUCTURE calculations were performed to model the MBRRC due to 3–4 transitions. These are possible up to about 272 eV. The theoretical MBRRC is illustrated by the solid curve in Figure 2. Based on these calculations, we find that κ = 0.39 in the range 70–272 eV. The DR MBRRC drops to a very low value at the ionization threshold of 361 eV.

Figure 2. Experimental DR MBRRC vs. energy (connected filled circles) for E = 70–1800 eV. Below the ionization threshold at 361.0 eV, DR is mainly due to unresolved ΔN = 1 core excitations. The expected energies for some Rydberg series are indicated by the vertical lines. The series limits for 3–N' and 2–N' core excitations were estimated using a hydrogenic approximation. The Fe12 + ionization threshold corresponds to the 3–N' series limit. DR above this ionization threshold is believed to be due to excitation of an inner-shell electron. The 1σ statistical uncertainties are illustrated by error bars on selected points. The solid line shows the AUTOSTRUCTURE DR calculations for 3–4 core excitations.
Download figure:
Standard image High-resolution imageAbove the ionization threshold, the MBRRC is generally much smaller. Between the Fe12 + ionization limit and the 2–3 series limit at about ∼850 eV there are some clear peaks that are most likely from 2–3 core excitations. A clear drop in the MBRRC is seen near the 2–3 series limit. DR arising from 2–N' core transitions is possible up to the ionization energy from the N = 2 level, which is about 1110 eV (Kaastra & Mewe 1993). Based on a hydrogenic approximation, we estimated the series limits for the various 2–N' core excitations, which are also indicated in Figure 2.
3.2. Plasma Rate Coefficient
We have derived a Maxwellian DR rate coefficient αDR(T) from the experimental results. In order to do this, the DR cross section σDR must be extracted from the experimentally measured <σDRvrel >. Then αDR(T) can be found by multiplying σDR by the relative velocity and integrating over a Maxwellian (e.g., Schippers et al. 2004). The procedure followed here is similar to that of Schmidt et al. (2008) and Lestinsky et al. (2009), which give additional details.
For low relative energies, E < 0.135 eV, we deconvolved <σDRvrel > by constructing a model σDR(E) represented by a sum of δ-function DR resonances  characterized by their centroid positions
  and resonance strengths
  (Schippers et al. 2004). This cross section was then analytically convolved with the experimental energy distribution characterized by T⊥ and T∥ to obtain a model <σDRvrel >. The model used 21 resonances with
 , T⊥, and T∥ as free parameters. The best-fit spectrum is shown in Figure 3. The temperatures quoted in Section 2 were derived from this fit, but note that the derived PRRC is insensitive to the values of T⊥ and T∥ since it depends only on σDR.
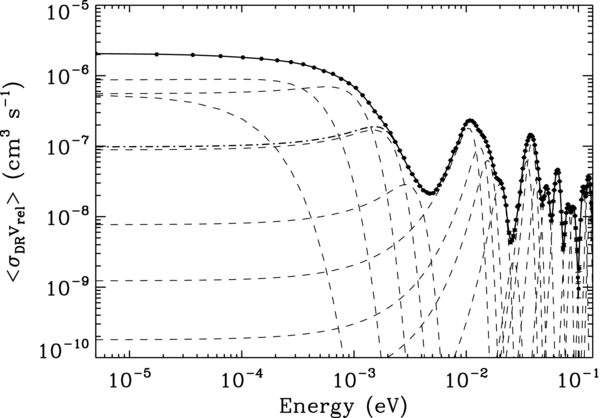
Figure 3. Fit to the experimental DR MBRRC for E < 0.135 eV. The filled circles are the data points. The solid line shows the total fit and the dashed lines the contributions of individual resonances. The dot-dashed line illustrates the result of excluding resonances below 2 meV.
Download figure:
Standard image High-resolution imageThe low-energy DR data for E ≲ kBT⊥ suffers from a known systematic effect related to enhancement of the recombination rate due to motional electric fields in the interaction region (Gwinner et al. 2000; Hörndl et al. 2006). This enhancement does not contribute to recombination in field free regions and therefore should not be included in the plasma rate coefficient. However, it is likely that unresolved DR resonances are present for E < kBT⊥. To accommodate either possibility, we estimated the upper and lower bounds,  and
and  , for the plasma rate coefficient. For the upper bound all 21 resonances in the fit were kept. The lower bound was found by omitting all resonances with Eres < kBT⊥ ≈ 2 meV. The corresponding MBRRC is shown by the dash-dotted line in Figure 3. This fit is about a factor of 20 smaller than the total measured MBRRC. Typical enhancement factors for measurements with the Cooler electron beam are about 1.5–3 (Wolf & Gwinner 2003) and we expect the Target should have similar values. Thus, the much larger factor found here strongly suggests that much of the very low-energy recombination is from unresolved DR resonances and the lower bound is likely to significantly underestimate the DR rate coefficient. We took the final value for αDR(T) to be the average value
 ![$[\alpha _{\mathrm{DR}}^{\mathrm{hi}}(T) + \alpha _{\mathrm{DR}}^{\mathrm{lo}}(T)]/2$](https://content.cld.iop.org/journals/0004-637X/788/1/46/revision1/apj494923ieqn15.gif) and used the bounds to estimate the possible systematic error from the field enhancement affect. The resulting uncertainty decreases with temperature, being 9% at 103 K and dropping to 1% by 104 K and negligible at high temperatures.
and used the bounds to estimate the possible systematic error from the field enhancement affect. The resulting uncertainty decreases with temperature, being 9% at 103 K and dropping to 1% by 104 K and negligible at high temperatures.
For E > 0.135 eV the experimental energy spread was much smaller than the collision energy, so we used the approximation σDR = <σDRvrel > /vrel for the cross section. In this energy range, it was also necessary to correct for field ionization in the experiment. This was done using the theoretical calculations as a guide. We took the ratio of the total theoretical DR MBRRC to the theory with the field ionization model included. This ratio then gives a correction factor as a function of the collision energy that describes the relative increase in <σDRvrel > in the absence of field ionization. The ratio is equal to 1 over most of the energy range, except near the series limits, particularly the 3s23p3d 3P0, 1, 2 series limit at 61 eV (see Figure 1). The experimental MBRRC was multiplied by the correction factor to estimate the MBRRC that we would have measured in the absence of fields. The correction increases the final αDR(T) compared to not applying the correction. The difference is about 12% for T > 106 K but negligible below about 105 K.
An alternative method for estimating the field ionization contribution, which has been used in previous studies (e.g., Lestinsky et al. 2009), is to replace the energy ranges affected by field ionization in the experiment with theoretical data that was scaled to match experiment in energy ranges not affected by field ionization. For Fe12 + this replacement method seems undesirable due to the clear differences in the resonance structure between the theory and experiment. However, we did use this alternative method to estimate the systematic error from the field ionization correction. The replacement method αDR(T) is smaller by about 5% compared to the ratio method. Thus, the systematic uncertainty on the plasma rate coefficient due to field ionization is estimated to be about 5% for T ≳ 106 K.
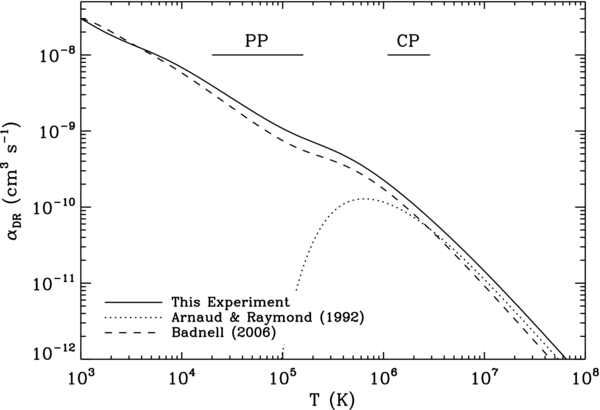
Figure 4 shows the resulting DR plasma rate coefficient. Taking the uncertainties from the 1σ systematic error in the experiment, from field ionization and from the low-energy enhancement, and assuming that the random statistical errors integrate away, we estimate the total 1σ uncertainty of αDR(T) to be about 8% for T ≳ 104 K. The uncertainty grows to about 12% at 103 K, due to the possible contribution of unresolved resonances discussed earlier. In Section 2, it was mentioned that this result uses measurements with the Target electron beam for E < 1.8 eV. As a check on the systematic uncertainty, we also derived the plasma rate coefficient using Cooler data for this energy range and found that the two results agree to better than 3%.
Figure 4. Plasma rate coefficient derived from our experimental data (solid line). Shown for comparison are the rate coefficients given by Arnaud & Raymond (1992; dotted line) and Badnell (2006; dashed line), these last of which have been modified to include DR arising from 3–4 core excitations (see Section 3.1 and Figure 2). The horizontal lines show the temperature range where Fe12 + is greater than 1% abundant in photoionized plasmas (PP; Kallman et al. 2004) and in electron-ionized collisional plasmas (CP; Bryans et al. 2009). The uncertainty of the experimental rate coefficient is estimated to be about 8% for T ≳ 104 K.
Download figure:
Standard image High-resolution image
Figure 4 also compares the experimental αDR(T) to the recommended DR rate coefficient of Arnaud & Raymond (1992). In addition, we compare it to the theoretical rate coefficient of Badnell (2006), modified to include the new AUTOSTRUCTURE calculations for the 3–4 transitions discussed in Section 3.1. The most relevant temperature ranges for comparison are those where Fe12 + is abundant in ionization equilibrium. For photoionized plasmas Fe12 + is greater than 1% abundant over the temperature range 2.0 × 10⁴–1.6 × 10⁵ K (Kallman et al. 2004). The equivalent temperature range for electron-ionized plasmas is 1.1 × 10⁶–1.9 × 10⁶ K (Bryans et al. 2009). These temperature ranges are indicated in Figure 4. As has been seen previously for DR of other M-shell Fe ions, the rate coefficient of Arnaud & Raymond (1992) is orders of magnitude smaller than our experimental result in the temperature range relevant for photoionized plasmas. It is also about 40% smaller than our measurement at temperatures relevant for collisionally ionized plasmas. The modified theoretical rate coefficient of Badnell (2006) is smaller than the experimental value by about 30% for photoionized plasmas and by about 25% for electron-ionized plasmas. This moderate discrepancy is about the same order as found for other systems (Schmidt et al. 2008; Lestinsky et al. 2009).
At high temperatures, one factor that contributes to the discrepancy between theory and experiment is the neglect of ΔN > 1 core excitations in the theoretical calculations. We estimated the contribution of ΔN ⩾ 1 DR to the experimental αDR(T) by setting σDR = 0 for E > 70 eV. We find that ΔN ⩾ 1 DR makes up about 1% of the total rate coefficient at 3 × 10⁵ K, ≈10% at 1 × 10⁶ K, ≈20% at 2 × 10⁶ K, and ≈30% at 1 × 10⁷ K. A similar magnitude effect is seen in the theoretical calculations when higher-energy resonances are included. For example, by including DR arising from 3–4 core excitations to the original theory of Badnell (2006), we find that the rate coefficient is increased by about 15% at 107 K. We expect that including further ΔN > 1 channels would further decrease the discrepancy with experiment at high temperatures.
We have parameterized our experimental DR plasma rate coefficient with a fit that can be used to reproduce our results. The fitting function is
The parameters for the fit are given in Table 4. The fit reproduces the experimental result to better than 1% over the temperature range 102–108 K. Table 5 gives the fitting coefficients for the updated theoretical results, which combine the Badnell (2006) rate coefficient with the new AUTOSTRUCTURE calculations for DR due to 3–4 core excitations.
Table 4. Fitting Parameters for Equation (3) for the Experimental Results
| i | Ei | ci |
|---|---|---|
| (K) | (cm3 s−1 K3/2) | |
| 1 | 8.305 × 101 | 3.872 × 10⁻⁴ |
| 2 | 6.426 × 10² | 9.478 × 10⁻⁴ |
| 3 | 3.492 × 10³ | 3.081 × 10⁻³ |
| 4 | 1.153 × 10⁴ | 1.052 × 10⁻² |
| 5 | 5.755 × 10⁴ | 2.324 × 10⁻² |
| 6 | 2.661 × 10⁵ | 1.409 × 10⁻¹ |
| 7 | 7.968 × 10⁵ | 2.422 × 10⁻¹ |
| 8 | 5.061 × 10⁶ | 1.544 × 10⁻¹ |
Download table as: ASCIITypeset image
Table 5. Fitting Parameters for Equation (3) for the Updated AUTOSTRUCTURE Calculations
| i | Ei | ci |
|---|---|---|
| (K) | (cm3 s−1 K3/2) | |
| 1 | 1.242 × 10³ | 3.266 × 10⁻³ |
| 2 | 1.005 × 10⁴ | 7.710 × 10⁻³ |
| 3 | 4.723 × 10⁴ | 1.119 × 10⁻² |
| 4 | 1.799 × 10⁵ | 3.582 × 10⁻² |
| 5 | 5.826 × 10⁵ | 1.966 × 10⁻¹ |
| 6 | 1.531 × 10⁶ | 5.640 × 10⁻² |
Download table as: ASCIITypeset image
4. SUMMARY
We have measured DR for Si-like Fe12 + forming P-like Fe11 + and compared the results to theoretical calculations. From our measurements, we have derived a Maxwellian rate coefficient suitable for use in plasma modeling. Compared to our measurements, the recommended data of Arnaud & Raymond (1992) seriously underestimate the DR plasma rate coefficient at temperatures relevant for photoionized plasmas, as has also been found by experimental studies of other Fe M-shell systems. For collisionally ionized plasmas, the Arnaud & Raymond (1992) rate coefficient is about 40% smaller than our experimentally derived rate coefficient.
In order to estimate the predictive power of current theory, we have compared our results to the state-of-the-art AUTOSTRUCTURE calculations described by Badnell (2006) with a suitable extension to include 3–4 excitation of the Fe12 + core. In terms of the high-resolution DR spectrum, we find that theory reasonably reproduces the overall magnitude of the rate coefficient when integrated over broad energy ranges, but it does a poor job of reproducing the detailed resonance structure, particularly for relative energies below ≈47 eV. Above ≈70 eV, theory neither reproduces the observed resonance structure nor predicts accurately the integrated rate coefficient. This disagreement is likely due to the neglect of higher core excitation channels in the calculations. For the Maxwellian plasma rate coefficient, our experimental results and these theoretical calculations agree to within about 30% over the temperature ranges relevant for Fe12 + in both photoionized and electron-ionized plasmas. The discrepancies between theory and experiment in the MBRRC for E ≳ 70 eV have a negligible effect for the modeling of photoionized plasmas and an ∼10% effect for collisional plasmas. This is because DR at such high energies contributes very little to the plasma rate coefficient at the relevant formation temperatures. In summary, for complex M-shell ions, theory cannot reproduce the detailed energy dependence of the DR spectrum. However, the comparison with our experimental data shows that state-of-the-art calculations that take into account all low-energy excitations can provide a reasonable prediction for the Maxwellian DR rate coefficient over temperature ranges where the DR is of significant importance for plasma modeling.
We appreciate the efficient support by the MPIK accelerator and TSR groups during the beamtime. M.H., O.N., and D.W.S. were supported in part by the NASA Astrophysics Research and Analysis Program and the NASA Solar and Heliospheric Physics Supporting Research program. We also acknowledge support by the Max Planck Society, Germany and by the Deutsche Forschungsgemeinschaft (contract No. Schi 378/8-1).