


ABSTRACT
We measured the trigonometric parallax of an H2O maser source associated with the massive star-forming region NGC 6334I(North), hereafter as NGC 6334I(N), with the VLBI Exploration of Radio Astrometry. The derived annual parallax is 0.789 ± 0.161 mas, corresponding to a distance of 1.26 kpc. Using the new distance, we recalculated the physical parameters (masses and luminosities) of the dust continuum cores in the region, and the revised parameters are only ∼50% of their originally reported values. We also traced 23 relative proper motions of the H2O masers associated with SMA1 (central millimeter source in the region) between epochs, which exhibit an average amplitude of maser proper motion of ∼2.03 mas yr−1 (∼12.22 km s−1), tracing a bipolar outflow. The bipolar outflow structure extends through ∼600 mas (∼720 AU), with a dynamical timescale of ∼295 yr. Using an expanding flow model, we derived the most plausible dynamical center of the outflow, pointing to SMA1b (1.3 cm and 7 mm continuum source) as the outflow driving source. Based on our results and other existing parallax results, we derive the pitch angles of the Sagittarius arm as 6
 2 ± 54 along the Galactic longitude range of ∼07 − ∼401 assuming a perfect logarithmic spiral. We derived the peculiar motion of NGC 6334I(N) to be −4 ± 1 km s−1 toward the Galactic center, 8 ± 2 km s−1 in the direction of the Galactic rotation, and 25 ± 2 km s−1 toward the Galactic north pole.
Export citation and abstract BibTeX RIS
1. INTRODUCTION
Measurement of the distances to massive star-forming regions is necessary for diagnosing their physical conditions/properties such as luminosity, masses, sizes, and studying the evolution of the young stellar and/or proto-stellar objects. The widely used kinematic distance from the Sun to a source in the Milky Way is derived from the radial velocity of the source and the galactic rotation model. There is a high risk of significant difference among the photometric, kinematic and actual distances if their photometric magnitudes are affected by interstellar extinction and if their motions are affected in one way or the other by nearby supernovae or super-bubble or the gravitational potentials of the spiral arm and/or the galactic bar (e.g., Foster et al. 2012). There are very long baseline interferometry (VLBI) observation reports showing significant difference in the parallactic and kinematic distances to some sources due to large peculiar motions of the source influenced by an expanding super-bubble (e.g., Sato et al. 2008), a gravitational perturbations from the galactic bar (Brunthaler et al. 2009), an expanding arm effect (Sanna et al. 2009), and other factors (e.g., Kurayama et al. 2011).
VLBI Exploration of Radio Astrometry (VERA) is especially dedicated to phase-referencing VLBI observations with the aim of measuring the annual parallaxes of galactic maser sources whose results were recently summarized by Honma et al. (2012). Equipped with a dual-beam system (Honma et al. 2008), VERA is able to simultaneously observe a maser source and a position reference (quasar) source, thus improving its effectiveness in phase-referencing observations. VLBI observation of the masers and gas kinematics also trace activities associated with the formation of high mass stars. Spatio-kinematics of masers can be used to describe the three-dimensional (3D) motion of individual masing cloudlets (1–300 AU size) around massive young stellar objects (MYSOs). These maser proper motions can trace periodic violent ejections from the central star, collimated bipolar outflows and wide-angle outflows (e.g., Torrelles et al. 2011; Chibueze et al. 2012; Goddi et al. 2006).
NGC 6334I(N) is a massive star-forming region located on the northeast of the molecular cloud/H ii region complex NGC 6334 (an optical emission nebula popular called Cat's Paw nebula), which is expected to be located in the Sagittarius-Carina arm (hereafter referred to as Sagittarius arm), based on its photometric distance by Neckel (1978). The complex extends 32' × 40' across the sky. In the literature, the widely accepted distance to NGC 6334 is 1.74 ± 0.31 kpc, obtained via photometric measurements (Neckel 1978), while the rarely used kinematic distance is 0.7 ± 1.9 kpc (Wilson et al. 1970). Considering the outdated assumptions used in the kinematic distance calculations, we examined a recent model by Reid et al. (2009) and recalculated the kinematic distance using the local standard of rest velocities (VLSR) reported in Wilson et al. (1970) and Brogan et al. (2009). The obtained values in the order of (associated source, kinematic distance,VLSR, source of the VLSR value) are (SMA1, 0.87 kpc, −3.2 km s−1, H109α velocity from Table 1 of Wilson et al. 1970), (SMA1, 1.03 kpc, −4 km s−1, H109α velocity from Table 4 of Wilson et al. 1970), (SMA1, 0.67 kpc, −2.2 km s−1, H109α velocity from Table 5 of Wilson et al. 1970), (SMA1, 0.83 kpc, −3 km s−1; Brogan et al. 2009), and (SMA2, 1.21 kpc, −5 km s−1; Brogan et al. 2009). Noticeably, the derived kinematic distances are dependent on the accuracy of the VLSR, supposing all other parameters and assumptions are correct. The distance of 1.21 kpc obtained for the SMA2 object of NGC 6334I(N) is similar to the parallax distance we have derived (see Section 4.1). NGC 6334I(N) is the least evolved cluster protostars in the complex (less evolved than NGC 6334I), both separated by 90'' and shows different characteristics (Beuther et al. 2005). NGC 6334I(N) contains multiple millimeter objects, most of which show evidence of ongoing star formation activity (Hunter et al. 2006; Brogan et al. 2009). Sandell (2000) reported the size, gas mass, and bolometric luminosity of NGC 6334I(N) to be ∼10''(0.08 pc), ∼400 M☉, and ∼1.9 × 10³ L☉, respectively, assuming a distance of 1.74 kpc (Neckel 1978). In this paper, we report the results of the measurement of trigonometric parallax (with VERA only), and the relative proper motions of H2O masers associated with NGC 6334I(N) (with Japanese VLBI Network, JVN, consisting of VERA and other radio telescopes in Japan).
2. OBSERVATIONS
The observations of the H2O (615–523) masers in NGC 6334I(N) at a rest frequency of 22.235080 GHz were carried out in 10 epochs spanning about 2 yr from 2010 February 6 to 2012 April 6 (see Table 1 for the details of the observation epochs) using JVN. The JVN observations comprised of VERA, Nobeyama 45 m, National Institute of Communications Technology (NICT) Kashima 34 m, Gifu 11 m (only the first epoch) telescopes. VERA only was used for the annual parallax measurement, while VERA along with NRO, and NICT, which provided added sensitivity was used for measuring the relative proper motions of the water masers. Using the dual-beam system of the VERA telescopes, the H2O masers of NGC 6334I(N) and a position-reference source J1713−3418 were simultaneously observed. J1713−3418 belongs to the Very Long Baseline Array (VLBA< Galactic Plane Survey catalog by Petrov et al. (2011), with a positional uncertainty of 0.44 mas in right ascension (R.A.) and 0.92 mas in declination. These two sources are spatially separated by 144. At each epoch, the total observation time was about 5 hr, including the scans on NGC 6334I(N), a bandpass calibrator (NRAO 530), and the position-reference source, J1713−3418. The data were recorded onto magnetic tapes at the rate of 1024 Mbps, providing a total bandwidth of 256 MHz, which were digitized in four quantization levels and then divided into 16 base-band channels (BBCs) with a bandwidth of 16 MHz each. One of the BBCs was assigned to the H2O maser emission in NGC 6334I(N), while the remaining 15 BBCs were assigned to the continuum emission from the position-reference source.
Table 1. VERA Observations of NGC 6334I(N)
| Code | Observation | JVN | VERA |
|---|---|---|---|
| Epoch | Telescopesa | Astrometry? | |
| r10037a | 2010 Feb 6 | VERA, NICT, Gifu | Yesb |
| r10137a | 2010 May 17 | VERA, NRO | No |
| r10316a | 2010 Nov 12 | VERA, NICT | No |
| r11060b | 2011 Mar 1 | VERA | Yes |
| r11110a | 2011 Apr 20 | VERA, NRO | Yes |
| r11139a | 2011 May 19 | VERA, NRO | No |
| r11273a | 2011 Sep 30 | VERA | Yes |
| r11299a | 2011 Oct 26 | VERA | Yes |
| r12065a | 2012 Mar 5 | VERA, NRO | Yes |
| r12097b | 2012 Apr 6 | VERA, NRO | Yes |
Notes. aTelescopes that participated in the epoch of observation. VERA comprises of Mizusawa, Iriki, Ogasawara, and Ishigakijima stations. NICT is the National Institute of Communication Technology 34 m telescope Kashima, while NRO represents Nobeyama Radio Observatory 45 m telescope. Gifu is an 11 m telescope in northern Japan. bThis epoch was not used in the annual parallax fitting.
Download table as: ASCIITypeset image
The data correlation was made with the Mitaka FX correlator. The accumulation period of the correlation was set to 1 s. The correlation outputs consisted of 512 and 32 spectral channels for the H2O maser and reference continuum emission, respectively. The H2O maser spectral resolution was 15.625 kHz, corresponding to a velocity spacing of 0.42 km s−1.
3. DATA REDUCTION
The two-beam astrometric data reduction was conducted with the VERA Data Analyzer (VEDA) developed by the software development group at the Mizusawa VLBI Observatory of the National Astronomical Observatory of Japan for astrometric analysis of VERA data (Niinuma et al. 2011). We adopted the following phase tracking centers for the observed sources; J1713−3418 (position-reference source) (αJ2000 = 17h13m09 941507 and δJ2000 = −34°18'29
 4276) and NRAO 530 (bandpass calibrator) (αJ2000 = 17h33m0270579 and δJ2000 = −13°04'4954823). The reference position of NGC 6334I(N) was set as (αJ2000 = 17h20m55192 and δJ2000 = −35°45'0377, corresponding to Galactic longitude, l, and latitude, b of 35145 and 066, respectively) in a recalculation of the delay tracking model.
The VEDA pipeline data reduction steps include time and frequency averaging (Niinuma et al. 2011) of the position-reference source, J1713−3418, to reduce the size of the data set. System-temperature (Tsys)-based amplitude calibration and bandpass calibration of NGC 6334I(N) (target maser source), and J1713−3418 were performed with the total-power spectra of the bandpass calibrator (NRAO 530). The delay and delay-rate offset were determined by a fringe search process on NRAO 530. The station solutions determined by NRAO 530 were used in the fringe search of J1713−3418, after which the image were obtained by CLEAN deconvolution and then self-calibration was performed on the obtained image. The phase solutions of J1713−3418, obtained with integration time of 1 s, was applied to the maser source to obtain its absolute position. The typical peak intensity of J1713−3418 was ∼270 mJy beam−1. Doppler tracking was carried out on the maser source. The velocity channels containing bright maser spots were imaged with a field of view of 2''× 2'' with 1024 × 1024 grids in order to find maser spots detected at a signal-to-noise ratio over 5. The final images of individual detected maser spots were obtained each with an area of 10 mas × 10 mas (size) with 512 × 512 grids.
The single-beam, self-calibrated imaging of the H2O masers in NGC 6334I(N) was done with Astronomical Image Processing System (AIPS) package developed by the National Radio Astronomy Observatory (NRAO), using the standard procedures. The instrumental delay calibration was carried out with the scans on the calibrator, NRAO 530. The fringe fitting and self-calibration procedures were performed for a Doppler shifted channel including a bright and quasi-consistent maser spot (velocity component) in the SMA1 region of NGC 6334IN. Their solutions were applied to all the data and then the map of the maser clusters were made. The CLEAN deconvolved image cubes of the maser source were created using the beam that was synthesized from naturally weighted visibilities. The typical synthesized beam size was ∼1.3 milliarcseconds (mas). The H2O maser image cubes were made with a cell size of 0.2 mas. For the wide-field mapping and objective maser spot identification, we used an automatic pipeline script which runs on the AIPS POPS environment and mainly consists of AIPS tasks and adverbs: IMAGR, IMSTAT, and SAD. The H2O maser spot identification was done by adopting a signal-to-noise ratio cut-off of ∼7. From the Gaussian fitting errors, we estimated the accuracies of the relative positions of the maser spots to be 0.01–0.30 mas in R.A. and 0.02–0.30 mas in declination. The individual maser features were defined as clusters of maser spots or velocity components and each feature position was defined from the brightness peak of the feature following the identification method of Imai et al. (2002), also used in Chibueze et al. (2012). We used the results of our astrometric analysis to determine the absolute position of the masers and adopted a reference position for superimposing the maser maps.
4. RESULTS
4.1. Annual Parallax of NGC 6334I(N)
We typically detected an average of ∼30 maser spots per epoch and one reasonably stable maser spot of local standard of rest velocity (vLSR) −10.1 km s−1 was detected in 70% of all the observation epochs. The vLSR range of the detected maser spots is −23 km s−1 to 3 km s−1, distributed over an area of 400 mas × 400 mas. The detected maser features (a group of maser spots coincident at the same position and velocity) were highly variable and extended so as to be resolved out in VERA longer baselines like the Mizusawa–Ishigakijima baseline. As such, we have discretely selected significantly compact maser emissions from the −10 km s−1 component for annual parallax measurement to improve its accuracy. Finally, we decided to use only the −10 km s−1 maser feature detected in seven epochs for the annual parallax fitting. Only six out of the seven epochs were used for the parallax fitting. This is because the maser feature was detected in the first epoch (observation code r10037a) and subsequently in the fourth epoch with a space of 1 yr non-detection period. In fitting the annual parallax the first epoch data point clearly deviated from the fit, thus, was not used in the annual parallax measurement. The feature detected in the first epoch is most likely different from that detected later though they have the same velocity.
We obtained the annual parallax (π) to be 0.789 ± 0.161 mas, corresponding to a distance of 1.26 kpc with 20% accuracy. The standard deviations of the post-fit residuals were 0.238 and 0.278 mas in R.A. and declination, respectively. We introduced an error floor of 0.238 mas and 0.278 mas in R.A. and declination, respectively, for all of the results of the position measurements to make the reduced χ2 to be unity in the least-squares analysis. These error floors can be defined as the positional uncertainties in the astrometric observations that may have originated from the difference in the optical path lengths between the target and reference sources, caused by the atmospheric zenith delay residual and/or a variability of the structure of the maser feature (Honma et al. 2007; Hirota et al. 2007).
Figure 1 shows the positions of the maser spot used for the parallax fitting and absolute proper motion fittings. The positional variations show systematic sinusoidal modulation with a period of 1 yr, caused by the parallax. Table 2 shows the parallax fitting results and the obtained absolute proper motion of the maser spot. Our obtained parallax distance to NGC 6334I(N) is ∼500 pc less than the photometric distance (Neckel 1978) but is very similar to the recalculated kinematic distance using Reid's model (Reid et al. 2009), and the VLSR of SMA2 from Brogan et al. (2009; see Section 1).

Figure 1. (a) Maser feature position on the sky and the modeled maser motion (solid curve). (b) Maser feature position in R.A. (black circle) and decl. (gray circle) offsets against the epoch of observation. (c) Same as (b) but a linear proper motion is subtracted. The error bars are estimated as explained in Section 4.
Download figure:
Standard image High-resolution imageTable 2. Results of the Parallax Fitting for NGC 6334I(N)
| vLSR | μαcosδa | μδb | Parallax (π) |
|---|---|---|---|
| (km s−1) | (mas yr−1) | (mas yr−1) | (mas) |
| 10.1 | −2.20 ± 0.26 | 3.93 ± 0.28 | 0.79 ± 0.16 |
Notes.
aProper motion of the maser spot in the right ascension direction. The Galactic longitude, l, and latitude of the NGC 6334I(N) are b of 35145 and 066, respectively.
bProper motion of the maser spot in the declination direction.
Download table as: ASCIITypeset image
The dust and gas mass estimates of millimeter cores are strongly dependent on the source distance. Recently, Sandell (2000) and Brogan et al. (2009) estimated the dust and gas mass associated with individual objects detected toward NGC 6334I and I(N). In both cases, the mass calculations were made with the distance of 1.7 kpc (Neckel 1978), therefore, we revised the mass and luminosity estimates in Sandell (2000) and Brogan et al. (2009) using our parallax distance of 1.26 kpc as a benchmark (see Table 3). The originally reported values are reduced by 50%, and this cast some doubt on the ability of some of the millimeter continuum cores to evolve into massive stars.
Table 3. Revised Physical Parameters of NGC 6334I(N)
| Recalculation of the Masses and Luminosities Reported Sandell (2000) and Brogan et al. (2009) | |||||||
|---|---|---|---|---|---|---|---|
| Source | Values Reported | Revised Values | 1.3 mm Core | Values Reported | Revised Values | ||
| (Sandell 2000) | (Brogan et al. 2009) | ||||||
| Mtota | Ltota | Mtot | Ltot | Mgasa | Mgas | ||
| (M☉) | (L☉) | (M☉) | (L☉) | (M☉) | (M☉) | ||
| NGC 6334I | 200 | 2.6 × 10⁵ | 106 | 1.38 × 10⁵ | SMA1 | 16–14 | 9–7 |
| SM1 | 175 | 1.2 × 10³ | 93 | 0.64 × 10³ | SMA2 | 7–6 | 4–3 |
| SM2 | 70 | 1.2 × 10³ | 37 | 0.64 × 10³ | SMA3 | 74–23 | 39–12 |
| SM3 | 100 | 0.4 × 10³ | 53 | 0.21 × 10³ | SMA4 | 52–16 | 28–9 |
| NGC 6334I(N) | 400 | 1.9 × 10³ | 212 | 1.01 × 10³ | SMA5 | 28–9 | 15–5 |
| SM4 | 120 | 0.4 × 10³ | 64 | 0.21 × 10³ | SMA6 | 32–13 | 17–7 |
| SM5 | 120 | 0.4 × 10³ | 64 | 0.21 × 10³ | SMA7 | 22–7 | 12–4 |
| SM6 | 100 | 0.2 × 10³ | 53 | 0.11 × 10³ | |||
| SM7 | 130 | 0.4 × 10³ | 69 | 0.21 × 10³ | |||
| SM8 | 80 | 0.2 × 10³ | 42 | 0.11 × 10³ | |||
Note. aSandell (2000) and Brogan et al. (2009) estimations were based on the distance of 1.74 kpc (Neckel 1978).
Download table as: ASCIITypeset image
4.2. H2O Maser Distribution and Spatio-kinematics in SMA1 Object of NGC 6334I(N)
We detected H2O maser clusters corresponding to C1 to C11, some associated with millimeter objects. However, others are not associated with any millimeter source as previously reported by Brogan et al. (2009) in one of the observation epochs carried out under the best weather and other observation conditions (including usage of large antennas). A total of ∼200 maser features were detected in our observations. Figure 2 shows the distribution of the H2O maser clusters detected in our JVN observation on 2010 May 17. Because the self-calibration procedure, using a bright maser spot in SMA1, was applied in order to also detect weak maser emissions, all the map origin represents the location of SMA1. Our astrometric data reduction was used to determine the absolute position of the reference bright maser spot to be (α, δ)J2000 = (17h20m551909, − 35°45'037987) on 2010 May 17 within 1 mas error. This error is a combination of the errors due to the residual phase in phase-referencing, the zenith delay of the troposphere and the ionosphere, the instrumental offset calibration, and the low declination nature of the target source. Using this reference position, we have investigated the correspondence of each maser cluster with the results of Brogan et al. (2009). Figure 2 (insert) shows the distribution of the H2O maser features in SMA1 object. The other maser clusters are likely tracing star formation activities in the region especially those associated with millimeter sources.

Figure 2. Distribution of all the H2O maser clusters and features detected in observations toward NGC 6334I(N). Insert: zoom of the H2O maser distribution associated with the SMA1 object. The reference maser position is located at R.A.(J2000.0) = 17h20m551909, decl.(J2000.0) = −35°45'037987.
Download figure:
Standard image High-resolution imageFigure 3 shows the traced relative proper motions of 23 H2O maser features (traced in three or more adjacent epochs with the criteria that the feature must identical in VLSR, and position; see Table 4) in SMA1 (consisting of four 1.3 cm continuum objects, SMA1a, b, c (Rodríguez et al. 2007) and 1d reported by Brogan et al. 2009) object of NGC 6334I(N) overlaid on the zoomed Very Large Array (VLA) 1.3 cm continuum image of the compact SMA1b and 1d objects around the masing region. It is important to note that the 1.3 cm continuum image of Brogan et al. (2009) is what we used in this paper, was obtained from the reanalyzed data of Rodríguez et al. (2007). While the position accuracy of the VLA continuum object is estimated to be about 50 mas, VERA astrometric result provides maser feature absolute position accuracy better than 1 mas. The maser distribution is elongated along the north–south direction, extending over ∼600 mas (∼720 AU) and tracing a bipolar outflow coincident with the position of SMA1b and may be associated with the outflow reported by Rodríguez et al. (2007). The mean proper motion amplitude of the maser features was obtained to be 2.03 mas yr−1 and all the observed maser proper motion most likely originated from the same driving source, except for the two features at (α, δ)J2000 = (17h20m55197, − 35°45'0396) with vLSR = −9 km s-1 and (17h20m55198, − 35°45'0382) with vLSR = −25 km s-1. The driving source is most likely located at, or near, R.A. (J2000.0) = 17h20m551909, and declination (J2000.0) = −35°45'0370 (see Figure 3) and is suggestive of a bipolar outflow driving source, associated with SMA1b. The dynamical timescale of the observed bipolar outflow activities is derived, from a half length of the maser feature distribution divided by the mean proper motion amplitude, to be ∼295 yr. This is in the same order as the dynamical timescale of the maser bipolar outflow activity associated with the Cepheus A HW3d of dynamical timescale (∼100 yr; Chibueze et al. 2012) and some other episodic maser events (Torrelles et al. 2011).
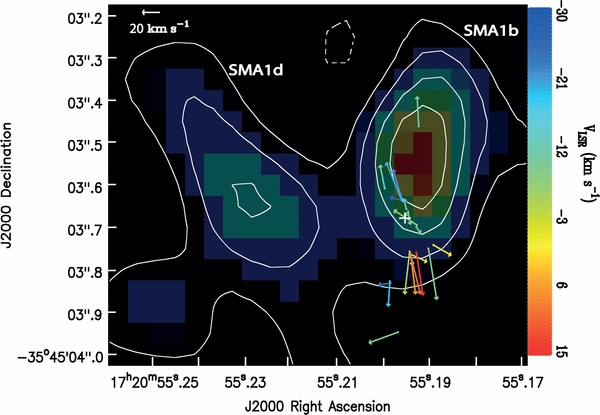
Figure 3. Proper motions of the H2O maser spots relative to the brightest spot derived from our observations superposed on the zoomed 1.3 cm continuum with VLA (Brogan et al. 2009; Rodríguez et al. 2007) in white contours with pseudo color. The synthesized beam and the rms noise of the image are 038 × 027 and 64 μJy beam−1. The contour levels are −0.0954, 0.0954, 0.191, 0.286, and 0.382 mJy beam−1. The vectors show the position (start point of the vector) and relative proper motion on the sky, respectively. The white plus symbol at (α, δ)J2000 = (17h20m551909, − 35°45'0370) shows the most probable location of the driving source from the observed maser kinematics (see Section 4.2).
Download figure:
Standard image High-resolution imageTable 4. Relative Proper Motions of the Water Maser in SMA1 Object of NGC 6334I(N)
| Feature | Offset | Proper Motion | Radial Motion | |||||
|---|---|---|---|---|---|---|---|---|
| (mas) | (mas yr−1) | (km s−1) | ||||||
| R.A. | Decl. | μx | σμx | μy | σμy | VLSR | ΔVLSR | |
| 1 | 17.17 | 30.26 | −1.41 | 3.48 | 0.26 | 4.25 | −28.96 | 2.42 |
| 2 | 17.19 | 31.41 | 3.82 | 1.87 | 1.00 | 4.20 | −25.67 | 1.58 |
| 3 | 53.52 | −191.32 | 3.85 | 0.28 | −0.53 | 0.99 | −23.47 | 3.16 |
| 4 | 18.32 | 33.85 | 2.93 | 1.95 | 8.57 | 4.83 | −21.08 | 1.58 |
| 5 | 20.12 | 32.93 | 4.98 | 2.97 | 10.81 | 5.19 | −19.68 | 0.84 |
| 6 | 56.00 | −186.31 | 0.54 | 1.38 | −7.13 | 3.17 | −18.29 | 1.37 |
| 7 | 71.79 | 64.85 | 1.48 | 1.62 | 6.67 | 3.19 | −12.81 | 0.84 |
| 8 | 5.49 | 9.26 | 0.85 | 0.39 | 2.81 | 0.67 | −12.32 | 1.26 |
| 9 | −32.33 | 233.50 | 0.53 | 1.48 | 8.45 | 3.45 | −12.05 | 0.62 |
| 10 | −0.18 | 2.62 | 1.11 | 0.05 | −1.14 | 0.07 | −11.76 | 0.20 |
| 11 | 0.00 | 0.00 | 0.00 | 0.47 | 0.00 | 0.53 | −11.32 | 1.26 |
| 12 | 0.00 | 0.01 | −0.73 | 0.05 | −3.39 | 0.28 | −10.18 | 0.16 |
| 13 | −24.92 | −39.57 | −1.35 | 1.66 | −1.77 | 0.74 | −9.86 | 0.94 |
| 14 | 31.08 | −324.22 | 9.37 | 0.22 | −3.04 | 1.41 | −8.81 | 0.73 |
| 15 | −62.00 | −97.46 | −2.69 | 1.53 | −14.65 | 4.35 | −8.32 | 0.37 |
| 16 | −26.84 | −34.25 | 7.40 | 0.19 | 4.22 | 0.60 | −6.91 | 0.20 |
| 17 | −4.51 | −105.95 | 1.58 | 2.84 | −12.15 | 5.53 | −4.82 | 1.15 |
| 18 | −4.16 | −111.88 | −5.59 | 2.94 | −2.28 | 8.39 | −1.37 | 0.73 |
| 19 | −5.27 | −108.93 | −0.81 | 2.82 | −3.51 | 6.80 | −0.58 | 0.74 |
| 20 | −77.29 | −88.16 | −5.71 | 1.52 | −2.91 | 4.04 | 1.16 | 0.16 |
| 21 | −8.13 | −113.02 | −1.51 | 3.67 | −11.40 | 6.17 | 7.28 | 0.84 |
| 22 | −6.55 | −111.70 | −3.19 | 2.01 | −11.48 | 4.40 | 9.77 | 1.68 |
| 23 | −25.30 | −108.31 | −2.09 | 2.86 | −12.22 | 4.95 | 14.66 | 1.26 |
Download table as: ASCIITypeset image
To find the possible origin of the outflow, we performed least-squares fitting analysis following the same procedure reported in Imai et al. (2000, 2011) and Chibueze et al. (2012). We adopted the radial velocity of the reference maser feature to be −12 km s−1. The number of maser features with measured proper motions, Nm, is 23. We first considered the 3D position vectors of the maser features with respect to the originating point of the outflow by assuming that the individual maser features are moving independently and radially from the originating point. The free parameters of the model fitting are the position vector of the originating point (x0, y0) and the systemic motion vector of the outflow on the sky (V0x, V0y). z0 ≡ 0 and V0z = VLSR = −12 km s−1 are fixed.
The results of the model fitting is shown in Table 5, and the obtained dynamical center is also derived in the absolute coordinates within reasonable errors as shown in Figure 3.
Table 5. Parameters of the Best Fit 3D Spatio-kinematical Model of the H2O Masers in NGC 6334I(N)
| Parameter | Value |
|---|---|
| ΔX0 (mas)a | 0 ± 5 |
| ΔY0 (mas)a | −12 ± 8 |
| V0X (km s−1)a | 4.1 ± 2 |
| V0Y (km s−1)a | 4.2 ± 4 |
| VLSR (km s−1)b | −12 |
| D (kpc)b | 1.26 |
 c c |
10.18 |
Notes. aRelative value respect to the maser feature ID 12. bAdopted VLSR of the reference maser feature. cThe χ2-square value was obtained in the model fitting based on the least-squares method.
Download table as: ASCIITypeset image
Figure 4 shows the distributions of the derived maser expansion velocities, with the originating point considered to be close to the map origin (0,0) mas in offsets. With the assumed radial flow from an originating point, a positive and a negative expansion velocity means an outflow and an infall motion, respectively. All except four of the maser features exhibited positive expansion velocities with possible acceleration from 50 to 100 km s−1. The negative expansion velocity components might be associated with turbulent motions or misidentification of the proper motions of the associated maser features.

Figure 4. Expansion velocity distribution of the maser features in SMA1 object of NGC 6334I(N) derived from the model fitting (Section 4.2). The maximum error in Vexp(i) and ri are ±4 km s−1 and ±1 mas, respectively. Below the dashed line (0 km s−1 expansion velocity line) are the negative expansion velocities which could be explained misidentified proper motions and/or turbulence.
Download figure:
Standard image High-resolution image5. DISCUSSION
5.1. Distance and Peculiar Motion of NGC 6334I(N)
We have determined the position, parallax, and proper motion of NGC 6334I(N) and its corresponding distance. Figure 5 shows that NGC 6334I(N) is most likely associated with gas belonging to the Sagittarius arm, following the spiral arm model by Russeil (2003).
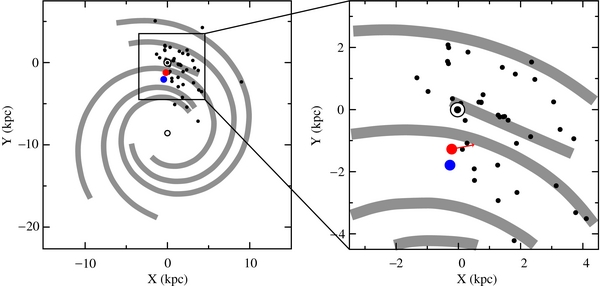
Figure 5. Positions of the sources (black filled circles) reported by Honma et al. (2012; annual parallaxes of the source have been measured) on Galactic plane. Location of the NGC 6334I(N) indicated by the red filled circle (this work), the red arrow indicates the peculiar motion of the source, and blue filled circle (based on 1.74 kpc; Neckel 1978). The spiral arms are depicted based on the Russeil (2003) arm model.
Download figure:
Standard image High-resolution imageFrom our expanding flow model, we estimated the proper motion of the reference maser spot with respect to the central object to be 4.1 ± 2.0 km s−1, and 4.2 ± 4.0 km s−1 in the R.A. and declination, respectively. It is important to note that the absolute mean value of all the relative proper motions traced in SMA1b is 3.5 ± 9.9 km s−1, and −11.7 ± 17.5 km s−1 in R.A. and declination. We deducted the proper motion of the reference maser spot (of our model) from the absolute proper motion derive from our parallax fitting and computed the average of the summed value of the errors. The resultant motion, which we used for the peculiar motion calculation, is −2.88 ± 0.30 mas yr−1 and 3.23 ± 0.39 mas yr−1 corresponding to −17.34 ± 1.78 km s−1, and 19.46 ± 92.34 km s−1 at 1.26 kpc, respectively.
We used the line-of-sight velocity of the central millimeter object of NGC 6334I(N), SMA1, (∼ − 2.8 ± 0.5 km s−1 measured by Brogan et al. 2009 using ∼5'' scale compact millimeter line, CH3OH). Thus, we could convert positions and velocities of NGC 6334I(N) from the equatorial heliocentric reference frame to the Galactic reference frame following the procedure of Reid et al. (2009). We assumed a flat rotation of the Galactic frame. The distance of the Sun from the Galactic center (R0) and the rotation speed of the local standard of rest (Θ0) were adopted as 8.05 kpc and 235 km s−1, respectively (Honma et al. 2012). The standard solar motion, (U☉, V☉, W☉) = (11.10 ± 0.75, 12.24 ± 0.47, 7.25 ± 0.37) km s−1, was adopted from Schonrich et al. (2010).
We derived the peculiar motion of NGC 6334I(N) to be (Usrc, Vsrc, Wsrc) = (− 4 ± 1, 8 ± 2, 25 ± 2) km s−1, where Usrc, Vsrc, and Wsrc are directed toward the Galactic center, in the direction of Galactic rotation and toward the Galactic north pole, respectively. We compared our derived peculiar motion of NGC 6334I(N) with those reported in other sources (listed in Sakai et al. 2012) and found the obtained values to be similar (within the error values) to those of other regions located in the Sagittarius arm. Figure 5 shows the location of NGC 6334I(N) at 1.26 kpc (red filled circle), and 1.74 kpc (blue filled circle). The red arrow represents the resultant velocity (8.94 ± 2.24 km s−1) of NGC 6334I(N) in the galactic plane, derived from (Usrc, and Vsrc). The peculiar motion of NGC 6334I(N) toward the Galactic center and in the direction of Galactic rotation are in agreement with the values reported on source star-forming regions in the Sagittarius arm (see Sakai et al. 2012), but the motion toward the Galactic north pole is significantly larger than usual. There is a noticeable galactic north–south evolution of massive stars in the NGC 6334 complex (Rodríguez et al. 1982), which is also visible in the optical and infrared bands. We suggest that the overall star formation activities in the complex may be responsible for the observed high peculiar motion of NGC 6334I(N) toward the Galactic north pole.
5.2. Pitch Angle of Sagittarius Arm
The pitch angle of the Sagittarius arm has been a source of recent debate. Sato et al. (2010a) derived the pitch angle, i,7 of the Sagittarius arm using the annual parallax results of G14.33–0.64 (Sato et al. 2010a), G35.20–0.74, G35.20–1.74 (Zhang et al. 2009), and W51 IRS2 (Xu et al. 2009). Sato et al. (2010a) fitted for the pitch angle (i) of the Sagittarius arm using two possible combinations of three out of the four sources. They obtained (i) to be 112 ± 105 for a combination of G14.33–0.64, G35.20–0.74, and W51 IRS2, and 347 ± 27 for G14.33–0.64, G35.20–0.74, and G35.20–1.74. Xu et al. (2013) obtained the pitch angle of the Local Arm to be 101 ± 27, which based on private communication reported in Xu et al. (2013) is similar to those of the Sagittarius and Perseus arm from their unpublished BeSSeL results: www3.mpifr-bonn.mpg.de/staff/abrunthaler/BeSSeL/index.shtml. They argued that it is not a spur (not a bifurcate of the Sagittarius arm as suggested by Sato et al. 2010a) but could be a branch that is closer to the Perseus arm than to the Sagittarius arm.
Assuming a perfect logarithmic spiral, we derive the pitch angle of the Sagittarius arm using our results, NGC 6334I(N), and other available parallax results (IRAS 19213 (Oh et al. 2010), W51 Main/South (Sato et al. 2010b), G48.61+0.02 (Nagayama et al. 2011), G35.20–0.74 & G35.20–1.74 (Zhang et al. 2009), G12.89+0.49 & G15.03–0.68 (Xu et al. 2011), G14.33–0.64 (Sato et al. 2010a)), which covers a Galactic longitude range of ∼07 − ∼401. We estimated the pitch angle to be 62 ± 54 (see Figure 6), which is similar to the pitch angle of the Local Arm reported by Xu et al. (2013). For a comparison, we tried to fit the pitch angle of the Sagittarius arm excluding NGC 6334I(N) and obtained 42 ± 59. More results from both the BeSSeL and VERA projects will be needed to better constrain the pitch angle of the Sagittarius arm.

Figure 6. Fits of the pitch angle of the Sagittarius arm using sources in the arm with known parallax distance and NGC 6334I(N) indicated by the filled box (error estimates lie within the box).
Download figure:
Standard image High-resolution image
6. SUMMARY AND CONCLUSIONS
We made multi-epoch JVN (including VERA) observations toward NGC 6334I(N) at ∼22 GHz (H2O maser frequency). We measured the trigonometric annual parallax of the H2O maser source associated with NGC 6334I(N) to be 0.789 ± 0.161 mas, which corresponds to a distance of 1.26 kpc. Since our measured distance is ∼500 pc less than the widely used 1.74 kpc (Neckel 1978), we revised the physical parameters of the region.
We derived the pitch angle of the Sagittarius arm as 62 ± 54. We derived the peculiar motion of NGC 6334I(N) to be −4 ± 1 km s−1 toward the Galactic center, 8 ± 2 km s−1 in the direction of the Galactic rotation, and 25 ± 2 km s−1 toward the Galactic north pole. We suggested that the star formation activities in the entire NGC 6334 complex could be responsible for the observed peculiar motion of I(N) toward the Galactic north pole.
The structure of the maser proper motions trace a bipolar outflow, and the average proper motion velocity is ∼2.03 mas yr−1 corresponding to ∼12.22 km s−1. This suggests the expansion of the masing cloudlets powered by a central source. In an effort to study the proper motion in other maser clusters in the region, we are exploring archive data from other observational wavelengths for more information about the exciting sources in the region. High-resolution continuum observation of the exciting source with JVLA and ALMA will be necessary to extract the physical parameters of the MYSO.
We thank the anonymous referee for constructive comments and suggestions, which has helped improve the quality of this paper. We appreciatively acknowledge support of staff members of VERA project and the Astrophysics group of Kagoshima University. Our heartfelt appreciation goes to the students who have played some role in the VERA array operation at the four stations. J.O.C. has been financially supported for most part of this work by the Ministry of Education, Culture, Sports, Science, and Technology of Japan. We are also grateful to Crystal Brogan (NRAO) for providing us with the VLA 1.3 cm image of NGC 6334I(N).