


ABSTRACT
Ozone has been detected on the surface of Ganymede via observation of the Hartley band through the use of ultraviolet spectroscopy and is largely agreed upon to be formed by radiolytic processing via interaction of magnetospheric energetic ions and/or electrons with oxygen-bearing ices on Ganymede's surface. Interestingly, a clearly distinct band near 300 nm within the shoulder of the UV-Vis spectrum of Ganymede was also observed, but currently lacks an acceptable physical or chemical explanation. Consequently, the primary motivation behind this work was the collection of UV-Vis absorption spectroscopy of ozone formation by energetic electron bombardment of a variety of oxygen-bearing ices (oxygen, carbon dioxide, water) relevant to this moon as well as other solar system. Ozone was indeed synthesized in pure ices of molecular oxygen, carbon dioxide and a mixture of water and oxygen, in agreement with previous studies. The Hartley band of the ozone synthesized in these ice mixtures was observed in the UV-Vis spectra and compared with the spectrum of Ganymede. In addition, a solid state ozone absorption cross section of 6.0 ± 0.6 × 10⁻¹⁷ cm2 molecule−1 was obtained from the UV-Vis spectral data. Ozone was not produced in the irradiated carbon dioxide–water mixtures; however, a spectrally "red" UV continuum is observed and appears to reproduce well what is observed in a large number of icy moons such as Europa.
Export citation and abstract BibTeX RIS
1. INTRODUCTION
Following hydrogen and helium, oxygen is the next most abundant element in our solar system. As such, simple molecules containing oxygen are ubiquitous throughout the outer solar system as well as in the interstellar medium with water being the most abundant condensed material in the universe (Hudson & Moore 2001; Mason et al. 2006). Furthermore, observational studies on the satellites of Jupiter and Saturn have elucidated the presence of water (H2O), carbon monoxide (CO), and carbon dioxide (CO2) (Brown et al. 2006; Cruikshank et al. 2010; Showman & Malhotra 1999). In addition, these molecules have also been found on comets (Reach et al. 2013) and on surfaces of Kuiper Belt Objects (KBOs; Brown 2012) which are thought to be remnants of the early solar system and thus key to understanding its evolution. Furthermore, condensed molecular oxygen (O2) has been found on Ganymede (Spencer et al. 1995), Europa, and Callisto (Spencer & Calvin 2002). This presence of molecular oxygen on Ganymede has garnered great interest over the last few decades; particularly since even the coldest temperature on Ganymede (90 K) is well above the sublimation point of oxygen (40 K) and ozone (60 K). Consequently several explanations for the presence of condensed O2 have been put forth. One hypothesis suggested that solid O2 must exist in crevices that are not exposed to a significant amount of sunlight thus keeping temperature below the sublimation point (Baragiola & Bahr 1998; Vidal et al. 1997). Alternatively, microatmospheres of oxygen and ozone were suggested to be a product of radiation-induced bubble formation, thus overcoming the temperature barrier (Johnson & Jesser 1997) or possibly located within a hydrated mineral surface (Johnson 1999). Ozone is a radiolytic byproduct of solid O2 and consequently maybe seen as a chemical tracer (Noll et al. 1996, 1997) for molecular oxygen. However, this maybe a somewhat biased view as ozone has been shown to be an irradiation product of carbon dioxide and carbon monoxide as well (Bennett et al. 2004, 2009). In addition, ozone has shown to be directly produced from the radiolysis of water under very specific conditions; these being the condensation of water during the irradiation at temperatures above 60 K (Teolis et al. 2006). These conditions allow molecular oxygen (formed during the irradiation of water) to be volatile whereupon they are trapped by the condensing water, allowing sufficient amount of O2 to be energetically processed leading to the formation of ozone. Furthermore, water has been shown to be synthesized from proton implantation in ozone (Mokrane et al. 2009), thus restarting the cycle.
Beyond the solar system, interstellar grains have been found to be coated with icy mantles bearing water and carbon dioxide at significant quantities (Öberg et al. 2011). Additionally, astrochemical models of icy grain mantles predict that molecular oxygen presents a crucial component with varying concentrations depending mainly on condensation parameters within the cloud (Greenberg 1984; Tielens & Hagen 1982). The non-detection of ozone may unfortunately be a consequence of the v3 mode, the most intense transition at 9.6 μm (1040 cm−1) overlapping with the extremely intense and broad absorption feature of silicates grains at 10 μm (Bowey et al. 1998; Lommen et al. 2010).
These icy objects are constantly exposed to high energy charged particles that continue to chemically and physically evolve these ices. Thus laboratory experiments concerning the energetic processing (ions, photons, and electrons) of frozen gases (ices) are essential to interpret and direct future astronomical observations. This is particularly true for icy objects in the outer solar system. Most of the icy moons belonging to the giant planets are in fact embedded in the magnetospheres of their respective planets and consequently are exposed to a very intense bombardment of energetic ions and electrons. In addition, the surfaces of objects behind Neptune (the several families of Trans Neptunian Objects including KBOs such as Pluto) and comets in the Oort cloud are exposed to galactic cosmic rays and solar wind ion bombardment for billions of years that allow for a significant accumulation of the induced physical and chemical effects.
The effects of such a kind of processing are varied and include ion sputtering (Baragiola 2005; Brown et al. 1978; Johnson 1990; Johnson et al. 2008), the modification of the structure (crystalline or amorphous) of the sample (Baratta et al. 1991; Famà et al. 2010; Leto & Baratta 2003; Moore & Hudson 1992) and non-thermal chemical reactions that can lead to the formation of a multitude of molecules and organic refractory residues (Jones et al. 2011; Kaiser et al. 1997, 2013; Kaiser & Roessler 1997; Moore et al. 2001; Strazzulla 1998; Strazzulla et al. 2001). Sputtering has as the natural consequence of atoms and/or molecule expulsion that in some cases may help maintain tenuous exospheres e.g., the O2 exosphere of Ganymede and Europa (Hall et al. 1998; Teolis et al. 2010). Chemical alteration leads to the endogenous synthesis of new molecules, such as the formation of hydrogen peroxide (H2O2) that has been in found on the surface of Europa (Carlson et al. 1999), Ganymede and Callisto (Hendrix et al. 1999) as demonstrated by many experimental results (Gomis et al. 2004; Loeffler et al. 2006; Moore & Hudson 2000; Weijun et al. 2006; Zheng et al. 2006).
Most of the information we have on the chemical composition of those icy objects has been obtained by spectroscopy in the mid-(400–4000 cm−1) to near-(4000–12,500 cm−1) IR spectral region despite the majority of measurements on planetary ices being collected within the UV spectral region as pointed out in a recent review by Hendrix et al. (2013) that also outlined the need for more laboratory data in the UV-Vis region, a point first made over 30 yr ago (Thompson et al. 1987). In the laboratory, results obtained in the UV-Vis range are sparse. One reason for is simply a consequence that most intense molecular bands are in the mid to near IR range whereas spectral fingerprints at shorter wavelengths are elusive, particularly in solid state. Among the few data briefly mentioned are a series of laboratory experiments in which different ions were implanted in thick (100 μm) water ice layers (Sack et al. 1991); here, the authors suggest that the lower reflectivity of Europa's trailing hemisphere at around 280 nm can be attributed to the effect of any penetrating ion and not to SO2 produced by either the implantation of sulfur ions from Jupiter's magnetosphere or by the preferential condensation of SO2 from cryovolcanism as previously suggested (Lane et al. 1981). More recently new experiments have been performed on the production of ozone (O3) after 100 keV proton bombardment of water ice during condensation (Teolis et al. 2006). Ozone was in fact efficiently produced and the comparison with a UV-Vis spectrum (Noll et al. 1997) taken of Ganymede indicates ozone to be present. However, ozone cannot explain the whole feature observed on that moon as an additional peak is clearly observed in the shoulder of the ozone absorption.
Here we present new experimental results concerning UV-Vis spectroscopy of O2, CO2 and mixtures with H2O upon electron irradiation. By using the unique capabilities of the W. M. Keck Research Laboratory in Astrochemistry at the University of Hawaii, UV-Vis (240–1100 nm), IR (6000–400 cm−1), and mass spectra (1–500 amu) were recorded simultaneously allowing us to fully characterize the induced effects. The experimental apparatus is described in detail in the next section. Following is a section devoted to the description of the obtained experimental results with the relevance of these results to some astrophysical environments discussed in the last section.
2. EXPERIMENTAL APPARATUS
The experiments were carried out in a novel contamination-free ultra-high vacuum experimental setup at the newly established W. M. Keck Research Laboratory in Astrochemistry (Bennett et al. 2013; Jones & Kaiser 2013). The main chamber of the instrument is typically evacuated down to a base pressure of 5 × 10⁻¹¹ torr using oil-free magnetically suspended turbomolecular pumps and dry scroll backing pumps. A closed-cycle helium (Sumitomo, RDK-415E) cryostat cools a rhodium coated silver mirror (1.5 × 1.2 cm) to an ultimate temperature of 5.5 ± 0.1 K and is freely rotatable within the horizontal plane of the chamber. Rhodium coating was used to increase the overall reflectance in the UV and to avoid the optical absorption of pure silver at 320 nm (Taft & Philipp 1961). Upon reaching the minimum temperature, the gas mixtures (prepared in a separate, evacuated (10−7 torr) stainless steel chamber) were then deposited through a glass capillary with a background (uncorrected for ion gauge sensitivity) pressure reading in the main chamber of 5 × 10⁻⁸ torr for approximately 2 minutes yielding ice samples with a film thickness of 250 ± 5 nm (O2), 225 ± 5 nm (CO2), and 500 ± 20 nm for the water mixtures (1H2O:5CO2 and H2O:O2). The thicknesses of the samples were determined in situ using laser interferometry (Fulvio et al. 2009; Hudgins et al. 1993; Westley et al. 1998) using a HeNe laser (CVI Melles-Griot, 25-LHP-213) at 632.8 nm with an incident angle of 4°, and refractive indices (nf) of the ice as follows: 1.25 for O2 (Hudgins et al. 1993), 1.21 for CO2 (Luna et al. 2009; Satorre et al. 2008), and, 1.3 for the H2O:CO2 and H2O:O2 mixtures (Hudgins et al. 1993). The density of O2 was taken as 1.54 g cm−3 (Fulvio et al. 2009) and for CO2 at 0.98 g cm−3 (Satorre et al. 2008; Schulze & Abe 1980). For the water mixtures, these densities were calculated by accounting for a column density weighted fraction of their respective pure densities assuming volume additivity (Luna et al. 2012) yielding for the 1H2O:5CO2 mixture, 0.97 g cm−3 and 1.24 g cm−3 for the H2O:O2 mixtures taking into consideration the density of amorphous solid water at 0.94 g cm−3 (Angell 2004; Floriano et al. 1989; Jenniskens et al. 1998). The water–carbon dioxide mixture was found to be in a 1:5 ratio determined by integration and subsequent calculation of the column density using a modified Beers–Lambert law (Akira et al. 2006; Bennett et al. 2004; Hudson & Moore 2001) of the 13CO2 at 2280 cm−1 with A value of 7.8 × 10⁻¹⁷ (Gerakines et al. 1995) and deconvolution and integration of the H2O band at 1660 cm−1 subtracting the shoulder due the H2O·CO2 complex at 1610 cm−1 using an A value of 1.2 × 10⁻¹⁷ (Gerakines et al. 1995). In regards to the H2O:O2 mixture we assumed the ice deposited in a 1:1 ratio giving an estimated density of 1.24 g cm−3 as the column density of O2 cannot be determined from IR spectra.
The ice samples were then irradiated with 5 keV electrons isothermally at 5.5 ± 0.1 K over a square area of 0.9 ± 0.1 cm2 and an angle of 70° relative to the surface normal. The emissions current was measured both prior and post irradiation utilizing a faraday cup (Kimball Physics, FC-71) mounted on an ultrahigh vacuum compatible translation state. The total dose deposited into the ice sample was then determined utilizing a Monte Carlo electron simulation (CASINO) package (Hovington et al. 1997). The total energy deposited into the ice was determined as follows: O2 – 2.9 ± 0.6 eV per 16 amu (5.8 ± 1.2 eV molecule−1), CO2 – 9.4 ± 0.9 eV per 16 amu (26.0 ± 2.5 eV molecule−1), 1H2O:5CO2 – 8.1 ± 1.1 eV per 16 amu (10.6 eV molecule−1 CO2 and 14.7 V molecule−1 H2O), and H2O:O2 – 2.2 ± 0.8 eV per 16 amu (6.1 eV molecule−1 H2O and 6.1 eV molecule−1 O2).
A Fourier Infrared Transform Spectrometer (Nicolet 6700) monitored the samples throughout the duration of the experiment with an IR spectrum collected every two minutes (115 scans per minute) in the range of 6000–400 cm−1 at a resolution of 4 cm−1. A quadrupole mass spectrometer (Extrel, Model 5221) operating in residual-gas analyzer mode in the mass range of 1–500 amu with electron impact ionization energy of 100 eV allows for the detection of species in the gas phase under the duration of the experiment. A modified UV-Vis spectrophotometer (Nicolet Evolution 300 with pulsed xenon lamps) aided in the recording of absorption spectra in the range of 240–1100 nm with a resolution of 4 nm at a scan speed of 30 nm minute−1. Here, light from the spectrophotometer was directed onto the cryogenic ice via a UV enhanced aluminum coated mirror (ThorLabs, PF10-03-F01) through UHV compatible MgF2 35 CF view ports (Kurt J. Lesker, VPZL-275UM) while being focused by a cylindrical lens (CVI Melles-Griot SCX-25.4-381.4-UV) to compensate for the divergence in the vertical direction, upon which the beam was reflected off the rhodium coated silver at an angle of 30° onto UV enhanced parabolic mirror (Edmund Optics, 63-180), which then focused the light onto the original detector now placed into a black N2 purged box that effectively shielded any ambient light.
3. RESULTS
3.1. Molecular Oxygen
The formation of ozone after energetic processing of molecular oxygen was verified by the appearance of the band centered at about 260 nm (Figure 1) in agreement with previous results (Teolis et al. 2006) and that of pure condensed ozone (Vaida et al. 1989). In the bottom panel of Figure 1 the IR spectra of the same sample as deposited and after irradiation with an electron of 1.8 × 10¹⁵ electrons cm−2 are shown. The two bands that appear in the spectrum are easily assigned to ozone; v3 at 1040 cm−1 and 2v3 at 2105 cm−1 as previously observed (Baragiola et al. 1999; Bennett & Kaiser 2005; Ennis et al. 2011; Famá et al. 2002). An estimation of the column density of ozone was calculated utilizing a modified Beer-Lambert law yielding a value of 1.4 × 10¹⁶ molecules cm−2 at the maximum of the electron fluence. If we scale such a column density to the UV peak absorption intensity we obtain for the UV band a solid state ozone absorption cross section of 6.0 ± 0.6 × 10⁻¹⁷ cm2 molecule−1 compared with the average literature gas phase value of 1 × 10⁻¹⁷ (Keller-Rudek & Moortgat 2013).
Figure 1. UV spectra (top) and IR spectra (bottom) displaying a 250 nm thick frozen layer of O2 as deposited at 5.5 K and after different 5 keV electron irradiation with a total fluence of 1.8 × 10¹⁵ electrons cm−2 (total dose of 5.8 eV molecule−1). Download figure:
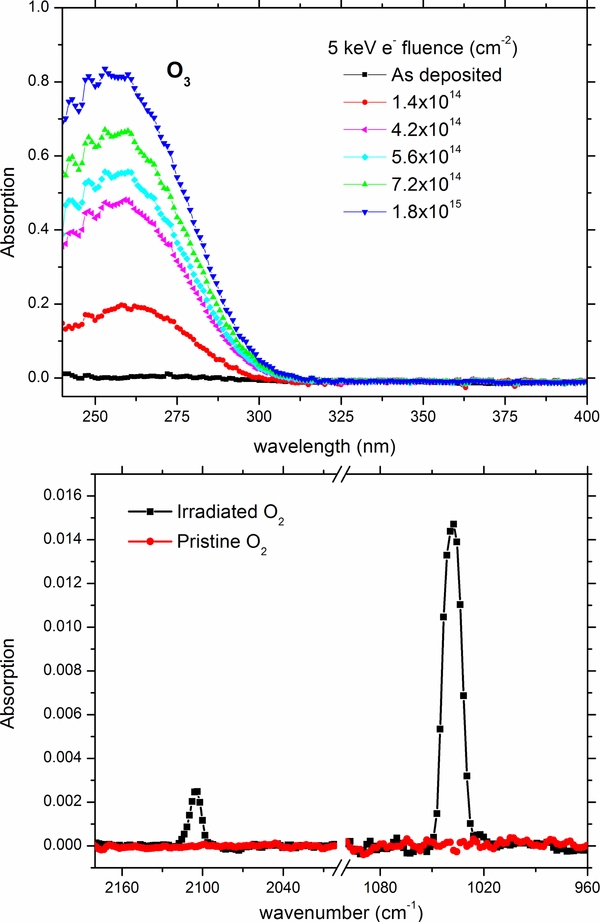
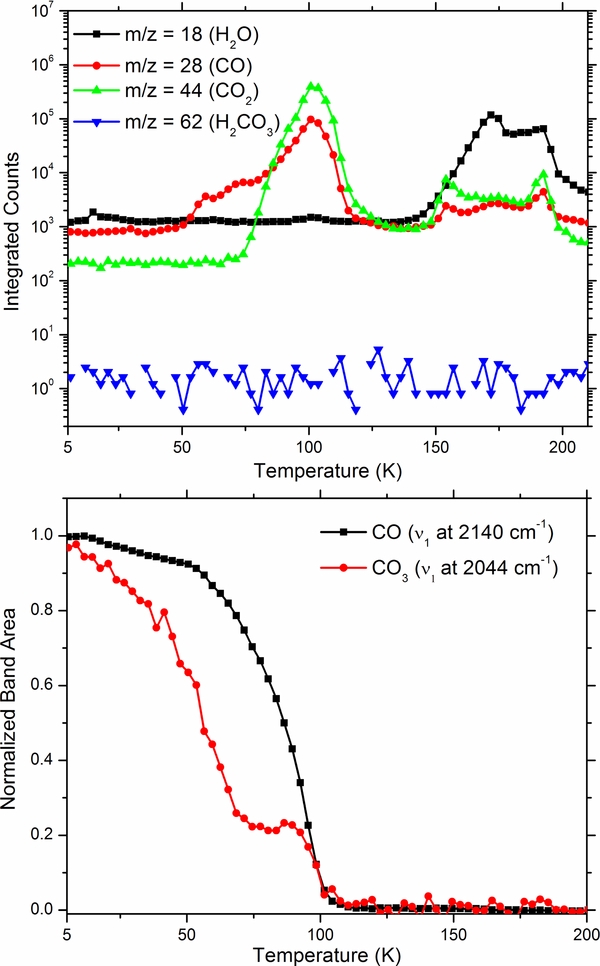
After the irradiation, the target was warmed up to room temperature with a controlled heat ramp of 1 K minute−1. The mass spectrum as a function of the temperature is shown in the top panel in Figure 2 and shows the quadrupole mass spectroscopy (QMS) sublimation profiles of the parent ice (32 and 16 amu) and ozone at 48 amu, notice that the dip at mass 32 amu is a result of the signal being saturated, consequently atomic oxygen (a by-product of the electron impact ionization process) is shown as well. Molecular oxygen is observed subliming at 20 K and 37 K corresponding to the bulk and substrate bound layers along with a minor fraction observed at 48 amu, which can be attributed to ion-molecule reactions taking place after electron impact ionization and to a small amount of endogenous formed ozone leaving with the parent ice. Pure substrate bound ozone is observed sublimating at approximately 60 K.
Figure 2. Mass spectrum (top) of a 250 nm thick frozen layer of O2 warmed up after irradiation at 5.5 K with 1.8 × 10¹⁵ electrons cm−2 total dose of 5.8 eV molecule−1. Bottom displays the sublimation profile of ozone derived from the v3 IR band at 1048 cm−1 for comparison. Download figure:

As reported in the bottom panel of Figure 2 the area of the ozone band (v3 at 1040 cm−1) exhibits a peak at 37 K that corresponds with the parent oxygen ice matrix sublimating, implying that trapped oxygen atoms are further reacting, thereby explaining the observed increase in intensity, upon which ozone immediately leaves with the rapidly sublimating oxygen (as observed in the QMS spectra), explaining the apparent decrease. This behavior was also observed in previous experiments (Bennett & Kaiser 2005; Sivaraman et al. 2007). In addition, the band shape of ozone changes quite drastically during the warm-up. The change in the shape is consistent up to the sublimation point of O2 at 37 K, and then changes again at 47 K, attributed to a phase change (β ← α, at 47 K; Sivaraman et al. 2007).
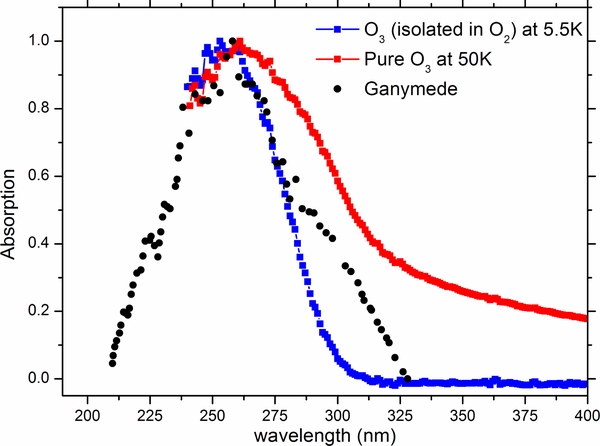
In order to observe the UV spectrum of pure ozone, the irradiated solid oxygen sample was warmed up to 50 K and then cooled back down to the minimum temperature of 5.5 K (Figure 3). Here, pure ozone exhibits an UV spectrum with a modest shift toward longer wavelengths, accompanied with a broadening and a slight increase in absorption in the continuum. Furthermore, we compare the UV spectra of ozone observed in irradiated solid oxygen along with pure ozone and that of Ganymede (Figure 3). The latter is the same used as presented by (Teolis et al. 2006) originally obtained by (Noll et al. 1997). Our results confirm that the endogenous synthesis of O3 via energetic processing, is most likely present within the surface of Ganymede. However, ozone alone cannot account for the entirety of the feature observed in the UV spectrum of that moon, particularly the additional peak at ∼300 nm within the red shoulder of the ozone absorption band. In addition, we may further negate the possibility that patches of pure, segregated ozone at different temperatures are pesent on the surface, as none of these can account for the observed UV absorption features either.
Figure 3. UV spectra of ozone observed in the irradiated oxygen ice at 5.5 K and of pure ozone at 50 K compared with that of Ganymede (black points) courtesy of Teolis et al. (2006) originally obtained by Noll et al. (1997). Download figure:
3.2. Carbon Dioxide
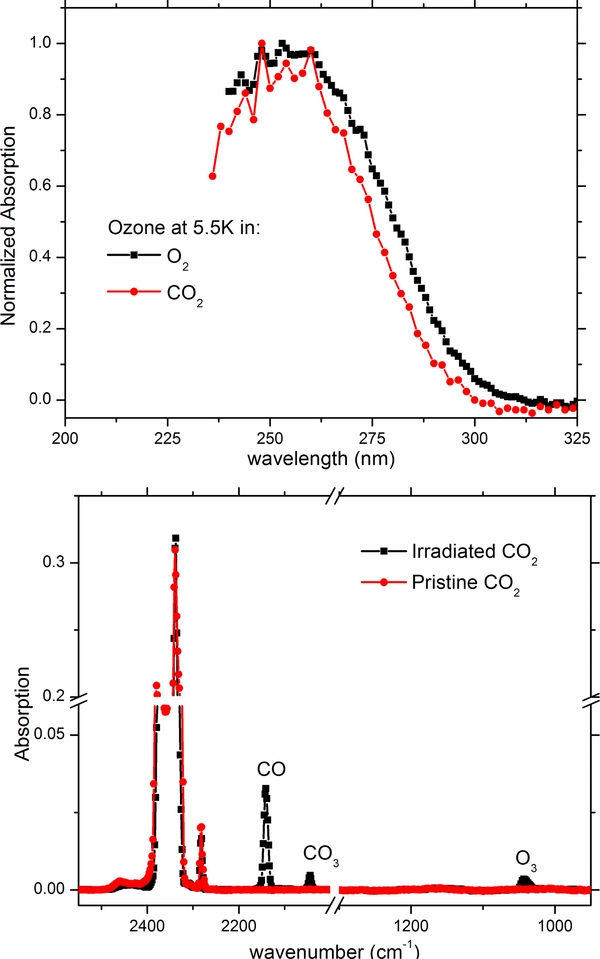
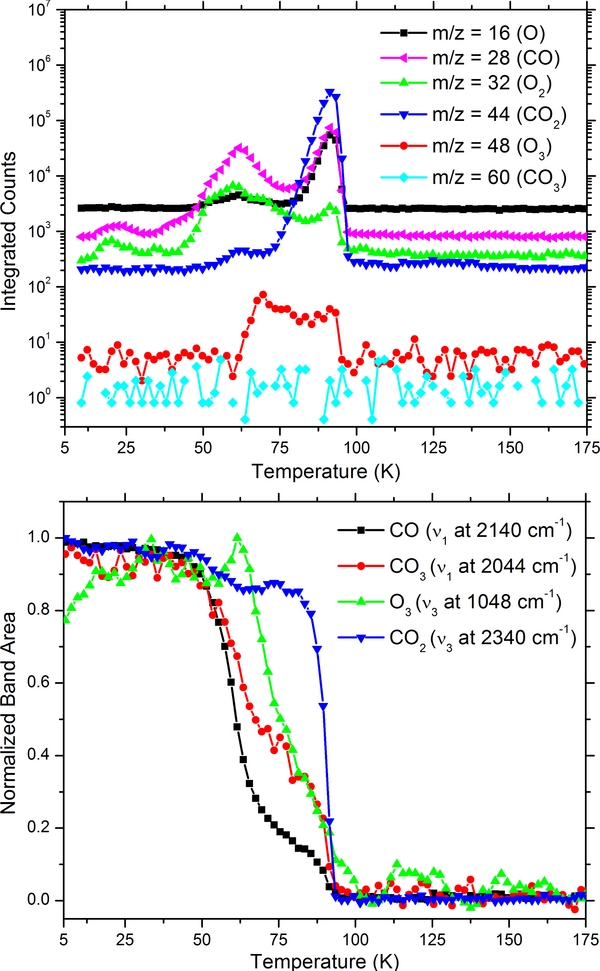
In an effort to examine the ozone formation in a different chemical environment, we then irradiated carbon dioxide with 5 keV electrons to ascertain if the UV absorption band of the formed ozone within a CO2 matrix differs in shape from that observed in a pure molecular oxygen ice, as this to our knowledge has not been investigated before. Carbon dioxide is present on several icy moons in the outer solar system (Raut et al. 2012) and ion bombardment experiments have demonstrated, by IR spectroscopy, that ozone is formed after irradiation of pure CO2 (Bennett et al. 2004; Duarte et al. 2009; Ennis et al. 2011). Results from electron bombardment of CO2 are shown in Figure 4 from which the formation of O3 is clearly observed. Furthermore, the UV absorption spectrum is only slightly different compared with that produced by the electron bombardment of molecular oxygen at 5.5 K. The IR spectrum collected for the same sample is shown in the bottom portion of Figure 4 from which we can confirm that the main products of energetic processing, are CO, CO3 and O3 as concluded in other experiments (Bennett et al. 2004; Duarte et al. 2009; Gerakines et al. 1996). The normalized band areas corresponding to carbon dioxide and to the three primary products (CO, CO3, and O3) are reported in Figure 5. We again see a peak in ozone, which would imply trapped radicals further reacting forming additional ozone. Here, carbon monoxide and ozone have different onsets, but continue sublimating until the parent (CO2) is finally gone at 90 K. Note that gas phase CO3 was not detected and no distinct temperature onset for a fragment of CO3 could be identified in agreement with previous experimental results (Bennett et al. 2004, 2010).
Figure 4. Normalized UV spectra (top) of ozone obtained after 5 keV electron irradiation with a total fluence of 4.5 × 10¹⁵ electrons cm−2 (26 eV molecule−1) of carbon dioxide compared with the result of irradiated molecular oxygen at 5.5 K. IR spectra (bottom) of CO2 as deposited and after irradiation showing the products CO, CO3 and O3. Download figure: Figure 5. QMS sublimation profiles (top) for the products identified by IR spectroscopy (CO, CO3, and O3) along with the parent ice (CO2). Note that also masses for atomic oxygen and O2 are reported as these are from the gas phase decomposition of CO3. Normalized IR band areas (bottom) corresponding to the parent CO2 ice and the three daughter species (CO, CO3 and O3) as a function of temperature. Download figure:
3.3. Mixtures – H2O:O2
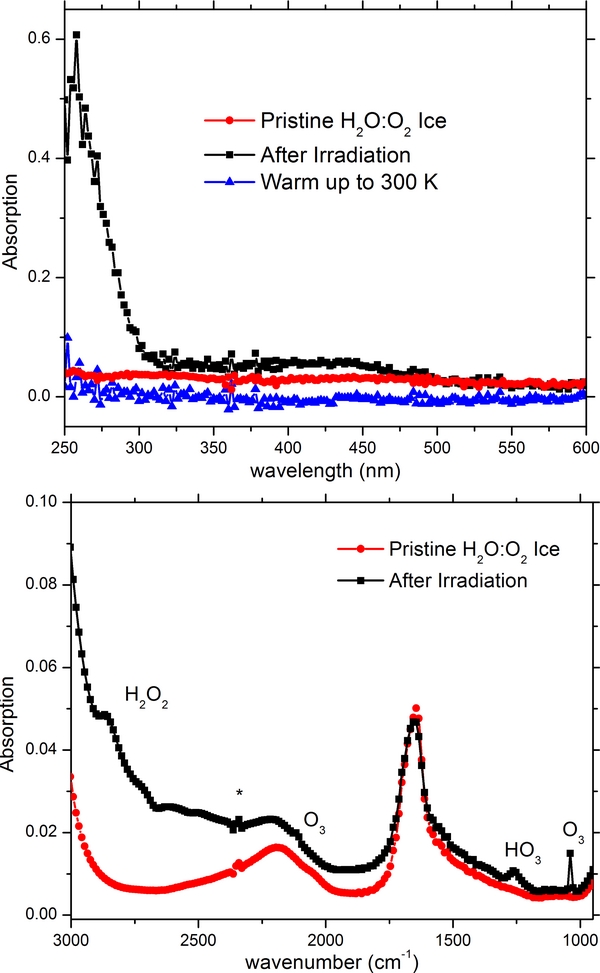
Energetic processing of pure water ice is well known not to produce appreciable quantities of ozone, see for example Zheng et al. (2006) and references therein. However, there are key astrophysical environments where molecular oxygen can be mixed with amorphous water ice. These environments include the icy mantles of grains in the interstellar medium, the icy moons of the Gas Giants and the many icy bodies of the outer solar system (KBOs and Comets in the Oort cloud) as discussed previously within the introduction. In the top portion of Figure 6 we show the UV spectra of a 500 nm thick ice mixture of H2O:O2 as deposited at 5.5 K, and after being irradiated with a total fluence of 2.0 × 10¹⁵ electrons cm−2 with clear evidence on the production of O3; in addition to a very broad insipid feature continued up through approximately 500 nm. Also displayed in Figure 6 is the spectrum obtained after warming up to 300 K, shown here to negate any features possibly influenced by changes in the spectral baseline. In the bottom portion of Figure 6 we show the IR spectra of the same sample as deposited at 5.5 K and after being irradiated with 2.0 × 10¹⁵ electrons cm−2. Peak labeled (*) indicates an impurity of CO2 most likely from the previous days experiment. This ice composition has been studied extensively prior (Cooper et al. 2006; Moore & Hudson 2000; Zheng et al. 2007); however, we did not observe the HO2 radical at 1142 cm−1 contrarily to what was previously reported after proton bombardment (Cooper et al. 2006, 2008). A comparison of the ozone bands produced after the electron bombardment of O2, CO2 and H2O:O2 is shown in Figure 7. The bands are quite similar although the spectrum of the mixture exhibits a slight increase in absorption toward longer wavelengths. In any case none of the features observed in the UV absorption spectra of the irradiated ices can reproduce the whole spectrum observed for Ganymede.
Figure 6. UV spectra (top) of a 500 nm thick mixture H2O:O2 as deposited at 5.5 K and after 5 keV electron irradiation with a total fluence of 2 × 10¹⁵ electrons cm−2 and after warm up to 300 K. IR spectra (bottom) of the same H2O:O2 ice mixture as deposited at 5.5 K and post irradiation. Download figure: Figure 7. Comparison of the ozone bands produced by electron bombardment of O2, CO2, and H2O:O2. Download figure:

The sublimation profiles are shown in Figure 8 where the radiolytic products (O3 and H2O2) are clearly isolated in the water matrix as both the integrated QMS sublimation profiles and normalized IR band areas for the identified species, show a distinct onset, yet clear signal throughout the continual sublimation of water. From this figure, we can see a sharp decrease in band intensity for ozone correlated with the sublimation of molecular oxygen at ∼35 K followed with gradual decline starting at ∼75 K, indicating a slow diffusion process of ozone through the parent water ice matrix. Conversely, hydrogen peroxide reveals a drastic increase possibly indicating trapped OH radicals further reacting followed with a sharp decrease correlated with the sublimation of water at 160 K.
Figure 8. QMS sublimation profiles (top) for H2O, O2, O3, and H2O2 along with normalized IR band areas (bottom) corresponding to the sublimation of O3 and H2O2. Download figure:

3.4. Mixtures – 1H2O:5CO2
In Figure 9 (top) we show the UV spectra of a 500 nm thick mixture 1H2O:5CO2 as deposited at 5.5 K and after being irradiated with 1 × 10¹⁵ and 6 × 10¹⁵ (5 keV electrons cm−2). We do not observe any absorption features associated with the Hartley ozone band. Instead, a broad UV absorption extending from 320 nm that progressively increases at the shorter wavelengths is witnessed. A similar continuum has been detected on many icy moons as discussed in detail in the next section. The lack of O3 formation is confirmed by the IR spectra, i.e., no features attributable to ozone appear as shown in the bottom of Figure 9. The products CO, CO3, and H2CO3 are easily identified and in agreement with previous studies (Boduch et al. 2011; Gerakines et al. 2000; Peeters et al. 2010; Pilling et al. 2010; Strazzulla et al. 2005; Zheng & Kaiser 2007). Sublimation profiles of the products (CO and CO3) derived from integration of their respective IR bands are shown as a function temperature in Figure 10. Here it is obvious that some CO and CO3 remains trapped until CO2 completes the sublimation process as observed in the irradiation of pure carbon dioxide ice. Additionally shown in Figure 10 are the integrated QMS sublimation profiles for masses corresponding to H2O, CO2, CO, CO3, and H2CO3. Once again there is no observable signal for gas phase CO3. A clear onset for mass 28 (CO) is seen around 50 K in agreement with the IR spectral data. Carbonic acid sublimation profile, both from the band at 1300 cm−1 and gas phase QMS detection, show that H2CO3 is gone at 255 K (Figure 11), in agreement with previous results (Zheng & Kaiser 2007). Additionally, a decrease of carbon trioxide (CO3) and carbon monoxide (CO) is witnessed immediately upon heating in agreement with previous experimental observation (Bennett et al. 2004). Here, two possibilities may explain the decrease for these molecules. First, as pointed out by (Bennett et al. 2004) carbon trioxide was not stable at 10 K and can decompose or may further react here with trapped hydrogen atoms yielding carbonic acid. Secondly, CO and CO3 are formed in the top bulk layers of the parent ice which can sublimated at a much lower temperature than the substrate bound material (Burke & Brown 2010; Woodruff & Delchar 1986) thereby causing a slight decrease.
Figure 9. UV spectra (top) of a 500 nm thick mixture 1 H2O:5CO2 as deposited at 5.5 K and after 5 keV electron irradiation with a fluence of 1 and 6 × 10¹⁵ electrons cm−2 along with a spectrum of Europa taken from Hendrix & Johnson (2009) for comparison. IR spectra (bottom) of the same H2O:5CO2 ice mixture as deposited at 5.5 K (red) and post irradiation (black). Download figure: Figure 10. QMS sublimation profiles (top) for H2O, CO2, CO, and H2CO3 with normalized IR band areas as a function of temperature (bottom) for bands of CO and CO3. Download figure: Figure 11. Sublimation profiles for carbonic acid (H2CO3) with typical electron impact mass fragments showing carbonic acid to be completely evolved into the gas phase at 260 K. Download figure:


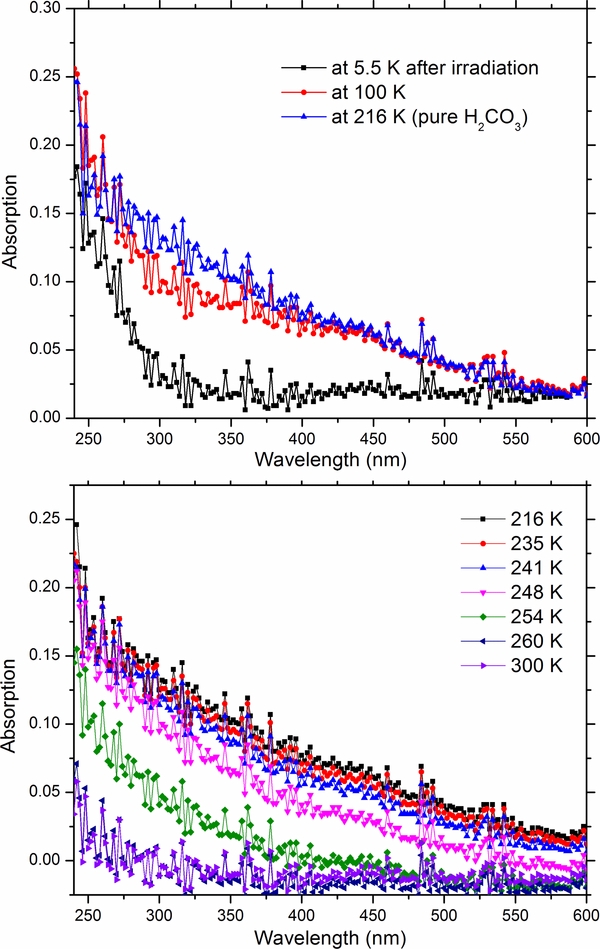
In a further experiment, the temperature of the irradiated H2O:5CO2 mixtures was increased to 210 K, allowing the parent water–carbon dioxide ice matrix to sublimate, thereby isolating carbonic acid (H2CO3), upon which the UV absorption spectrum was collected as shown in Figure 12. Here, pure frozen carbonic acid exhibits a linear increase in absorption was a function of wavelength in the spectral range of 240–600 nm. To verify that such absorption is real the sample was warmed up to 300 K allowing the sublimation of the synthesized carbonic acid. In the bottom of Figure 12 we can see that after the sublimation of the sample, the UV spectrum does not exhibit any anomalies; thereby supporting the interpretation of the results i.e., the spectral features are correlated with carbonic acid and not due to an experimental artifact.
Figure 12. UV spectra (top) of a 500 nm thick H2O:5CO2 ice mixture after being irradiated with 6 × 10¹⁵ electrons cm−2 at 5.5 K and after warm up to 100 and 216 K. Upon warm and sublimation of the parent ice, the UV-Vis spectra becomes red shifted. Download figure:
4. DISCUSSION AND CONCLUSION
Molecular oxygen, ozone, carbon and sulfur dioxide, predominantly within water ice matrices, have been detected, along with daughter species and non-ice materials, on the numerous satellites of Saturn and Jupiter (Brown et al. 2006; Cruikshank et al. 2010; Showman & Malhotra 1999) as well on comets (James et al. 2011; Reach et al. 2013) and icy grain mantles within cold molecular clouds (Gibb et al. 2000, 2004; Öberg et al. 2011). The surfaces of these icy bodies are continuously bombarded with charged particles entrapped in planetary magnetospheres, galactic cosmic radiation, and solar wind particles. As shown in the experiments presented here, the induced chemical modifications of these analogous astrophysical ice compositions are expected to be initiated in these low temperature environments upon exposure to ionizing radiation. Specifically we collected the UV-Vis spectra of several key ice compositions relevant to the icy satellites of the gas giants and to icy mantles of interstellar grains having undergone exposure to ionizing radiation in the form of 5 keV electrons.
The main intent of this study was to contribute to the identification of spectral features (absorption bands and/or spectral slopes) that maybe correlated to that observed on several icy moons in the outer solar system as well as the physical-chemical evolution leading to their formation upon exposure to ionizing radiation. A recent review of the ultraviolet observations of planetary ices well outlines the needs for such studies (Hendrix et al. 2013). In particular the observations of the Jovian moons: Europa, Ganymede, and Callisto, indicate that one common characteristic is a wavelength dependent continuum absorption between 320 and 200 nm (Hendrix et al. 2011a; Hendrix & Johnson 2008a, 2008b). Such a continuum absorption exhibits different slopes in different regions of the same satellite. Although there is currently no clear identification, it has been suggested to be a result of carbon bearing species (carbon dioxide, carbonates and carbon chains) leading to a carbon cycle; possibly driven by energetic processing (Hendrix & Johnson 2008a, 2008b); of particular relevance to Callisto as CO2 has been observed frozen both on the surface and in the atmosphere (Carlson 1999). In addition to the spectrally red continuum, two features have been observed: the ozone band on Ganymede as discussed along this paper, and a feature centered at 280 nm observed on the Europa (Domingue & Lane 1998; Hendrix et al. 2011b; Ockert et al. 1987) and possibly Callisto (Hendrix & Johnson 2008a, 2008b; Hibbitts et al. 2000), attributed to sulfur dioxide created via sulfur ions from Io's magnetosphere implanting into the ice surfaces of these moons. Some of the Saturnian moons have also exhibited spectral signatures of ozone as well, such as Dione, Rhea (Noll et al. 1997), and Tethys (Hendrix et al. 2013); however, ozone is apparently absent on Enceladus, perhaps due to the relatively young age of the ice on that moon. The Saturnian moons also exhibit the presence of UV absorbing materials such as trace amounts of ammonia and organic tholin materials (Hendrix et al. 2010; Zastrow et al. 2012). In addition, CO2 and O2 have been detected on the surface and in the exosphere around Rhea and Dione (Teolis et al. 2010; Teolis & Waite 2012).
Carbon dioxide ices have also been detected on the moons of Uranus (Ariel, Umbriel and Titania; Grundy et al. 2006) with their surface distribution being consistent with an origin due to synthesis by radiolysis at the interface of water ice with some carbonaceous organic solid material as suggested by laboratory experiments (Gomis & Strazzulla 2005). Ultraviolet spectra for Ariel, Titania, and Oberon have displayed evidence for the presence of a UV absorber in the ∼220–480 nm region along with a broad maximum located at about 280 nm; this last feature is similar in position to those identified with SO2 on Europa and Callisto. As there is no apparent source of sulfur bearing species in the Uranian system, hydroxyl (OH) radicals were suggested as a plausible carrier behind the absorption near 280 nm produced from the photolysis and radiolysis of H2O. However, this has never been confirmed by previous experimental investigations, nor have we seen any evidence of UV absorption due to OH radicals in the current study.
In detail, we have investigated possible physical-chemical explanation pertaining to the unidentified band within the shoulder of Ganymede's UV-Vis reflection spectrum which has so far been unexplained since ozone was first identified as the major carrier. Ozone was observed in all compositions save for the water–carbon dioxide mixture, in agreement with the plethora of previous experimental investigations as noted above. As shown in Figure 7, ozone surrounded with molecular oxygen, carbon dioxide, or water matrices as well as pure ozone, cannot explain the shoulder observed in Ganymede's spectrum. As suggested over a decade ago, the UV absorbance owing to molecules containing an aldehyde functional group (–C(O)H) overlap with the missing feature (Johnson 2001). The apparent fit, in conjunction with the observation that CO2 has been identified on the surface of Ganymede may suggest that aldehydes (resulting from the energetic processing of the water–carbon dioxide icy regolith) may explain the shoulder. We chose to pursue this possibility by irradiating a water carbon dioxide mixture. Our results indicate that aldehydes are not a reasonable explanation for the following reasons. First, no vibrational modes correlated with any aldehyde functional groups were observed within the IR spectra in agreement with previous studies. Furthermore, we did not observe any fragmentation patterns typical of aldehydes (CHO+ m/z = 29 amu) upon warm up in the gas phase via QMS residual gas analyzer. Second, typical cross sections (gas phase) for aliphatic aldehydes (even halogenated aldehydes) are on the order of 10−20 cm2 molecule−1 compared with the ozone Hartley band and 10−17 cm2 molecule−1 (Keller-Rudek & Moortgat 2013). Given the relative similarity in observed intensities, this would imply that aldehyde concentrations to be 1000 times that of ozone, which is highly unlikely considering that the majority of laboratory measurements thus far have not identified aldehydes in an irradiated H2O:CO2 ice mixture, please note the exceptions of the 1.5 MeV alpha particle irradiated H2O:CO2 ice (Pirronello et al. 1982) and the tentative identification of formaldehyde in the 52 MeV 58Ni13+ irradiated H2O:CO2 ice (Pilling et al. 2010). Finally, the UV-Vis spectrum of an irradiated H2O:CO2 ice did not exhibit a distinct absorption band near the unexplained 300 nm shoulder of Ganymede. Due to the extreme instability of carbonic acid, there are unfortunately no available UV-Vis spectral data for comparison. We may, however, comment on the general features.
Typically carboxylic acids have peak absorption near 200 nm attributed to the n → π* electronic transition of the C=O (Hintze et al. 2001; Limão-Vieira et al. 2006; Pretsch et al. 2000; Singleton et al. 1987). Unfortunately for our experimental setup, the signal was indistinguishable from noise below 240 nm, attributed to the low flux of the xenon light source within the spectrophotometer. Thus, we may only discern the tail of the main absorption feature giving rise to the somewhat surprising linear feature, shown in Figure 12. Furthermore, upon sublimation of water and carbon dioxide, this feature appears to extend toward longer wavelengths and is most likely due to the intermolecular interactions with pure condensed carbonic acid, causing a general red shift in the absorption baseline as was seen in the case of pure ozone (Vaida et al. 1989). This behavior may also explain the apparent increase in absorption at longer wavelengths as well for ozone when compared to the matrix isolated ozone and that of pure ozone as shown in Figure 3. In short, we may simply be missing the actual peak absorption of carbonic acid and are simply glimpsing the tail end. As such, future experiments investigating the absorption spectrum of carbonic acid deeper into the UV (<240 nm) would still prove useful to the scientific community. Regardless, carbonic acid, one of the main radiolytic products of a water–carbon dioxide mixture, cannot explain the unidentified band at 300 nm of Ganymede's UV spectra.
Of the greatest interest within this study, is the finding that electron bombardment of mixtures of H2O:CO2 causes the appearance of a "red" slope in the 320–200 nm continuum (absorption increases as wavelength decreases). In Figure 9 we compare, in absorbance units, the continuum observed for a particular region of Europa (16N, 208W; Hendrix & Johnson 2009) with that obtained after electron bombardment of a mixture water and carbon dioxide. This continuum feature is common among the icy moons varying in "redness" from moon to moon and from a region to region. However, the slope seems to generally correlate with the flux of energetic ions and electrons (Hendrix et al. 2011b) and here we show that the presence of carbon dioxide could contribute to its formation.
The results here present are then relevant to a better understanding of the so called "carbon cycle" in which the carbon-bearing species, elemental (amorphous carbon), carbonates, and carbon chains are continuously altered by energetic processes. Carbon dioxide has been suggested to be produced by radiolytic processes induced at the interface between water ice and solid carbon (Gomis & Strazzulla 2005), possibly delivered as carbonaceous grains from micrometeorite bombardment. Once formed, carbon dioxide is then mixed with water ice where upon energetic processes induce the formation of carbonic acid as demonstrated by previous experiments (Boduch et al. 2011; Gerakines et al. 2000; Peeterset al. 2010; Pilling et al. 2010; Zheng & Kaiser 2007). Irradiated mixtures present a "red" continuum in the UV that, as here firstly demonstrated, well mimic the astronomical observations. Further, CO2 will segregate as demonstrated in previous laboratory experiments (Palumbo & Baratta 2000). Consequently, patches of pure carbon dioxide are formed and irradiated allowing for the production of ozone and trapping of the volatile O2 within the CO2 matrix. When lastly carbon dioxide sublimates it will contribute to the existence of the tenuous atmospheres of O2 and CO2 observed at Callisto, Dione and Rhea. Oxygen within these solar system environments is mostly considered to be produced by the radiolytic processing of water ice (Teolis et al. 2006), although we suggest that in particular circumstances a contribution from carbon dioxide irradiation and subsequent sublimation is also relevant as the presence of CO2 in the atmospheres resulting from ion sputtering can be ruled out from recent experimental findings (Raut & Baragiola 2013).
In summary, the results of the present experiments have shown that:
- 1.O2. Oxygen has been used as a test to confirm the production of O3 and subsequent detection with UV-Vis spectroscopy. In addition, we have been able collect a UV-Vis spectrum of pure, isolated ozone and consequently have excluded that patches of pure ozone can reproduce the astronomical feature observed on Ganymede.
- 2.H2O:O2. The results obtained after electron bombardment confirm the findings obtained after ion irradiation (Teolis et al. 2006); ozone is produced but the shape of the UV absorption band of within this ice cannot reproduce the observed feature of Ganymede as well.
- 3.H2O:CO2. Ozone is not formed but a spectrally "red" UV continuum is observed and appears to reproduce well what is observed in a large number of icy moons. We believe that energetic processing of this kind of mixtures can explain the appearance of the feature. However, we recognize the possibility of other materials contributing as well and thus more experiments (and observation) are necessary in order to establish the nature of the feature and its relationship with the energetic processing.
- 4.CO2. Patches of pure, segregated, CO2 should exist. We demonstrated that O2 and other volatiles formed upon electron bombardment, can be trapped and sublimate with the bulk of CO2 thus contributing to the subsistence of the tenuous atmospheres observed in some icy moons.
B.M.J. and R.I.K. would like to thank the W. M. Keck Foundation and The University of Hawaii at Manoa for their generous financial support (80%). G.S. would like to acknowledge support from the National Aeronautics and Space Administration through the NASA Astrobiology Institute (20%; Cooperative Agreement No. NNA09DA77A issued through the Office of Space Science).