


ABSTRACT
We report the latest Planet Hunter results, including PH2 b, a Jupiter-size (RPL = 10.12 ± 0.56 R⊕) planet orbiting in the habitable zone of a solar-type star. PH2 b was elevated from candidate status when a series of false-positive tests yielded a 99.9% confidence level that transit events detected around the star KIC 12735740 had a planetary origin. Planet Hunter volunteers have also discovered 42 new planet candidates in the Kepler public archive data, of which 33 have at least 3 transits recorded. Most of these transit candidates have orbital periods longer than 100 days and 20 are potentially located in the habitable zones of their host stars. Nine candidates were detected with only two transit events and the prospective periods are longer than 400 days. The photometric models suggest that these objects have radii that range between those of Neptune and Jupiter. These detections nearly double the number of gas-giant planet candidates orbiting at habitable-zone distances. We conducted spectroscopic observations for nine of the brighter targets to improve the stellar parameters and we obtained adaptive optics imaging for four of the stars to search for blended background or foreground stars that could confuse our photometric modeling. We present an iterative analysis method to derive the stellar and planet properties and uncertainties by combining the available spectroscopic parameters, stellar evolution models, and transiting light curve parameters, weighted by the measurement errors. Planet Hunters is a citizen science project that crowd sources the assessment of NASA Kepler light curves. The discovery of these 43 planet candidates demonstrates the success of citizen scientists at identifying planet candidates, even in longer period orbits with only two or three transit events.
1. INTRODUCTION
The past two decades have ushered in a new subfield of astronomy with the discovery of exoplanets. More than 800 exoplanets have been detected as of 2012 October (Wright et al. 2011; Schneider et al. 2011). The majority of known exoplanets have been discovered by one of two methods: the Doppler (radial velocity, RV) technique or photometric transit measurements. The combination of these two methods is particularly powerful since it yields both planet mass and radius, which cannot be obtained using either of the methods alone. This information helps to reveal the planet composition and structure (Madhusudhan et al. 2012; Fortney & Nettelmann 2010) and provides insight about planet formation and evolution (Carter-Bond et al. 2012; Boué et al. 2012; Rice et al. 2012).
The NASA Kepler spacecraft was launched on 2009 March 7. The mission is monitoring ∼160,000 stars with a relative photometric precision of ∼20 ppm in 6.5 hr for Kp = 12 mag stars to search for exoplanets (Koch et al. 2010). More than 2300 planet candidates have been announced by analyzing the first 16 months of Kepler data (Batalha et al. 2012). By most estimates, the fraction of actual planets among the planet candidates is greater than 90% (Lissauer et al. 2012; Morton & Johnson 2011). Most of the Kepler planet candidates have radii that are comparable to or smaller than that of Neptune (Borucki et al. 2011; Batalha et al. 2012). If the planet masses are also comparable to that of Neptune, the induced stellar velocity amplitudes will be small, presenting an observational challenge for Doppler follow up to measure the planet mass. As a result, only ∼1%–2% of Kepler planet candidates have been confirmed by RV measurements. In some rare cases, transit timing variations (TTVs) of multi-planet systems have been modeled to confirm the planetary status of Kepler candidates (Holman et al. 2010; Lissauer et al. 2011; Ford et al. 2012). Recently, statistical analysis has been used to estimate false-positive probabilities for whether a transiting object is planetary in nature; for very high confidence levels, candidates have been promoted to bona fide planet status (Fressin et al. 2013).
The Kepler team uses a wavelet-based algorithm called transit planet search (TPS) (Jenkins et al. 2002, 2010; Tenenbaum et al. 2013) to detect transits of exoplanets. Transit-like signals with a detection significance greater than 7.1σ and at least three transits are visually examined by the Kepler team in order to confirm or reject spurious results. While the algorithms are effective and efficient, a small fraction of planet candidates can slip past the TPS algorithm. In principle, human observers could also detect many of the transit events; however, the sheer number of light curves is daunting. There are currently more than two million quarter-year light curves for the 160,000 stars in the Kepler field.
The Planet Hunters project11 is one of the Zooniverse projects12 (Lintott et al. 2008, 2011; Fortson et al. 2012) and was launched on 2010 December 16 to search for transiting planets in the first quarter of Kepler public archive data (Fischer et al. 2012). As of 2012 November, 13 quarters of data have been released by the Kepler mission into a public archive hosted by the Mikulski Archive for Space Telescopes13 at the Space Telescope Science Institute and by the NASA Exoplanet Archive.14 These data are being processed on the Planet Hunters Website and the collective efforts of more than 200,000 volunteers around the globe have contributed ∼100 man-years to the visual inspection of Kepler light curves.
In this paper, we present an update of the research progress by the Planet Hunters participants: 43 new planet candidates have been discovered, including 40 candidates with periods longer than 100 days. One of these objects has a planet confidence level of 99.92%, high enough to be considered a confirmed planet; we identify this object as PH2 b. At least three transits have been detected for 34 of the candidates. For nine planet candidates, only two transits were found in the light curves and a watch list has been established with the predicted time for expected future transit events. Twenty of the candidates are potentially in the habitable zone and model fits of the light curves suggest that their radii range from a few to more than 10 times the radius of the Earth (a Neptune to Jupiter range of radii). We obtained follow-up observations for nine of the brighter stars including spectra from Keck HIRES (Vogt et al. 1994) to improve the stellar parameters and we obtained high spatial resolution imaging of four host stars using Keck NIRC2 adaptive optics (AO; Wizinowich et al. 2000a).
We briefly introduce the Planet Hunters project in Section 2 and describe our false-positive tests in Section 3, follow-up spectroscopy in Section 4, and orbit modeling in Section 5. In Section 6, we discuss the discovery of 43 new planet candidates, including a Jupiter-size planet orbiting in the habitable zone of its host star and new multi-planet systems. We discuss the overlap between these candidates and the threshold crossing events (TCEs) identified by Tenenbaum et al. (2013) in Section 7.
2. PLANET HUNTERS: A CITIZEN SCIENCE PARTNERSHIP
Over the past two years, Planet Hunters have identified hundreds of planet candidates that were also found by the Kepler TPS algorithms. Because those detections had already been announced by the Kepler team, we did not publish independent detections. However, a few unique systems were identified that had been overlooked by the Kepler automatic detection and validation pipeline. Fischer et al. (2012) reported two planet candidates, KIC 10905746 b and KIC 6185331 b. Lintott et al. (2013) announced KIC 4552729 b, which shows evidence of TTVs, and KIC 10005758 c, which is a second candidate around the host star of another Kepler-detected planet candidate, KIC 10005758 b (Batalha et al. 2012). Schwamb et al. (2013) discovered PH1 b, a confirmed circumbinary planet in a ∼137 day orbit around an eclipsing binary (EB) in a quadruple stellar system. Schwamb et al. (2012) carried out a systematic analysis and showed that participants on the Planet Hunter site are most effective at detecting transiting planet candidates with radii larger than four Earth radii; smaller planets tend to be lost in the noise and are best retrieved with mathematical algorithms.
For each star in a Kepler observation quarter, the light curve is cut into three equal pieces with a five-day overlap at the ends. These ∼30 day light curves are presented to participants for identifying possible planet candidates. Currently, data from Q1, Q2, Q3, Q4, Q5, and Q7 have been uploaded and screened. The inspections are randomly distributed among all stars with approximately 10 people viewing each light curve in Q1 and five people viewing each light curve in Q2, Q3, Q4, Q5, and Q7. Transit identifications by Planet Hunter volunteers are extracted from the database by weighting the results from multiple participants (Schwamb et al. 2012) and are then inspected by the science team. We used Q1, Q2, Q3, Q4, Q5, and Q7 to discover the candidates. After identification of planet candidates, we used the Q1–Q13 data to derive orbital and stellar parameters for these systems.
Another effective tool for identifying candidates is the object-orientated discussion, Talk,15 which is integrated into the Planet Hunters classification interface. Talk is designed to enable discussion among Planet Hunters volunteers and to facilitate volunteer-led analysis of interesting light curves that can then be easily brought to the attention of the science team. Forum-style message boards are hosted on Talk where each ∼30 day light curve presented on the main Planet Hunters classification interface has a dedicated page. Volunteers can write comments, add searchable Twitter-like hash tags, create longer side discussions, and group similar light curves together in collections. Inside of Talk, Planet Hunters volunteers can examine all of the additional light curve data (not just the 30 day segment) available for interesting targets.
For Planet Hunters who opt to use Talk after classifying a light curve, there is significant expertise available from a core of dedicated volunteers. Co-authors Kian Jek, Abe J. Hoekstra, Thomas Lee Jacobs, Daryll LaCourse, and Hans Martin Schwengeler have led an effort to collect transit candidates and carry out transit modeling and initial vetting for false positives. Their vetted lists contained the 43 candidates presented in this paper.
3. VETTING THE TRANSIT CANDIDATES: FALSE-POSITIVE TESTS
After transit candidates are detected by volunteers, the science team carries out an extensive effort to eliminate false positives that can occur from background blends or on-source grazing and eclipsing binaries (Batalha et al. 2010; Prša et al. 2011; Rowe et al. 2010). A number of techniques have been developed to identify these interlopers (Torres et al. 2011). As a first step, we reject light curves that have a V-shape, suggesting an EB star. We examined all of the prospective transit curves for changing transit depths that can occur when a nearby star contributes a variable amount of flux to EBs. Often, the background variability is quarter-dependent, changing as the instrumental point-spread function (PSF) varies. Another clear sign of an EB star is variation in the transit depth for even and odd transits or a strong signal during secondary eclipse. In addition to these checks, we developed code to check for pixel centroid offsets during the time of the prospective transit that are diagnostic of an off-target source. Although we were limited in our follow-up efforts by the availability of telescope time (for both spectroscopic and AO observations), we obtained follow-up observations for nine of our transit candidates.
3.1. Pixel Centroid Offset Analysis
The Kepler light curve files contain information on both the position of the star at a given time (flux-weighted centroids, called MOM_CENTR1 and MOM_CENTR2) and the predicted position the star should be in based on the position of reference stars (called POS_CORR1 and POS_CORR2). By subtracting one quantity from the other, we can find how much the position of the star differs from its predicted position. We measured the flux difference during the prospective transit and immediately after transit to search for centroid shifts. If the transit occurs on a star other than the target star, the centroid position should move in a direction away from that star by an amount proportional to the transit depth (Bryson et al. 2013). The magnitude of the shift can be used to calculate how far away this source is from the target. Table 1 reports the pixel centroid offset significance: the ratio of the pixel centroid offset and the measurement error. Even if no obvious shift is seen, we can still calculate a confusion region around the star. In our false-positive analysis, we use the 3σ confusion radius as the outer limit on the separation between the target and a false-positive source.
Table 1. Orbital Parameters
| Star | T0 | Period | Impact | RPL/R* | e | ω | RPL | Inclination | a/R* | a | TPL | Depth | Dur | Sig |
|---|---|---|---|---|---|---|---|---|---|---|---|---|---|---|
| (KIC) | (MJD) | (d) | Parameter | (radians) | (R⊕) | () | (AU) | (K) | (ppm) | (hr) | (σ) | |||
| 2581316 | 55071.3190 | 217.8320 ± 0.0063 | 20.31 ± 1.86 | 0.772 ± 0.067 | 459 ± 18 | 9224 ± 82 | 21.4 | 1.2 | ||||||
| 2975770 | 55130.8673 | 369.0771 ± 0.0081 | 2.61 ± 3.03 | 0.961 ± 0.082 | 205 ± 40 | 1302 ± 300 | 6.0 | 0.1 | ||||||
| 3326377 | 54989.0207 | 198.7133 ± 0.0012 | 2.97 ± 0.23 | 0.584 ± 0.016 | 240 ± 13 | 2209 ± 312 | 8.2 | 0.6 | ||||||
| 3634051 | 55192.5939 | 453.5264 ± 0.0699 | 7.36 ± 2.58 | 1.205 ± 0.082 | 353 ± 63 | 898 ± 162 | 18.6 | 0.3 | ||||||
| 3663173 | 55191.6724 | 174.6258 ± 0.0077 | 9.53 ± 2.87 | 0.640 ± 0.036 | 466 ± 50 | 2928 ± 965 | 15.7 | 1.2 | ||||||
| 3732035 | 54986.4187 | 138.9450 ± 0.0256 | 4.14 ± 1.71 | 0.541 ± 0.034 | 490 ± 89 | 523 ± 230 | 11.9 | 0.6 | ||||||
| 4142847 | 55133.2200 | 210.6358 ± 0.0013 | 2.85 ± 0.41 | 0.613 ± +0.023 | 226 ± 25 | 2048 ± 653 | 8.4 | 0.3 | ||||||
| 4472818 | 55086.1529 | 70.9663 ± 0.0213 | 3.18 ± 0.32 | 0.345 ± 0.008 | 506 ± 30 | 803 ± 131 | 7.0 | 0.7 | ||||||
| 4760478† | 55468.6953 | 574.8105 ± 0.0094 | 12.80 ± 2.41 | 1.413 ± 0.074 | 272 ± 21 | 4830 ± 719 | 20.0 | 1.5 | ||||||
| 4820550 | 55124.5479 | 202.1175 ± 0.0009 | 5.13 ± 0.32 | 0.678 ± 0.007 | 274 ± 7 | 2801 ± 200 | 4.6 | 1.0 | ||||||
| 4902202 | 55224.3199 | 216.4667 ± 0.0057 | 2.89 ± 2.23 | 0.673 ± 0.034 | 259 ± 47 | 1319 ± 705 | 10.4 | 0.2 | ||||||
| 4947556 | 55022.7737 | 141.6091 ± 0.0045 | 2.60 ± 0.08 | 0.512 ± 0.006 | 277 ± 6 | 1306 ± 195 | 6.9 | 0.2 | ||||||
| 5437945.01 | 55078.4788 | 220.1344 ± 0.0080 | 12.15 ± 1.95 | 0.748 ± 0.072 | 525 ± 64 | 1804 ± 153 | 20.7 | 1.6 | ||||||
| 5437945.02 | 54971.8491 | 440.7704 ± 0.0015 | 9.73 ± 3.22 | 1.18 ± 0.067 | 348 ± 64 | 2646 ± 159 | 21.8 | 1.7 | ||||||
| 5857656† | 55241.1260 | 626.0960 ± 0.0480 | 4.47 ± 2.09 | 0.933 ± 0.051 | 357 ± 68 | 637 ± 102 | 12.0 | 0.5 | ||||||
| 5871985 | 55313.8940 | 213.2582 ± 0.0043 | 2.39 ± 0.28 | 0.584 ± 0.018 | 201 ± 26 | 1968 ± 438 | 7.6 | 0.8 | ||||||
| 5966810 | 54966.4768 | 247.8919 ± 0.0041 | 6.81 ± 1.81 | 0.804 ± 0.051 | 440 ± 49 | 1144 ± 329 | 20.2 | 0.4 | ||||||
| 6106282 | 55048.0109 | 101.1144 ± 0.0012 | 2.04 ± 0.23 | 0.359 ± 0.013 | 236 ± 21 | 1065 ± 452 | 6.4 | 0.4 | ||||||
| 6878240 | 55066.1900 | 135.4985 ± 0.0124 | 8.46 ± 1.43 | 0.493 ± 0.021 | 326 ± 23 | 5935 ± 636 | 6.7 | 5.3 | ||||||
| 7826659 | 55111.6075 | 211.0387 ± 0.0011 | 3.18 ± 0.36 | 0.650 ± 0.014 | 231 ± 13 | 2009 ± 194 | 6.5 | 0.4 | ||||||
| 8012732 | 55224.1613 | 431.469 ± 0.257 | 15.12 ± 5.03 | 1.18 ± 0.06 | 386 ± 79 | 5513 ± 248 | 15.5 | 1.4 | ||||||
| 8210018 | 55226.3825 | 132.1730 ± 0.00315 | 2.88 ± 1.35 | 0.434 ± 0.029 | 285 ± 45 | 1277 ± 462 | 5.5 | 0.3 | ||||||
| 8636333† | 55104.3899 | 804.7057 ± 0.0107 | 6.67 ± 2.59 | 1.729 ± 0.095 | 243 ± 37 | 2396 ± 515 | 18.8 | 2.0 | ||||||
| 8827930 | 55207.3096 | 288.3082 ± 0.0074 | 6.84 ± 2.68 | 0.847 ± 0.033 | 218 ± 39 | 12711 ± 782 | 5.7 | 1.0 | ||||||
| 9025971 | 55512.4290 | 141.2412 ± 0.0006 | 9.59 ± 5.54 | 0.532 ± 0.025 | 306 ± 46 | 13712 ± 277 | 7.2 | 0.9 | ||||||
| 9147029 | 55251.2605 | 397.4995 ± 0.0043 | 4.65 ± 0.35 | 1.075 ± 0.012 | 244 ± 6 | 2755 ± 500 | 7.8 | 0.7 | ||||||
| 9166700 | 54967.4761 | 264.4510 ± 0.046 | 3.26 ± 1.19 | 0.829 ± 0.041 | 365 ± 63 | 499 ± 50 | 9.3 | 0.5 | ||||||
| 9413313† | 55318.1058 | 441.0176 ± 0.0036 | 8.66 ± 4.19 | 1.104 ± 0.069 | 228 ± 45 | 7435 ± 255 | 10.0 | 1.0 | ||||||
| 9425139 | 55126.5676 | 305.0620 ± 0.0900 | 12.25 ± 4.99 | 0.92 ± 0.07 | 330 ± 111 | 4007 ± 156 | 6.4 | 0.2 | ||||||
| 9480535 | 55035.9784 | 160.1288 ± 0.0076 | 7.44 ± 2.26 | 0.606 ± 0.033 | 469 ± 63 | 1266 ± 393 | 16.2 | 0.3 | ||||||
| 9663113† | 55138.9999 | 572.3753 ± 0.0141 | 10.93 ± 1.38 | 1.438 ± 0.117 | 332 ± 15 | 1790 ± 186 | 23.0 | 0.2 | ||||||
| 9886255 | 55120.5100 | 105.9561 ± 0.0041 | 5.92 ± 1.13 | 0.422 ± 0.016 | 363 ± 33 | 2601 ± 569 | 8.5 | 1.8 | ||||||
| 9958387 | 55029.4656 | 237.7886 ± 0.0053 | 8.78 ± 0.81 | 0.800 ± 0.033 | 402 ± 10 | 1671 ± 147 | 10.4 | 0.1 | ||||||
| 10024862† | 55192.1622 | 566.1537 ± 0.0047 | 7.51 ± 2.17 | 1.388 ± 0.079 | 305 ± 39 | 2051 ± 707 | 20.0 | 0.1 | ||||||
| 10360722 | 55071.2671 | 163.6915 ± 0.0078 | 5.56 ± 2.11 | 0.593 ± 0.038 | 358 ± 63 | 1319 ± 484 | 9.3 | 0.9 | ||||||
| 10525077† | 55167.7516 | 427.1250 ± 0.8830 | 18.57 ± 3.67 | 1.17 ± 0.13 | 473 ± 77 | 2803 ± 540 | 26.0 | 0.2 | ||||||
| 10850327† | 55302.8600 | 440.1651 ± 0.0500 | 4.27 ± 2.45 | 1.148 ± 0.063 | 302 ± 59 | 830 ± 114 | 11.7 | 1.4 | ||||||
| 11026582 | 55071.9925 | 240.5778 ± 0.0258 | 3.69 ± 1.13 | 0.768 ± 0.038 | 337 ± 43 | 970 ± 236 | 10.5 | 0.8 | ||||||
| 11253827.01 | 54995.0098 | 42.9910 ± 0.0186 | 2.63 ± 0.24 | 0.242 ± 0.005 | 492 ± 22 | 1078 ± 92 | 4.7 | 0.2 | ||||||
| 11253827.02 | 55103.6711 | 88.5164 ± 0.0095 | 4.42 ± 0.32 | 0.392 ± 0.006 | 389 ± 15 | 2681 ± 103 | 7.1 | 0.3 | ||||||
| 11392618 | 55006.7218 | 110.9232 ± 0.0234 | 2.78 ± 0.47 | 0.456 ± 0.005 | 419 ± 15 | 424 ± 89 | 5.9 | 1.5 | ||||||
| 11716643† | 55267.4826 | 466.0661 ± 0.0191 | 3.75 ± 1.87 | 1.162 ± 0.055 | 218 ± 38 | 2494 ± 320 | 10.3 | 0.6 | ||||||
| 12735740 | 55195.5709 | 282.5255 ± 0.0010 | 10.12 ± 0.56 | 0.828 ± 0.009 | 281 ± 7 | 9882 ± 126 | 10.5 | 0.6 |


Notes. Pixel centroid offset significance is listed for each planet candidate in the last column. Planet candidates with only two transits are marked with a †.
Pixelated flux time-series measurements are available from the target pixel files. These measurements provide another false-positive test. If flux changes take place outside the Kepler aperture, this fact is a strong indication that the observed flux change within the aperture is a result of contamination rather than a planet transit. We used the PyKE analysis tool (Still & Barclay 2012) for this analysis.
3.2. Transit Depth Variation and Secondary Eclipse Search
The light curve of an EB will show different transit depths if the two stars do not have identical radii. Thus, EB stars are likely to exhibit transit variations depending on whether the transiting body is the primary or secondary star. We therefore search for possible transit depth variations between odd and even numbered transits. No significant variations were detected in the light curves for the planet candidates presented here.
For many EBs, a secondary eclipse could also be detected since the stellar signal is so strong (compared to the secondary eclipse of a planet). We perform a secondary eclipse search using a phase-folded light curve with the stellar photometric variability removed. PyKE (Still & Barclay 2012) is used to flatten and fold the light curve in phase. We only find one eclipse detected at more than a 3σ level, which is for KIC 4760478 at a phase of 0.437 (assuming the primary transit takes place at the phase of 0) with a significance of 3.3σ. The depth of the secondary transit for KIC 4760478 is 2518 ± 758 ppm. Other than this detection, we do not detect any significant sign of a secondary eclipse signal, which is a necessary condition that implies a planetary origin of the transit.
3.3. Adaptive Optics Imaging
To help rule out false-positive scenarios, we acquired high spatial resolution images for four stars: KIC 4820550, KIC 4947556, KIC 9958387, and KIC 12735740 using NIRC2 (instrument PI: Keith Matthews) and the Keck II AO system (Wizinowich et al. 2000b). The AO images were obtained on UT 2012 October 21 with excellent seeing of less than 0.3 arcsec. Our observations consist of dithered frames obtained with the K filter. We used the narrow camera setting (10 mas pixel−1 plate scale) to provide fine spatial sampling of the instrument PSF. For each star, we acquired at least 90 s of on-source integration time. Complementary data taken with the J-filter helped to distinguish between speckles and off-axis sources in several cases.
The raw NIRC2 data were processed using standard techniques to replace hot pixels, flat-field the array, subtract thermal background radiation, and align and co-add frames. The primary star was not saturated in any individual images. We did not find any evidence for neighboring sources in either the raw or the processed data (Figure 1). Our diffraction-limited observations rule out the presence of companions and background sources as listed in Table 2 for several characteristic angular separations. The contrast is calculated by measuring the flux from scattered light relative to the stellar peak. Specifically, we calculate the standard deviation of the intensity inside a box of size 3 × 3 FWHM, where the full-width at half-maximum (FWHM) corresponds to the spatial scale of a speckle (≈45 mas). The results from each box are then azimuthally averaged to produce a radial profile. We nominally achieve (at least) 4 mag of contrast (10σ) at 0 5.
5.

Figure 1. AO images for KIC 4947556, KIC 4820550, KIC 9958387, and KIC 12735740. North is up and east is to the left. The horizontal bar is about 0.4 arcsec. A negative square root scale is used to show off-axis features. No additional sources were observed down to the magnitude limits listed in Table 2.
Download figure:
Standard image High-resolution imageTable 2. ΔK Magnitude AO Exclusion Limits
| Star Name | 0.25 | 0.50 | 1.00 | 1.50 | 2.00 | 2.50 |
|---|---|---|---|---|---|---|
| (KIC) | (arcsec) | (arcsec) | (arcsec) | (arcsec) | (arcsec) | (arcsec) |
| 4947556 | 2.48 | 4.17 | 4.91 | 4.84 | 4.85 | 4.79 |
| 4820550 | 2.87 | 3.96 | 4.15 | 4.12 | 4.09 | 4.10 |
| 9958387 | 4.67 | 5.62 | 5.56 | 5.57 | 5.62 | 5.54 |
| 12735740 | 4.91 | 6.32 | 6.72 | 6.73 | 6.68 | 6.63 |
Download table as: ASCIITypeset image
4. STELLAR PROPERTIES
For most of the planet candidates, we adopted stellar parameters from the Kepler Input Catalog (KIC). According to Brown et al. (2011), stellar radii from the KIC have typical error bars of 0.2 dex, corresponding to a percentage error of 58%; typical error bars are 0.5 dex for log g and 200 K for Teff.
For one star, KIC 8012732, there were no available KIC parameters so we estimated the effective temperature for this star from the g − r color, using the color–temperature relations from Pinsonneault et al. (2012). We do not know the amount of reddening for this star and we found that adopting reddening values in the range 0.0–0.1 translates to a large uncertainty for Teff values, from 5536 K to 6517 K. We adopted an intermediate Teff of 6000 K with an error bar of 500 K. We also arbitrarily adopt a corresponding main sequence value for log g of 4.3 ± 0.5 and [Fe/H] of 0.0 ± 0.5.
4.1. Spectroscopic Analysis
We obtained spectra for nine relatively bright stars using Keck HIRES (Vogt et al. 1994) on UT 2012 October 7: KIC 2581316, KIC 4472818, KIC 4820550, KIC 4947556, KIC 9147029, KIC 9958387, KIC 11253827, KIC 11392618, and KIC 12735740. The spectra have a resolution of ∼55,000 with signal-to-noise ratios typically greater than ∼50 at around 5160 Å. We used Spectroscopy Made Easy (SME; Valenti & Piskunov 1996; Valenti & Fischer 2005) to model our observed spectra and derive best-fit stellar parameters for Teff, log g, [Fe/H], [α/Fe], and vsin i. The parameter uncertainties were estimated by running a grid of models with different initial guesses for Teff and either using the standard deviation of the output model parameters or the error analysis of Valenti & Fischer (2005), whichever was larger. The SME results are summarized in Table 3. Figure 2 shows the comparison of log g, Teff, and [Fe/H] between the SME results and the KIC values. The results are generally in agreement within the reported error bars.

Figure 2. Comparison of log g, Teff, [Fe/H], and stellar radius between SME and the KIC values for nine stars with Keck HIRES spectra. The parameters are consistent with each other within the reported error bars. Stellar radii were inferred based on the Yonsei-Yale Isochrone interpreter (Demarque et al. 2004).
Download figure:
Standard image High-resolution imageTable 3. SME Results
| Star Name | Teff | log g | [Fe/H] | [α/Fe] | vsin i |
|---|---|---|---|---|---|
| (KIC) | (K) | (cgs) | (dex) | (dex) | (km s−1) |
| 2581316 | 6148 ± 132 | 4.170 ± 0.180 | 0.111 ± 0.090 | 0.033 ± 0.174 | 7.35 ± 1.50 |
| 4472818 | 5848 ± 88 | 4.480 ± 0.120 | 0.119 ± 0.060 | −0.035 ± 0.116 | 2.64 ± 1.44 |
| 4820550 | 5678 ± 50 | 4.686 ± 0.060 | 0.128 ± 0.033 | 0.021 ± 0.075 | 0.95 ± 0.95 |
| 4947556 | 5110 ± 88 | 4.800 ± 0.120 | 0.260 ± 0.060 | −0.113 ± 0.144 | 5.80 ± 1.00 |
| 9147029 | 5868 ± 64 | 4.551 ± 0.248 | 0.051 ± 0.049 | 0.090 ± 0.330 | 0.32 ± 0.50 |
| 9958387 | 6133 ± 44 | 4.078 ± 0.060 | 0.086 ± 0.030 | 0.034 ± 0.058 | 5.22 ± 0.53 |
| 11253827 | 5666 ± 88 | 4.594 ± 0.120 | 0.171 ± 0.070 | −0.022 ± 0.132 | 3.31 ± 1.00 |
| 11392618 | 5708 ± 65 | 4.288 ± 0.088 | 0.011 ± 0.039 | 0.094 ± 0.078 | 1.62 ± 1.04 |
| 12735740 | 5631 ± 44 | 4.418 ± 0.060 | −0.079 ± 0.030 | 0.020 ± 0.062 | 1.43 ± 0.78 |
Download table as: ASCIITypeset image
Although we have metallicity measurement precisions ranging from 0.03 to 0.09 dex for nine stars with SME analysis, given the median measurement uncertainty of ∼0.5 dex from the KIC for other host stars, no definitive conclusion can be made with regards to the correlation between planet occurrence and stellar metallicity.
4.2. Isochrone Interpolation
We used the KIC values or (when available) the output of SME as input for Yonsei-Yale Isochrone interpolation (Demarque et al. 2004) in order to infer stellar properties such as mass, radius, and luminosity. A total of 1000 Monte Carlo trials were run using input parameters (Teff, log g, [Fe/H], and [α/Fe]), randomly drawn from a Gaussian distribution scaled to the standard deviation of stellar parameter uncertainties. Stellar age and [α/Fe] are also required inputs for the isochrone interpolation. We included a wide stellar age range of 0.08–15 Gyr and a range in [α/Fe] of 0.0–0.5 for our Monte Carlo trials in order to explore a large parameter space. The lower right panel of Figure 2 shows the comparison between Yonsei-Yale model inferred stellar radii and those from the KIC. The stellar radii from these two sources are generally consistent with each other within the error bars. Stellar mass, radius, and luminosity were then inferred based on the mean and standard deviation of the outputs from the Yonsei-Yale Isochrone interpolation.
4.3. Chromospheric Activity and Photometric Activity
The Ca ii H and K core emission is commonly used as a diagnostic of chromospheric activity in stars (Gray & Nagar 1985; Gunn et al. 1998; Gizis et al. 2002; Isaacson & Fischer 2010) and this feature is included in the spectral format of our Keck HIRES observations. To account for different continuum flux levels near the Ca ii lines for stars of different spectral types, the core emission is often parameterized as , a logarithmic fraction of the flux in the H and K line cores to the photospheric contributions from the star. Chromospheric activity declines with stellar age (typically, subgiants show very low activity), so cluster stars of known ages have been used to calibrate to rotation periods and ages (Noyes et al. 1984). Because the Kepler field stars tend to be faint and the obtained spectra have low signal-to-noise ratios, our usual pipeline analysis of chromospheric activity often fails. Therefore, we used stars from the California Planet Search (CPS) programs as a comparison library. Matching with stars with similar effective temperatures, we carried out a visual inspection of the Ca ii H and K core emission to estimate for the set of nine stars with HIRES spectra. Figure 3 shows our Keck HIRES spectra centered on the Ca ii H lines (3968.5 Å) for the Sun and the nine stars observed at Keck.


Figure 3. Ca II H line (3968.5 Å) for the Sun and the nine stars with Keck spectra: KIC 2581316, KIC 4472818, KIC 4820550, KIC 4947556, KIC 9147029, KIC 9958387, KIC 11253827, KIC 11392618, and KIC 12735740. The Ca ii H and K lines are a diagnostic for chromospheric activity and are tied to stellar age.
Download figure:
Standard image High-resolution imageIn addition to chromospheric activity, we checked the photometric activity of the stars in our sample. The light curve of each quarter was normalized to its median and then stitched using PyKE (Still & Barclay 2012). The photometric variability is indicated by the ratio of the out-of-transit flux standard deviation and the median flux. The adopted stellar parameters and properties for all 43 stars are summarized in Table 4.
Table 4. Stellar Parameters
| Star | KIC Values | Derived Values | ||||||||||||||
|---|---|---|---|---|---|---|---|---|---|---|---|---|---|---|---|---|
| α | δ | Kp† | (g − r)† | Teff† | [Fe/H]† | log g† | Teff | log g | M* | R* | L* | ρ* | [Fe/H] | vsin i | δf/f | |
| (KIC) | (h m s) | (d m s) | (mag) | (mag) | (K) | (dex) | (cgs) | (K) | (cgs) | (M☉) | (R☉) | (L☉) | (g cm−3) | (dex) | (km s−1) | ( ⋅⋅⋅ ) |
| 2581316†† | 19 30 30.590 | +37 51 36.51 | 11.69 | 0.680 | ... | ... | ... | 0.19 ± 0.07 | 7.35(1.50) | 2.00e-04 | ||||||
| 2975770 | 19 10 57.014 | +38 06 52.42 | 14.52 | 0.951 | 4683 | 0.24 | 4.34 | 2.19 ± 7.27 | ... | 7.44e-03 | ||||||
| 3326377 | 19 06 13.939 | +38 24 19.33 | 14.44 | 0.703 | 4926 | −0.86 | 4.49 | 3.61 ± 0.80 | ... | 6.62e-03 | ||||||
| 3634051 | 19 11 54.110 | +38 44 25.01 | 13.44 | 0.478 | 5831 | −0.08 | 4.30 | 0.1 ± 0.2 | ... | 2.39e-04 | ||||||
| 3663173 | 19 42 40.594 | +38 47 45.02 | 15.91 | 0.525 | 6116 | 0.19 | 4.74 | 0.3 ± 0.2 | ... | 1.26e-03 | ||||||
| 3732035 | 19 06 27.288 | +38 53 31.09 | 14.21 | 0.464 | 5786 | −0.47 | 4.59 | 0.2 ± 0.2 | ... | 3.78e-04 | ||||||
| 4142847 | 19 09 12.677 | +39 17 22.88 | 15.20 | 0.823 | 4762 | −0.40 | 4.59 | 3.29 ± 1.13 | ... | 3.99e-03 | ||||||
| 4472818†† | 19 35 32.496 | +39 31 11.32 | 12.72 | 0.489 | 5650 | −0.35 | 4.37 | 0.97 ± 0.23 | 2.64(1.44) | 5.53e-03 | ||||||
| 4760478 | 19 41 43.044 | +39 53 11.54 | 15.76 | 0.646 | 5430 | −0.27 | 4.53 | 0.3 ± 0.2 | ... | 8.97e-04 | ||||||
| 4820550††, ††† | 19 07 05.146 | +39 59 01.75 | 13.92 | 0.535 | 5586 | −0.15 | 4.63 | 3.1 ± 0.4 | 0.95(0.95) | 3.53e-03 | ||||||
| 4902202 | 18 54 46.440 | +40 01 04.87 | 15.58 | 0.595 | 5412 | −0.52 | 4.49 | 2.12 ± 4.85 | ... | 9.52e-04 | ||||||
| 4947556††, ††† | 19 50 18.506 | +40 01 39.76 | 13.34 | 0.806 | 4907 | 0.22 | 4.51 | 3.0 ± 0.2 | 5.80(1.00) | 1.08e-02 | ||||||
| 5437945 | 19 13 53.962 | +40 39 04.90 | 13.77 | 0.410 | 6093 | −0.37 | 4.17 | 0.25 ± 0.26 | ... | 2.44e-04 | ||||||
| 5857656 | 18 58 38.453 | +41 06 32.18 | 12.84 | 0.429 | 5937 | −0.06 | 4.31 | 0.3 ± 0.5 | ... | 2.03e-04 | ||||||
| 5871985 | 19 21 30.315 | +41 09 02.66 | 15.17 | 1.058 | 4308 | −0.75 | 4.54 | 4.39 ± 1.27 | ... | 2.94e-03 | ||||||
| 5966810 | 19 35 16.390 | +41 12 41.26 | 14.95 | 0.414 | 6152 | −0.49 | 4.63 | 0.2 ± 0.2 | ... | 5.34e-04 | ||||||
| 6106282 | 19 01 23.988 | +41 27 07.96 | 15.13 | 1.368 | 3912 | −0.13 | 4.41 | 4.29 ± 1.42 | ... | 2.78e-03 | ||||||
| 6878240 | 19 43 34.586 | +42 22 49.62 | 16.00 | 0.733 | 5144 | −0.04 | 4.88 | 1.2 ± 0.6 | ... | 8.38e-04 | ||||||
| 7826659 | 19 33 11.606 | +43 33 21.13 | 13.86 | 0.969 | 4665 | 0.48 | 4.10 | 2.47 ± 0.42 | ... | 1.34e-03 | ||||||
| 8012732†††† | 18 58 55.079 | +43 51 51.18 | ... | 0.511 | ... | ... | ... | 0.25 ± 0.25 | ... | 3.09e-04 | ||||||
| 8210018 | 18 42 02.822 | +44 09 33.66 | 15.03 | 1.053 | 4337 | −0.72 | 4.74 | 3.41 ± 0.97 | ... | 2.07e-03 | ||||||
| 8636333 | 19 43 47.585 | +44 45 11.23 | 15.29 | 0.459 | 6034 | −0.30 | 4.66 | 0.6 ± 0.7 | ... | 6.40e-04 | ||||||
| 8827930 | 19 40 49.663 | +45 05 53.48 | 16.00 | 0.649 | 5581 | 0.29 | 4.72 | 5.4 ± 6.3 | ... | 9.05e-04 | ||||||
| 9025971 | 19 33 07.574 | +45 18 34.81 | 14.52 | 0.524 | 5702 | −0.08 | 4.71 | 2.6 ± 4.6 | ... | 4.81e-04 | ||||||
| 9147029†† | 19 13 44.594 | +45 31 11.46 | 15.31 | 0.437 | 6216 | 0.19 | 4.64 | 1.9 ± 0.2 | 0.32(0.50) | 5.64e-04 | ||||||
| 9166700 | 19 45 21.149 | +45 32 42.40 | 11.15 | 0.311 | 6307 | −0.11 | 4.00 | 0.6 ± 0.7 | ... | 1.79e-04 | ||||||
| 9413313 | 19 41 40.915 | +45 54 12.56 | 14.12 | 0.713 | 5165 | −0.01 | 4.26 | 1.2 ± 1.7 | ... | 7.92e-03 | ||||||
| 9425139 | 19 55 58.822 | +45 54 34.24 | 13.38 | 0.635 | 5321 | −0.09 | 4.26 | 0.27 ± 0.32 | ... | 2.50e-04 | ||||||
| 9480535 | 19 49 39.461 | +46 03 38.95 | 15.13 | 0.520 | 5825 | −0.27 | 4.52 | 0.2 ± 0.2 | ... | 4.86e-04 | ||||||
| 9663113 | 19 48 10.901 | +46 19 43.32 | 13.96 | 0.483 | 5827 | −0.29 | 4.42 | 0.1 ± 0.1 | ... | 2.43e-04 | ||||||
| 9886255 | 19 19 28.714 | +46 43 46.96 | 15.80 | 0.730 | 5137 | 0.01 | 4.83 | 1.1 ± 0.6 | ... | 1.85e-03 | ||||||
| 9958387††, ††† | 19 39 01.848 | +46 49 52.03 | 13.46 | 0.387 | 6159 | −0.26 | 4.36 | 0.32 ± 0.1 | 5.22(0.53) | 2.00e-04 | ||||||
| 10024862 | 19 47 12.602 | +46 56 04.42 | 15.88 | 0.434 | 6412 | 0.07 | 4.61 | 0.4 ± 0.4 | ... | 8.13e-04 | ||||||
| 10360722 | 19 55 35.702 | +47 27 47.12 | 15.03 | 0.725 | 5144 | −0.01 | 4.66 | 0.5 ± 0.5 | ... | 5.58e-04 | ||||||
| 10525077 | 19 09 30.737 | +47 46 16.28 | 15.36 | 0.536 | 5773 | −0.05 | 4.42 | 0.06 ± 0.03 | ... | 5.52e-04 | ||||||
| 10850327 | 19 06 21.895 | +48 13 12.97 | 13.01 | 0.382 | 6021 | −0.46 | 4.44 | 0.5 ± 0.8 | ... | 3.25e-04 | ||||||
| 11026582 | 19 21 00.202 | +48 33 31.32 | 14.47 | 0.450 | 5931 | −0.27 | 4.60 | 0.9 ± 0.8 | ... | 3.48e-04 | ||||||
| 11253827†† | 19 44 31.877 | +48 58 38.64 | 11.92 | 0.567 | 5384 | −0.13 | 4.32 | 1.94 ± 0.39 | 3.31(1.00) | 8.20e-03 | ||||||
| 11392618†† | 19 03 37.454 | +49 17 15.07 | 12.04 | 0.490 | 5520 | −0.47 | 4.51 | 0.81 ± 0.14 | 1.62(1.04) | 1.15e-04 | ||||||
| 11716643 | 19 35 27.665 | +49 48 01.04 | 14.69 | 0.551 | 5582 | −0.12 | 4.74 | 2.2 ± 3.2 | ... | 6.62e-04 | ||||||
| 12735740††, ††† | 19 19 03.264 | +51 57 45.36 | 12.62 | 0.478 | 5736 | −0.07 | 4.34 | 1.3 ± 0.3 | 1.43(0.78) | 5.31e-04 | ||||||


Notes. Stellar photometric variability is listed for each star in the last column as δf/f. Parameters marked with a † are values from the KIC. Stars observed with Keck HIRES are marked with a ††. Stars observed with Keck NIRC2 are marked with a †††. †††† We assume Teff = 6000 ± 500 K, [Fe/H] = 0.0 ± 0.5, and log g = 4.5 ± 0.5 for KIC 8012732 because no KIC values are found; the assumption is based on (g − r) value.
5. AN ITERATIVE APPROACH TO STELLAR AND PLANET PROPERTY DETERMINATION
Kepler light curves for Q1–13 were de-trended and normalized for all planet candidates that passed the false-positive tests. The light curves for these 43 stars were phase-folded and fitted with a model described by Mandel & Agol (2002). The free parameters in our model include orbital period, eccentricity e, argument of periastron ω, inclination i, the ratio of semi-major axis and stellar radius a/R*, the radius ratio of planet and star RPL/R*, mid transit time, linear limb darkening, and quadratic limb darkening parameters. A Levenberg–Marquardt least squares algorithm was used to find the best-fit parameters. Uncertainties associated with the parameters were estimated with a bootstrapping process in which the data points in transit light curves were perturbed based on the photometric measurement uncertainties and the initial guesses were perturbed based on the standard deviation of previous runs.
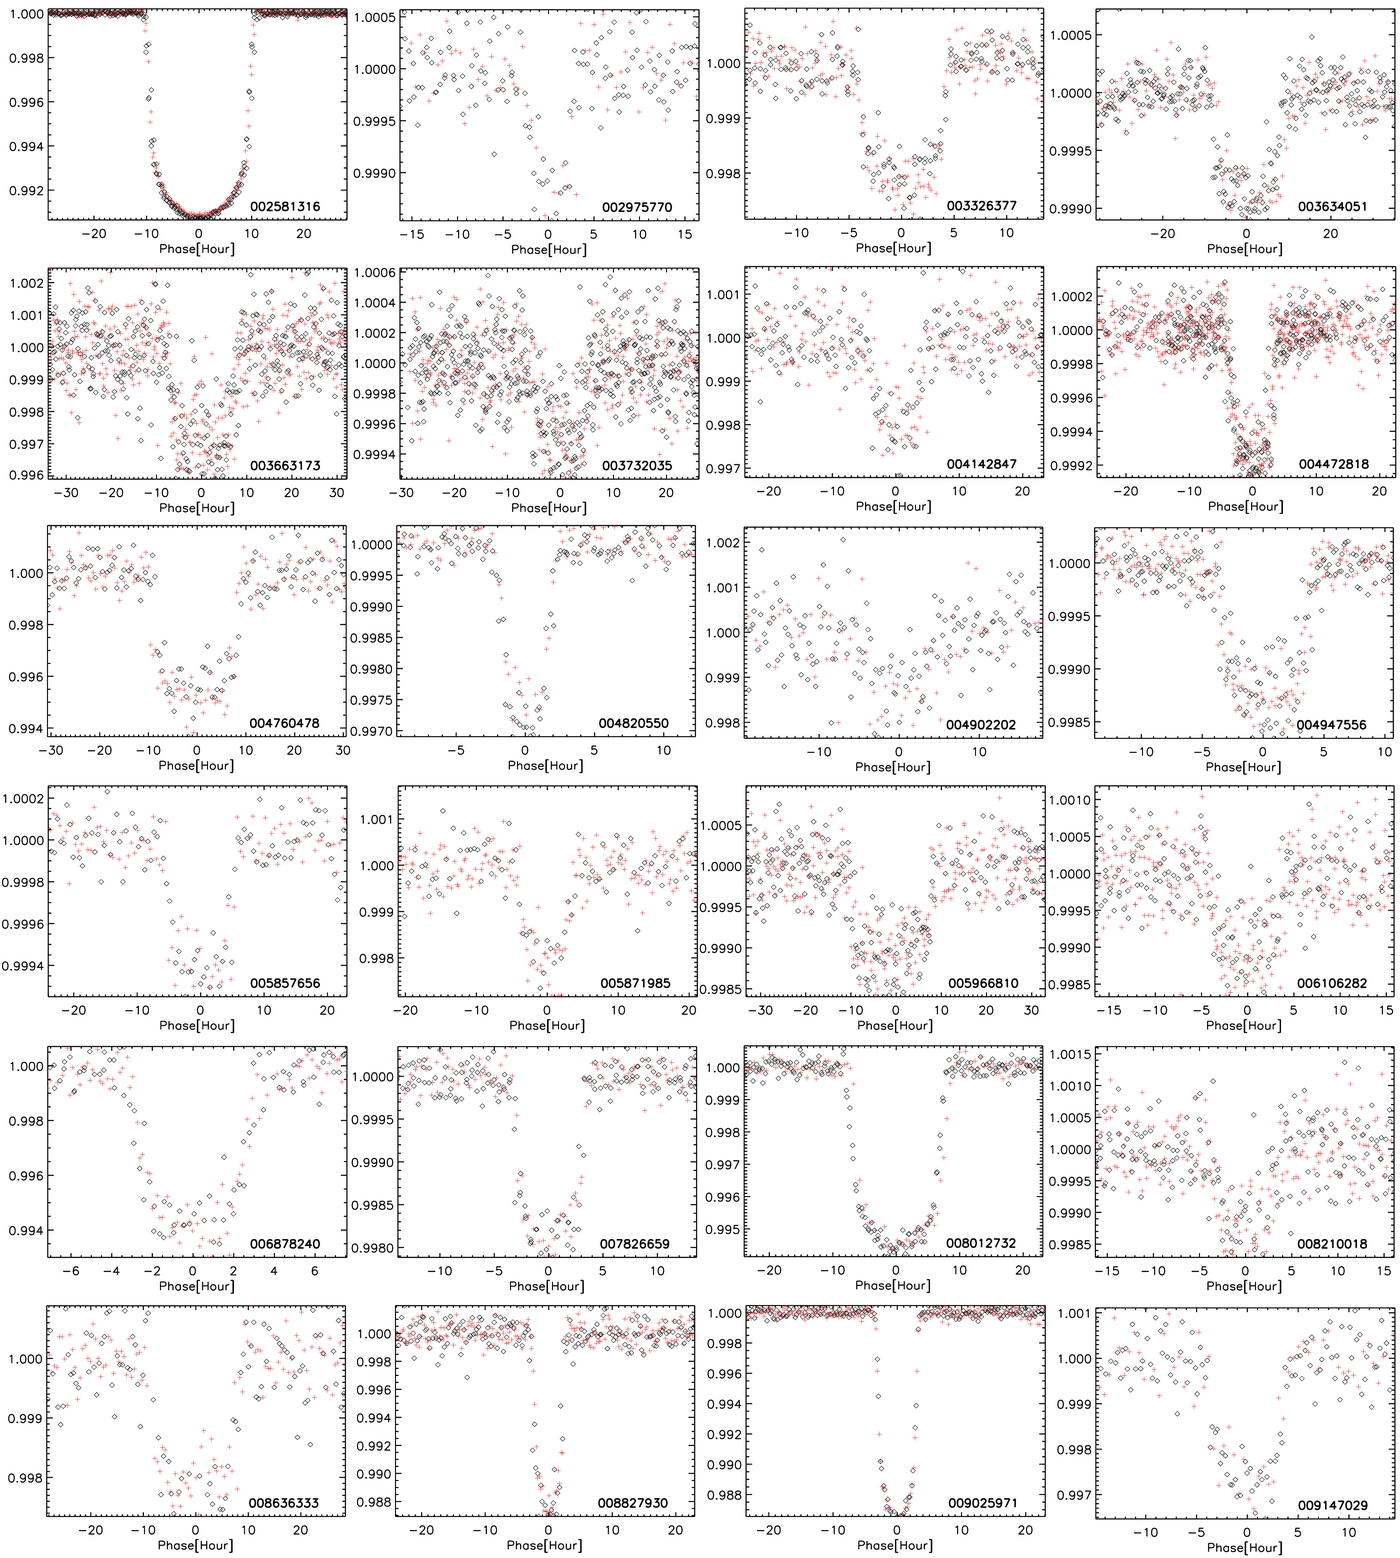
There are often several types of data that offer constraints on the stellar attributes and orbital parameters. Unfortunately, the data quality is uneven and some data may be missing altogether. We developed a code to consider the data quality and to combine all available information in order to obtain self-consistent determinations of stellar and orbital parameters along with their uncertainties. We iterate between a photometric determination of a/R* and an estimate of a/R* derived from the stellar parameters. Time-series photometry observations yield a distribution for the value of a/R* that we derive from the transit light curve model. The uncertainty of the stellar parameters and the quality of the mass and radius from the isochrone analysis lead to a separate distribution for the "evolution-model-determined" value for a/R*. One set of a/R* distributions helps to constrain parameter space that leads to the other set of a/R* distributions. After a few iterations, the two sets of a/R* distributions converge and a self-consistent stellar and orbital solution is thus obtained. This code was used to evaluate all planet candidates in this paper and the derived orbital parameters are listed in Table 1 and the phase-folded light curves are presented in Figures 4 and 5.

Figure 4. Phase-folded light curves for planet candidates discovered by the Planet Hunters project. Stellar and orbital information can be found in Tables 1 and 4. Black diamonds are data points from odd numbered transits and red pluses are data points from even numbered transits.
Download figure:
Standard image High-resolution image
Figure 5. Phase-folded light curves for planet candidates discovered by the Planet Hunters project. Stellar and orbital information can be found in Tables 1 and 4. Black diamonds are data points from odd numbered transits and red pluses are data points from even numbered transits.
Download figure:
Standard image High-resolution imageFigure 6 shows the comparison of log g, Teff, [Fe/H], and stellar radius between the iterative method and the KIC or SME values (when available). Teff and [Fe/H] are generally consistent except for one outlier, KIC 4902202. KIC 4902202 is at the fainter end of our planet candidates with a Kepler magnitude of 15.58. We suspect that the stellar characterization error is probably due to the faintness of the star. The tendency for overestimated log g values in the KIC catalog has been noted by Brown et al. (2011) and Verner et al. (2011); these overestimates result in underestimated stellar radii in the KIC data.
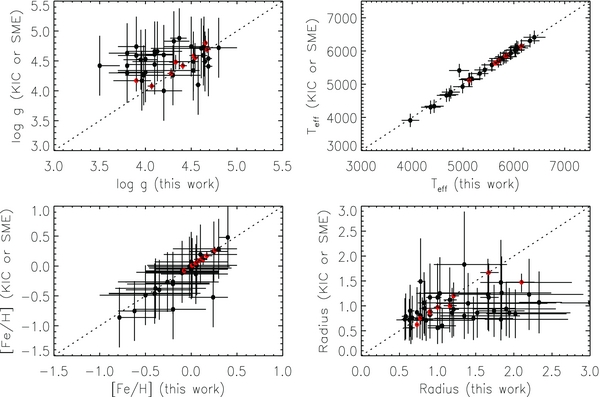
Figure 6. Comparison of log g, Teff, [Fe/H], and stellar radius results from the iterative algorithm (see Section 5 for details) and the KIC (marked as black dots) or (when available) SME values (marked as red dots). The log g values from the KIC appear to be systematically overestimated; this result likely explains why the stellar radii from the KIC are smaller than the values we derive.
Download figure:
Standard image High-resolution image5.1. Equilibrium Temperature
The planet candidate equilibrium temperature is calculated after running the iterative code discussed above. Two parameters, Teff and a/R*, are used to infer the equilibrium temperature with the following equation:

where α is albedo and ε is emissivity. We adopt α = 0.3 and ε = 0.9, which are typical values for Neptune and Jupiter in the solar system. Because orbital eccentricity is barely constrained for most of the systems, zero eccentricity is assumed in calculation; a moderate eccentricity does not significantly change the value of TPL but changes the uncertainties.
Figure 7 shows the distribution of planet candidates with equilibrium temperatures that range from 218 K to 525 K. Depending on the orbital eccentricity or atmospheric albedo or emissivity, some of these planet candidates may have equilibrium temperatures consistent with habitable planets for at least a fraction of their orbits. The smallest of these candidates is KIC 4947556 b (RP = 2.60 ± 0.08 R⊕, TPL = 277 ± 6K). Eight other candidates are also smaller than Neptune but have larger uncertainties in their radii. The median metallicity (i.e., [Fe/H]) of the stellar hosts is −0.08 dex.

Figure 7. Equilibrium temperature vs. planet radius for the 43 planet candidates. The boundaries for Neptune and Jupiter radii are plotted as red dashed lines and the hot and cold boundaries of habitable zone temperatures are delimited by the green dash-dotted lines. Most of the planet candidates are gas-giant planets and 20 candidates appear to reside in the habitable zone (as defined in Batalha et al. 2012).
Download figure:
Standard image High-resolution image6. NEW PLANET CANDIDATES
Table 1 contains only three planet candidates with orbital periods shorter than 100 days: KIC 4472818 (70.97 days) and two planet candidates around KIC 11253827 (44.99 days and 88.5 days, respectively).
Forty of our planet candidates have orbital periods longer than 100 days. We note that nine of these candidates have only two transits detected in the 13 quarters of Kepler data and so would not meet the detection criteria of the TPS algorithm (Tenenbaum et al. 2013), which used Q1–12. The derived orbital period for these nine candidates yields a prediction for when the next transit should occur and these objects are on a watch list on the Planet Hunters site, however, with only two transits, the orbital parameters for these candidates may have significant uncertainties.
Long period candidates are particularly interesting because these planets may reside in or near the so-called habitable zone where liquid water could pool on the surface of a rocky planet. The temperature range defining the habitable zone is adopted from Batalha et al. (2012) as TPL between 185 and 303 K. Excluding the nine candidates with only two observed transits (and therefore relatively large uncertainties in their prospective orbital parameters), we find that 15 of our candidates may reside in habitable zone orbits. Of course, these planets may not be habitable, especially since the modeled radii suggest that they are likely gas-giant planets. However, these 15 detections add to the 19 planet candidates announced by Batalha et al. (2012) with radii between that of Neptune and Jupiter and nearly double the set of gas-giant planet candidates in the habitable zone.
6.1. Planet Confidence Levels
Four of our stars have high quality follow-up (spectroscopic analysis and AO imaging) that allows us to quantify the false-positive probabilities for planet candidates using a method called planetary synthesis validation (PSV). The PSV technique is based on the work of Fressin et al. (2012) and Barclay et al. (2013) and has been used to confirm sub-stellar planet candidates (Barclay et al. 2013). The goal is to restrict the parameter space where false positives can exist and then to quantify the probability that we find a false positive in this space. This false-positive probability is then compared in a Bayesian manner to the probability of finding a planet of the size measured, known as the planet prior. The ratio of the planet prior to the sum of false-positive probability and the planet prior yields a confidence level for whether a particular source is a bone fide planet. A specific example is PH2 b, presented in Section 6.4.
The parameter space we consider is a two dimensional plane with axes of projected spatial distance between our target source and any false-positive source, which we refer to as separation, and the difference in brightness between our target and a false-positive source, which we refer to as ΔKP. We primarily consider background and foreground systems that are either EBs or background transiting planet host stars. False-positive scenarios involving a stellar hierarchical triple systems rarely provide a good fit to the observed light curve (Fressin et al. 2012) and are not considered here. As our goal here is to determine the probability that the source we detect is sub-stellar in nature and physically associated with the host star, we also do not consider planets orbiting a physical companion to be false positives in this study.
6.2. Using Galactic Models to Quantify False-positive Rates
We use the Bessançon Galaxy model simulation (Robin et al. 2003) to estimate the number of undetected background and foreground stars. First, we calculate a model population of stars within 1 deg2 of the target star. Then, for each ΔKP not excluded by the stellar spectra cross correlation or by transit depth, we count how many stars are in the 1 deg2 box in steps of 0.5 in KP. For example, for ΔKP = 3.0, we count how many stars have ΔKP = 3.0 ± 0.25. By using the separation constraints from centroids and AO imaging, we scale the number within 1 deg2 to find the number within our confusion limit using the equation

where S is the separation in arcseconds and the number of stars within 1 deg2 is . Then, the total number of background stars is found by integrating over the individual ΔKP bins.

6.3. Calculating the Planet Prior and Confidence in the Planetary Interpretation
In order to determine a confidence level that a particular transit is planetary in nature, we must compare to the probability of finding a real planet. This planet prior (Fressin et al. 2012; Barclay et al. 2013) makes use of the occurrence and false-positive rates derived by Fressin et al. (2013) for various sizes ranges of planets. For example, there are 223 giant planets (6.0 < R⊕ < 22.0) in the Kepler planet catalog and the false-positive rate is 17.7%. There is no correction for completeness because in the case of large planets, all are expected to be detected (Fressin et al. 2013). Therefore, the occurrence rate for giant planets is (1 − 0.177) × 223 = 184 giant planets per 1.6 × 10⁵ stars (the number of stars observed by Kepler).
The confidence level that a particular source is a bona fide planet is determined by the ratio of the planet prior to the sum of false-positive probability and the planet prior. We use the Kepler EB catalog (Slawson et al. 2011) and planet catalog (Batalha et al. 2012) and assume all of the sources in these catalogs are either detached EBs on the target source (not background EBs) or transiting planets. We do not include contact binaries, which do not mimic planetary transit light curves. We find that 2.6% of stars host are either EBs or hosts of transiting planet candidates. The planet confidence is calculated as

where pp is the planet prior (i.e., 184 for giant planets), fpstars is the false-positive rate, and the number of stars is Nstars = 1.6 × 10⁵.
We were able to derive confidence levels for the four candidate planets where both AO imaging and spectroscopic analysis was carried out on the host stars: KIC 4820550 (88%), KIC 4947556 (76%), KIC 9958387 (86%), and KIC 1235740 (99.92%). The high confidence rate for KIC 1235740 seems sufficient to suggest that the light curve dips are caused by a transiting exoplanet. These four systems will be discussed in more detail subsequently.
6.4. PH2 b (KIC 12735740)
KIC 12735740 is relatively bright with a Kepler magnitude of 12.62. The background photometric variability in the Kepler light curves is less than 0.5% and our evaluation of the emission in the cores of the Ca ii H line for KIC 12735740 suggests that this star is chromospherically inactive with an estimated ⩽ −4.9. Our Keck HIRES spectrum has a signal-to-noise ratio of ∼50 and we derive Teff = K and log g = 4.408 ± −0.044 for KIC 12735740. The star has a roughly solar metallicity with [Fe/H] = −0.07 ± 0.05 and is slowly rotating with vsin i = 1.43 ± 0.8 km s−1.


Four transits of KIC 12735740 were detected by Planet Hunters with a period of 282.5255 ± 0.0010 days, starting on the MJD of 55195.5709. Our best-fit model for the transit light curves suggest that this planet is Jupiter-sized (10.12 ± 0.56 R⊕) with a temperature at the top of its atmosphere of TPL = 281 ± 7 K. This gas-giant planet appears to reside in the habitable zone, as defined by the temperature limits of Batalha et al. (2012).
We obtain a 99.92% confidence level for a planetary nature and therefore interpret this planet as a bona fide planet and assign it the designation PH2 b.
We carried out the false-positive tests described in Section 3 for KIC 12735740 and place tight constraints on the possibility of contamination from a background or foreground star. In Figure 8, we show the centroid offsets for KIC 12735740 in the 3σ confusion region. The difference in the flux center in and out of transit was calculated by taking the weighted average of the individual measurements, using the variance to define the weights. The 3σ uncertainty radius, R, is defined by
The 3σ uncertainty radius is 0.20 arcsec for KIC 12735740.

Figure 8. Centoid offsets for KIC 12735740. The red star shows the position of the star, and the blue points are the centroid position in transit relative to the position out of transit, with associated uncertainties. The blue circle is the 3σ uncertainty radius of confusion. All centroids are consistent with the transit being on the target, although we cannot exclude false positives from sources within the blue circle.
Download figure:
Standard image High-resolution imageTo derive the lower limit on ΔKP we assume the worst case scenario: that the transit is caused by a diluted total eclipse. With this assumption, the brightest the eclipsed star can be is

where Td is the observed transit depth. For KIC 12735740, we determine the ΔKP cutoff to be 5.01.
We can also place some constraints on the presence of a background/foreground star with our SME analysis. If two blended stars have nearly the same RV, the spectral lines will be perfectly aligned; this scenario of physically aligned stars with the same RV would be difficult to exclude, however it is also highly unlikely that two stars with chance alignment will also have the same RV. We expect that a contaminating source is more likely to either broaden the observed spectral lines or produce well separated lines. However, the spectral lines for KIC 12735740 are narrow (consistent with low v sin i) and we do not see any evidence for extra flux at the blue or red edges of the spectral lines. In addition, at the level of the noise in our spectra, we do not see any evidence for a second set of well-separated spectral lines. Unless nature has conspired against us so that the RVs are nearly identical, the flux contribution of any background/foreground star is less than the signal-to-noise ratio of 50 in our Keck/HIRES spectra for KIC 12735740. This fact constrains a putative interloper to have a magnitude difference that is ⩾4.2 mag.
If there is a faint binary companion and we reason that this companion star is on the same isochrone as KIC 12735740, the limit on stellar magnitude allows us to infer a maximum mass of 0.67 M☉ using a Dartmouth 4 Gyr isochrone (Dotter et al. 2008) and suggests that the putative interloper is a late K or M dwarf star with Teff ∼ 4300 K. Only three stars cooler than 4300 K in the Kepler planet candidates list host gas-giant (>6.0 R⊕) transiting planet candidates (Batalha et al. 2012). Qualitatively, this fact makes the scenario of a transiting planet around a low-mass binary companion unlikely. Furthermore, a dilution of 90% would result in a transit depth of 0.098, which equates to an approximate scaled planet radius of Rp/R⋆ = 0.3. This finding results in a planet size that is not sub-stellar. Hence, we dismiss this scenario. We can also use this reasoning to dismiss the (unlikely) scenario that the transit is owing to a hierarchical stellar triple because we would detect a secondary eclipse.
Figure 9 shows the regions of parameter space we can exclude. For KIC 12735740, the number of background or foreground stars in the galaxy that might reside in the non-excluded space is statistically 0.000035. However, not all these background stars are likely to be EBs or bright stars with transiting planets. According to Equation 3, our planet confidence for KIC 12735740 is therefore 99.92%.

Figure 9. Regions excluded from our false-positive calculations for KIC 12735740. We exclude parameter space using spectroscopic inspection (green), AO imaging (blue), transit curve analysis (red), and pixel centroid analysis (cyan). Only the remaining white region is not excluded and we determine our false-positive probability by estimating how many stars are statistically likely to appear in this space.
Download figure:
Standard image High-resolution imageWe obtained four RV data points for KIC 12735740 using Keck HIRES from UT 2013 June 3 to 2013 June 25, spanning 22 days. The results are reported in Table 5. The uncertainties of RV measurements are ∼2 m s−1. Neither periodical signals nor linear trends are detected; the rms of the measurements is 14.0 m s−1. The rms indicates that KIC 12735740 has a large RV jitter level at ∼15 m s−1. We conducted Monte Carlo simulations to test the scenario of the transiting object being an EB. In simulations, we adopted the orbital solution obtained in this study (Table 1). The argument of pariastron is randomized with a uniform distribution between 0 and 2π because it is poorly constrained. The mass of the companion is assumed to be 80 MJ, a rough dividing line between a low-mass star and a brown dwarf (BD). We compared the range of the simulated RV curves and the rms of the measurements for the same time span as the HIRES observations. If the RV range is three times more than the rms, then the EB scenario is excluded at a 3σ significance. We found that the EB scenario is excluded in 95.7% of simulations, implying that such a possibility is low. We also considered zero eccentricity in simulations and the possibility of the EB scenario is even lower. We furthermore considered companions of lower mass, e.g., a BD or planet scenario. The results are reported in Table 6. We found a large fraction of simulations in which the BD scenario is excluded, although the fraction is smaller than that for the EB scenario. At the current rms level, no strong constraints can be set on the planet scenario.
Table 5. Keck HIRES Doppler Measurement Results for KIC 12735740
| Time | RV | Uncertainty |
|---|---|---|
| (MJD) | (m s−1) | (m s−1) |
| 56446.894462 | 3.56 | 1.81 |
| 56449.918787 | 18.26 | 1.72 |
| 56451.065853 | −9.81 | 1.75 |
| 56468.937706 | −12.00 | 2.18 |
Download table as: ASCIITypeset image
Table 6. Fraction of Simulations in Which a Companion with a Given Mass is Excluded at the 3σ Level Based on Keck HIRES Observations of KIC 12735740
| Mass | Fraction |
|---|---|
| (MJ) | (%) |
| 80 | 95.7 |
| 40 | 91.0 |
| 20 | 79.7 |
| 10 | 55.5 |
Download table as: ASCIITypeset image
Stellar companions are found around 46% of solar-type stars (Raghavan et al. 2010) and 2.8% of the companions (M6V–M9V) have similar radii to Jupiter, confusing the nature of PH2 b. However, the stellar companion (EB) scenario is excluded at high confidence by the Keck HIRES observations. BD companions are very rare compared with stellar companions and giant planets (Grether & Lineweaver 2006). The occurrence rate is less than 1% for BDs (Marcy & Butler 2000), 1.3% (46%×2.8%) for M6V–M9V companions (Duquennoy & Mayor 1991; Raghavan et al. 2010), and 5% for planets (Fischer & Valenti 2005; Udry & Santos 2007; Johnson et al. 2007). In addition, BDs with masses of more than 20 MJ are excluded by the HIRES observations at a relatively high confidence. Given the ∼1:50 relative probability of a BD to a giant planet (Grether & Lineweaver 2006) and the high planet confidence, PH2 b should be a giant planet with a very high likelihood.
6.5. KIC 4820550
The Kepler magnitude for KIC 4820550 is 13.9. The star exhibits a modest variability of ∼2% in the Kepler light curve data. The isochrone analysis suggests a stellar radius of 0.77 R☉. We compared the Ca ii line core emission in the spectra of KIC 4820550 to CPS stars with similar Teff values of 5682 K and found that the Ca ii H line core emission of HD 103432, a star with moderate chromospheric activity and of −4.63, was an excellent match. Five transits for KIC 4820550 were identified by Planet Hunters beginning with MJD 55124.54794, yielding an orbital period of 202.1175 ± 0.0009 days. The radius of this planet candidate was modeled to be 5.13 ± 0.32 R⊕ and the planet confidence level was assessed at 88%.

6.6. KIC 4947556
According to the Kepler Input Catalog, KIC 4947556 has a Kepler magnitude of 13.336 and g − r color of 0.806. We derived Teff = K, log g = , and [Fe/H] = for KIC 4947556 using SME analysis of the Keck HIRES spectrum. Our iterative isochrone analysis yields a stellar radius of R☉. The emission of the Ca H and K line is comparable to the chromospherically active K dwarf Epsilon Eridani (HD 22049), which has a chromospheric activity indicator equal to = −4.44. The photometry of KIC 4947556 shows ∼6% variability from star spots. Against the backdrop of this light curve variability, the Planet Hunters were able to detect transit signals with a depth of about 0.13% at a period of 140.6091 ± 0.0045 days.


Iterative analysis indicates a radius of 2.60 ± 0.08 R⊕, making this object a SuperEarth or a mini-Neptune candidate in the habitable zone with TPL = 277 ± 6 K. This candidate is the smallest planet candidate reported in this paper. Unfortunately, it would be challenging to obtain RV follow-up to determine the planet candidate mass and composition because of the faintness of the star and the small reflex velocity expected for the 141 day orbital period of this planet candidate. Tenenbaum et al. (2013) reported a TCE for this star with a 13.0268 day period and a transit depth of 425 ppm.
6.7. KIC 9958387
KIC 9958387 has a Kepler magnitude of 13.5. Our spectroscopic analysis is consistent with the KIC parameters of Teff = 6159 K, log g = 4.339, and [Fe/H] = −0.263. However, we derive a significantly different stellar radius. The KIC stellar radius is listed as 1.168 R☉ while our analysis indicates a larger radius of 1.67 R☉. We estimate an upper limit for of −4.7 for KIC 9958387 by comparing the data with spectra of CPS stars; KIC 9958387 is a relatively inactive star. Planet Hunter volunteers discovered five transits in the Q1–13 light curves, yielding an orbital period of 237.7886 ± 0.0053 days with the first detected transit on the MJD of 55029.46560. Adopting our larger stellar radius of 1.67 R☉, the planet radius is estimated to be 8.78 ± 0.81 R⊕.


6.8. Planet Candidates in Multi-planet Systems
Discoveries of transits of additional objects within the same system reduce the probability of false positive because it is rare to have multiple false-positive signals that mimic transiting planets. The detection of two planet candidates around a single star increases the likelihood that a transit signal is a planet by a factor of ∼25 (Lissauer et al. 2011). Lissauer et al. (2012) further pointed out that almost all Kepler multiple-planet candidates are true planets. The Planet Hunter volunteers discovered seven new multi-planet candidates; three of these objects were second planet candidates in systems that had already been announced by the Kepler team. Figure 10 shows five multiple-planet candidate systems with both planets discovered by the Planet Hunters or the second candidate discovered by the Planet Hunters in addition to a Kepler Object of Interest (KOI).

Figure 10. De-trended time series data for the multi-planet candidates KIC 2975770, KIC 3326377, KIC 5437945, KIC 9663113, and KIC 11253827. Blue lines mark the transit times of the inner planet candidate; red lines mark the transit times of the outer planet candidate.
Download figure:
Standard image High-resolution imageKIC 5437945 has an effective temperature of 6093 K according to the KIC. Planet Hunter volunteers identified a pair of planet candidates in a 2:1 commensurability with orbital periods of 220.1344 days and 440.7704 days. In this case, the period ratio of 2.003 further increases the confidence of the planet interpretation for the transit light curve. Both planet candidates have Jupiter-like radii, consistent with the interpretation that these are prospective gas-giant planets. This pair of planets was also independently found by Huang et al. (2013).
KIC 11253827 is the brightest star among our multi-planet candidate systems, with a Kepler magnitude of 11.92. We obtained a Keck HIRES spectrum to derive the stellar properties and find that this object is a sun-like star. With our stellar radius measurement (R* = 0.90 R☉), we derive radii for the two transiting planet candidates of 2.63 ± 0.24 and 4.42 ± 0.32 R⊕, respectively. The orbital periods are 42.99 days and 88.5 days; giving a period ratio of 2.06. Huang et al. (2013) independently found this pair of candidates.

Planet Hunters also identified transiting planet candidates around three stars that were already known to have one other transit candidate (KOI 1788, KOI 179, and KOI 1830). A second planet candidate with a period of 369.1 days (nearly one Earth year) was discovered around KIC 2975770 (KOI 1788). The first planet candidate was announced by the Kepler team with an orbital period of 71.5 days and a radius estimate of RP = 5.44 ± 0.31 R⊕ (Batalha et al. 2012). The new candidate, KIC 2975770 c, appears to similar in size to Neptune with 4.22 ± 2.50 R⊕. The equilibrium temperature for this outer planet is 243 ± 44 K. The configuration of the two candidates, KIC 2975770 b and c, is close to a 5:1 mean motion resonance.
The Kepler team discovered a planet candidate with 3.07 ± 0.14 R⊕ in a 20.7 day orbit around KOI 179 system (KIC 9663113; Batalha et al. 2012) and Planet Hunter volunteers discovered two transits that appear to arise from a second candidate with 10.93 ± 1.38 R⊕ in a 572.4 day orbit. Ofir & Dreizler (2013) announced a single transit for this outer planet, however their estimated planet radius is about half of our value.
Planet Hunters found a more distant transit candidate with a radius of 4.25 ± 1.03 R⊕ in a 198.7 day orbit orbiting KIC 3326377 (KOI 1830). The Kepler team had announced a superEarth candidate with 1.76 ± 0.09 R⊕ in a 13.2 day orbit about this same star. The outer planet in this system, with a 198.7 day orbit, was also announced by Huang et al. (2013).
A pair of planets initially on coplanar circular orbits will be stable if they do not develop crossing orbits, which will be true when the following condition is met (Lissauer et al. 2011):

where RH is the mutual Hill sphere and (a2 − a1) is the difference of the semi-major axes of the two planets. We find that this condition is strongly met for the five multi-planet systems presented here: KIC 2975770 (Δ = 21.2), KIC 3326377 (Δ = 43.7), KIC 9663113 (Δ = 32.8), KIC 5437945 (Δ = 7.1), and KIC 11253827 (Δ = 15.6).
According to a recent paper by Tenenbaum et al. (2013), KIC 4947556 and KIC 6878240 also have TCEs with different periods than were found here. These systems may represent two more multi-planet candidate systems.
7. SUMMARY AND DISCUSSION
In this paper, we provide a progress report of 43 new discoveries emerging from Planet Hunters. We have developed an iterative algorithm to combine stellar evolution models and transiting light curve analysis to obtain self-consistent stellar and orbital properties, model these systems (Table 1), and carry out a false-positive check for these candidates.
The remaining planet candidates have three or more identified transits and most have orbital periods that exceed 100 days. This contribution increases by ∼30% the sample of gas-giant planet candidates (Batalha et al. 2012) with orbital periods longer than 100 days and with radii that range between those of Neptune and Jupiter.
Among these new candidates, 20 appear to orbit at distances where the temperature at the top of the atmosphere would be consistent with temperatures in habitable zones. Most of these habitable zone planet candidates have radii comparable to or larger than that of Neptune; however, one candidate (KIC 4947556) has a radius of 2.60 ± 0.08 R⊕ and may be a SuperEarth or a mini-Neptune.
At least nine of our planet candidates are members of (seven) multi-planet systems. The detection of multiple transit signals in a given light curve raises the confidence level that prospective transits are truly planets (Lissauer et al. 2012). We were able to place severe limits on false-positive probabilities for one of our candidates with follow-up spectroscopic analysis and AO imaging, pixel centroid analysis, Galactic population synthesis, and Bayesian planet priors. The planet confidence level for KIC 12735740 is 99.92%, high enough that this object seems to be a bona fide planet and we assign the designation PH2 b to this planet. PH2 b is a Jupiter-size planet orbiting in the habitable zone of KIC 12735740, a solar-type star.
Despite residing in the habitable zone, PH2 b itself may not be habitable because of its gas-giant planetary nature. However, exo-moons around PH2 b may be suitable for life to survive and evolve (Heller & Barnes 2013) and such exo-moons are not rare according to a study by Sasaki et al. (2010) of the formation of the Jupiter and Saturn satellite systems. Furthermore, Kipping (2009a, 2009b) has shown that an exo-moon with a mass of more than 20% of the Earth's mass can be detected by the Kepler mission. The first result of searching for exo-moons is reported in Kipping et al. (2013). As the time baseline of the Kepler mission increases, PH2 b and other candidates reported in this paper may become suitable for exo-moon searches in the near future.
Tenenbaum et al. (2013) recently presented detections of potential transit signals in the first 12 quarters of Kepler mission data and provided a list of TCEs. Figure 11 plots the planet candidates presented in this paper that are also on the TCE list. Among our 43 new candidates, 28 are included in the TCE list with orbital parameters that agree and 15 are unique findings.

Figure 11. Transit depth vs. orbital period scatter for the 43 planet candidates presented in this paper. Red asterisks are candidates also included in the Kepler TCE list (Tenenbaum et al. 2013). Black solid circles marked with KIC numbers are discoveries not included in the TCE list but with at least three transits identified by Planet Hunter participants. Diamonds are long period candidates where only two transits were found by Planet Hunter volunteers. Planet candidates that appear to reside in the habitable zone are circled in blue.
Download figure:
Standard image High-resolution image
Planet Hunters found six additional planet candidates with periods shorter than 525 days (the boundary imposed by the requirement that at least three transits must be detected by the Kepler TCE pipeline) that have three or more transits: KIC 3634051, KIC 8012732, KIC 9147029, KIC 9166700, KIC 9425139, and KIC 11026582. The other nine of the unique candidates have prospective periods longer than 400 days so only two transits were found in the Q1–13 data; therefore, these candidates would not have been detected by the TCE pipeline. However, the estimated orbital periods for these nine candidates allow us to establish a watch list on the Planet Hunters site to intensify the search for subsequent transits.
The data presented in this paper are the result of the efforts of the Planet Hunters volunteers, without whom this work would not have been possible. Their contributions are individually acknowledged at http://www.planethunters.org/authors. The authors thank the Planet Hunters volunteers who participated in identifying and analyzing the candidates presented in this paper. They are individually recognized at http://www.planethunters.org/LongPeriodCandidates.
D.F. acknowledges funding support for PlanetHunters.org from Yale University and support from the NASA Supplemental Outreach Award, 10-OUTRCH.210-0001, and the NASA ADAP12-0172. M.E.S. is supported by an NSF Astronomy and Astrophysics Postdoctoral Fellowship under award AST-100325 and in part by an American Philosophical Society Grant. K.S. gratefully acknowledges support from Swiss National Science Foundation grant PP00P2_138979/1. The Zooniverse is supported by The Leverhulme Trust and by the Alfred P. Sloan foundation. Planet Hunters is supported in part by NASA JPL's PlanetQuest program. The Talk system used by Planet Hunters was built during work supported by the National Science Foundation under grant No. DRL-0941610. We gratefully acknowledge the dedication and achievements of the Kepler science team and all those who contributed to the success of the mission. We acknowledge use of public release data served by the NASA/IPAC/NExScI Star and Exoplanet Database, which is operated by the Jet Propulsion Laboratory, California Institute of Technology, under contract with the National Aeronautics and Space Administration. This research has made use of NASA's Astrophysics Data System Bibliographic Services. This paper includes data collected by the Kepler spacecraft and we gratefully acknowledge the entire Kepler mission team's efforts in obtaining and providing the light curves used in this analysis. Funding for the Kepler mission is provided by the NASA Science Mission directorate. The publicly released Kepler light curves were obtained from the Mikulski Archive at the Space Telescope Science Institute (MAST). STScI is operated by the Association of Universities for Research in Astronomy, Inc., under NASA contract NAS5-26555. Support for MAST for non-Hubble Space Telescope data is provided by the NASA Office of Space Science via grant NNX09AF08G and by other grants and contracts.
Footnotes
- *
This publication has been made possible by the participation of more than 200,000 volunteers in the Planet Hunters project. Their contributions are individually acknowledged at http://www.planethunters.org/authors.
- 11
- 12
- 13
- 14
- 15
http://talk.planethunters.org—the code is available under an open-source license at https://github.com/zooniverse/Talk.