


ABSTRACT
In the interstellar medium (ISM), molecular hydrogen is expected to form almost exclusively on the surfaces of dust grains. Due to that molecule's large formation energy (−4.5 eV), several dynamical effects are likely associated with the process, including the alignment of asymmetric dust grains with the ambient magnetic field. Such aligned dust grains are, in turn, believed to cause the broadband optical/infrared polarization observed in the ISM. Here, we present the first observational evidence for grain alignment driven by H2 formation, by showing that the polarization of the light from stars behind the reflection nebula IC 63 appears to correlate with the intensity of H2 fluorescence. While our results strongly suggest a role for "Purcell rockets" in grain alignment, additional observations are needed to conclusively confirm their role. By showing a direct connection between H2 formation and a probe of the dust characteristics, these results also provide one of the first direct confirmations of the grain-surface formation of H2. We compare our observations to ab initio modeling based on Radiative Torque Alignment (RAT) theory.
1. INTRODUCTION
Molecular hydrogen (H2) is the dominant constituent of dense interstellar gas. However, lacking a permanent electric dipole moment, it cannot radiate away energy efficiently at temperatures below ∼1000 K. Hence, H2 cannot form through neutral two-body collisions, since the binding energy of the molecule (−4.5 eV) cannot be radiatively shed. These considerations led van de Hulst (1948) to suggest that H2 forms on the surfaces of dust grains in the interstellar medium (ISM). This mechanism is now theoretically well-established (McCrea & McNally 1960; Gould & Salpeter 1963; Hollenbach & Salpeter 1971) and is also supported by laboratory data (Vidali et al. 2005). However, observational tests remain limited. Recently, van Hoof et al. (2010) showed a correlation between grain column and fluorescent intensity in the planetary nebula NGC 6720, which they interpreted as due to grain surface formation of H2. Other observational tests, to date, have been only indirect (e.g., Gry et al. 2002).
The destruction of H2 in the ISM is dominated by photodissociation. Direct photodissociation of an H2 molecule, however, requires a photon with energy E > 14.7 eV (Stecher & Williams 1967), which is well above the ionization energy of atomic hydrogen (E = 13.6 eV). Such photons are not expected to be available in the general neutral ISM. The photodissociation of H2 instead takes place via a two-step process utilizing a less energetic ultraviolet (UV) photon (λ ≲ 1108 Å; Abgrall et al. 1992). The first step is the radiative excitation from the ground state into one of the first two excited electronic states, through the Lyman or Werner bands. If, in the subsequent relaxation of the molecule, the resulting vibrational quantum state is in the vibrational continuum (v > 14), the molecule dissociates. Approximately 15% of the initial photoexcitations lead to dissociation of the molecule (Draine 2011). The remaining 85% of the excitations release the excess energy in a fluorescent cascade through rotation-vibration states, producing copious near-infrared (NIR) line emission. Since the branching ratios between destruction and radiative cascade are given by quantum mechanics, the fluorescent intensity can be used to trace the H2 destruction rate in the gas. Shock excitation of H2 can also produce NIR emission from nebulae, but the line ratios in the NIR and far-ultraviolet (FUV) differ between shock excitation and fluorescence, such that observations can be used to distinguish the excitation mechanism behind the line emission (Luhman et al. 1997).
In addition to imparting vibrational and rotational excitation to the molecule and thereby heating the gas, the formation energy of H2 may also contribute to the alignment of interstellar dust particles, producing polarization of starlight passing through the ISM. Interstellar polarization was discovered in 1949 (Hall 1949; Hiltner 1949a, 1949b), and was from the start predicted to be due to asymmetric dust grains aligned with the magnetic field (Hiltner 1949a; Spitzer & Tukey 1949). The fraction of aligned grains, and thus the amount of polarization relative to the extinction, varies from source to source and depends on the fraction of asymmetric grains, their alignment efficiency (Whittet 2003), and the line of sight topology of the magnetic field (Jones et al. 1992). Although several theoretical models have been put forward, a self-consistent, observationally verified theory remains elusive. Such a theory would allow a better understanding of interstellar magnetic fields (Chandrasekhar & Fermi 1953; Ostriker et al. 2001; Andersson & Potter 2005), the foreground of the cosmic microwave background radiation (Lazarian & Finkbeiner 2003), and would also contribute to better characterization of the dust (Draine & Lazarian 1998).
1.1. Grain Alignment
The long standing "classical" explanation for interstellar grain alignment was put forward in the seminal paper by Davis & Greenstein (1951, hereafter DG) and relies on paramagnetic relaxation in rapidly spinning dust grains (Draine 2011). In the original theory, the spin-up of the grains relied on gas–grain collisions, but this was soon realized to be ineffective in the ISM (Jones & Spitzer 1967). Several authors subsequently proposed modifications to the mechanism, either by enhancements of the magnetic susceptibility of the grains, through ferromagnetic inclusions in the paramagnetic grain bulk (Jones & Spitzer 1967; Mathis 1986), or via an enhanced spin-up mechanism (Purcell 1979). In the latter case, the grain rotation comes from the torques imparted on the grain by the ejection of particles with energies well above the thermal energy of the gas and dust, specifically either photo-electrons or newly formed H2 molecules, forming so called "Purcell rockets." Hence, for such supra-thermal paramagnetic alignment, a correlation between H2 fluorescence and polarization would be expected.
The paramagnetic grain alignment paradigm was put in doubt in the 1990s through both observational and theoretical developments. The observation of polarization in the solid state line of CO at 4.7 μm (Chrysostomou et al. 1996; Hough et al. 2008) indicates that grains are aligned in environments where the gas and dust temperatures approach each other, in violation of thermodynamical requirements for paramagnetic relaxation alignment (Jones & Spitzer 1967). Theoretically, through the realization that internal energy modes of the grains will cause the rotation axis to flip on time scales shorter than those needed for spin-up and alignment via paramagnetic relaxation (Lazarian & Draine 1999; see Weingartner 2009 and Hoang & Lazarian 2009 for subsequent developments and discussion on this issue). Since the ejection sites for the Purcell rockets are fixed in the grain coordinate system, a grain-flip will cause the torque on the grain to reverse and hence the grain will trend to a low angular momentum state.
However, in parallel to the realization of the problems with the extended DG paradigm, an alternative grain alignment theory—Radiative Alignment Torque (RAT) theory—was being developed based on the differential scattering of the left- and right-hand circular polarized components of light off a grain with net helicity. As first shown by Dolginov & Mitrofanov (1976), and subsequently developed by Draine, Lazarian and their collaborators (Draine & Flatau 1994; Draine & Weingartner 1997; Lazarian & Hoang 2007), an anisotropic radiation field can both spin up and align the dust grains with the magnetic field. Because helicity is invariant on reflection, this mechanism is not susceptible to the limitations caused by the "thermal flipping" of the grain. While the mechanisms behind the alignment are fundamentally different, the observational predictions for RAT theory are generally consistent with the DG alignment: for optical/NIR background starlight polarization, the position angle traces the local orientation of the plane-of-the-sky component of the magnetic field.
Whereas the RAT theory is dominated by the direct interaction of the grain and radiation, there are situations (Hoang & Lazarian 2009) in which secondary effects, such as the addition of Purcell rocket torques can play a role. Therefore, also in the RAT paradigm, polarization is predicted to correlate with H2 fluorescence.
Empirical support for radiative grain alignment comes from observations (Whittet et al. 2008) showing that the fractional polarization (p/AV) drops in a continuous fashion from a cloud surface to well beyond the optical depths where the high-energy photons needed to drive Purcell rockets have been excluded, and from observations (Andersson & Potter 2007) showing that the wavelength of maximum polarization is correlated with the visual extinction or with distance from a local radiation source (Andersson & Potter 2010). Recently, a unique prediction of RAT alignment, that the alignment efficiency depends on the relative angle between the radiation anisotropy and the magnetic field directions, has also been given observational support (Andersson et al. 2011). Hence, the RAT theory is now the leading candidate for explaining interstellar grain alignment. Additional quantitative tests are, however, needed before any grain alignment theory can be considered to be reliably established.
Independent of the alignment mechanism(s), the primary mechanism responsible for randomizing the grain orientation is thought to be gas-grain collisions (Draine & Lazarian 1998). The "disalignment time" required to randomize the orientation of the grains is given by (Whittet 2003):

where a is the effective grain radius, and n and T are the gas density and temperature. Therefore, for warmer and/or denser gas, the time required to randomize the grain orientation is decreased.
1.2. H2 Formation-driven Grain Alignment
Probably the best environments to observationally test the role of H2 formation in grain alignment are found in photodissociation regions (PDR), where high radiation fluxes impinge on dense material to cause high rates of H2 destruction and formation. The molecular formation and destruction mechanisms have much shorter time scales than the dynamical time scales in a well-established PDR (Tielens 2005). Therefore, the abundance of H2 is governed by a detailed balance equation, where photodissociations are exactly balanced by molecular formation (cf. Gry et al. 2002)

where R is the H2 formation rate on the dust grains (which includes the gas-to-dust abundance ratio), β0 is the H2 photodissociation rate, G is the strength of the local radiation field (including extinction into the medium), and n(H i) and n(H2) are the space densities of atomic and molecular hydrogen and ntot = n(H i)+2n(H2).
Explicit time-dependent modeling of interstellar chemistry (Morata & Herbst 2008) confirms that this detailed balance is valid, even at quite small depths into the medium. The fluorescent intensity of H2 in PDRs is therefore predicted to be directly proportional to the destruction of H2 and, via Equation (2), to the formation rate of the molecule.
To test H2 formation driven grain alignment, we need to determine the polarization (tracing the grain alignment) for a number of lines of sight with well determined H2 fluorescent intensities. A number of potential observational biases must be kept in mind when performing such a test. To avoid complications from variations in elemental abundances and illuminating radiation fields, the observations should preferably all probe a single physical region. To account for opacity variations and possible changes in the grain size distribution, the total column density and size distribution of dust need to be constrained, through measurements of the visual extinction (AV) and the total-to-selective extinction (RV). Finally, the randomizing mechanisms balancing the alignment driving need to be probed. To address these concerns, we have selected a compact interstellar cloud illuminated by a well characterized radiation field. In addition to our polarimetry and fluorescence data, we augment with visual extinctions based on spectral classification and multi-band visual photometry of target background stars. Adding NIR photometry allows the overall grain size distribution to be constrained via its dependence on the total-to-selective extinction (RV; Cardelli et al. 1988). Finally, estimates of the gas density and temperature allow the effects of the competing mechanism of grain orientation randomization to be evaluated.
1.3. The Laboratory: IC 63
One of the best studied PDRs is associated with the reflection nebula IC 63 in Cassiopeia (Jansen et al. 1995; Blouin et al. 1997; Karr et al. 2005; France et al. 2005; Thi et al. 2009; Fleming et al. 2010). It is nearby, at d ≈ 200 pc, based on field star extinctions for stars with either trigonometric or spectroscopic parallaxes (Figure 1). IC 63 is illuminated by the B0 IV star γ Cas and is, together with IC 59, part of the Sharpless 185 H ii region (Sh 185; Sharpless 1959). This estimated distance to the cloud is consistent with that to the star, d = 188 ± 20 pc (Figure 1), based on its Hipparcos parallax (Perryman et al. 1997). Because of the proximity of the nebula, it allows relatively good spatial resolution for emission studies. A number of reasonably bright background stars are available, probing lines of sight through the nebula, suitable for testing the relationship between polarization and H2 fluorescence. The FUV spectra of both the nebula and the illuminating star have been measured at high spectral resolution, using sounding rocket and satellite observations (Witt et al. 1989; France et al. 2005), providing detailed constraints on the H2 processing and the illumination of the nebula (France et al. 2005). The NIR line emission from the PDR has been observed by Luhman et al. (1997), who found that the H2 line emission is dominated by fluorescence. Complemented with a comprehensive set of millimeter and sub-millimeter wave data, these observations have been used to constrain detailed chemical and physical models of the nebula and underlying molecular cloud (Jansen et al. 1994, 1995, 1996).

Figure 1. Using parallaxes and photometry for stars in the Hipparcos (Perryman et al. 1997) and Tycho (Høg et al. 2000) surveys, an extinction layer in the direction of IC 63 is seen at ∼200 pc. This distance is consistent with the Hipparcos parallax to γ Cas of d = 188 ± 20 pc (AV = 1.3), indicated by the vertical line and gray rectangle.
Download figure:
Standard image High-resolution imageEven at the high UV illumination levels estimated for IC 63, of about 650 times (Jansen et al. 1995) the average Galactic interstellar radiation field (ISRF; Draine 1978), time-independent chemical models closely reproduce the nebular abundances for most species (Jansen et al. 1994, 1995, 1996). These results support the detailed balance assumption (Equation (2)) for the molecular hydrogen abundance for IC 63. Based on line ratios in a number of simple molecules, Jansen et al. (1994) find column-density-averaged temperatures and spatial densities in the molecular cloud of Tgas = 50 ± 10 K, n(H2) = (5 ± 2) × 104 cm−3, and Tdust = 45 K. In their subsequent comprehensive modeling, they find a layered temperature structure with Tgas = 200, 150, and 80 for AV = 0.5, 1.0, and 2.0, respectively. As they point out, IC 63 has the high temperature of a translucent cloud, but the high density of a molecular cloud core. They speculate that IC 63 (and, to a lesser extent, IC 59) are the remaining cores from a more extensive cloud being destroyed by the radiation from γ Cas. Fleming et al. (2010) showed the temperature of the gas in the narrow compression ridge region of the nebula is significantly enhanced beyond these estimates, to about T = 600 K. Similarly, Polehampton et al. (2005) used interferometric observations of HCO+ to show that this compression ridge region is locally enhanced in density over the averages in the remainder of the molecular part of the nebula.
Even though IC 63 is located at a moderately low Galactic latitude (l, b ∼ 124°, −2°), the next spiral arm in this direction, the Perseus arm, is at a distance of 3–5 kpc (Ungerechts et al. 2000; Russeil et al. 2007; Ginsburg et al. 2011), meaning that the line of sight through IC 63 passes at least 100 pc below the Perseus arm. Thus, the risk for line of sight confusion is small, both for the polarimetry and for determinations of the visual extinction. NIR color–color diagrams show no IR-excess sources toward the nebula, indicating that star formation is not currently taking place.
Thus, the combination of extensive observational characterization of the nebula, and its exciting star, the isolation and spatial resolution of the nebula and the availability of suitable background stars toward which absorption and dichroic extinction studies can be conducted, makes IC 63 an ideal target for the study of H2 formation-driven grain alignment.
2. OBSERVATIONS AND DATA REDUCTION
2.1. Polarimetry
In order to probe the grain alignment in parts of the IC 63 nebula and its associated dark cloud with both high and low expected H2 formation rates, we sought lines of sight toward background stars probing regions showing high and low diffuse KS-band (2.1 μm) emission. As the target selection was done prior to the narrow-band imaging reported herein, the assumption was made that the diffuse 2MASS emission in the nebula was dominated by H2 fluorescence. We looked for stars probing the reflection nebula, the region between γ Cas and the reflection nebula, and regions of the dark cloud well away from the diffuse optical emission. A V-band magnitude-limited sample was developed for the region from the NOMAD (Zacharias et al. 2005) survey, compared to images of the nebula from the POSS-II digital sky survey and 2MASS, and a prioritized list of target stars was established.
We acquired optical spectro-polarimetry toward 12 stars (Table 1) at the Nordic Optical Telescope (NOT) on La Palma during 2008 October 6–9, using the ALFOSC instrument in linear polarimetry mode.8 We used grism #10, which provided a wavelength coverage of λλ ∼ 3200–10500 Å and a dispersion of ∼6.5 Å pixel−1. Because a slit width larger than the average seeing was used to maximize throughput, the spectral resolution varied with the seeing, but was of the order of 20 Å. For the ALFOSC observations, we typically used 16 half-wave plate (HWP) positions, separated by 22 5 (rather than the required four) as the redundancy allows for a better characterization and cancellation of systematic errors. Integration times per half-wave plate position ranged from 180 to 720 s, as shown in Table 1
Table 1. Source List, Optical Polarimetry
| Star | R.A. | Decl. | Instrument | texpa |
|---|---|---|---|---|
| (2000) | (2000) | (s) | ||
| IC63 #70 | 00:58:41.9 | 60:52:41.9 | T | |
| IC63 #68 | 00:58:55.7 | 60:52:10.6 | A | 180 |
| IC63 #76 | 00:58:57.2 | 60:53:16.9 | A,T | 300 |
| IC63 #43 | 00:58:59.9 | 60:53:57.5 | A | 660 |
| IC63 #46 | 00:58:59.9 | 60:53:35.2 | A | 360 |
| IC63 #15 | 00:59:04.2 | 60:54:10.2 | A | 300 |
| IC63 #14 | 00:59:07.4 | 60:53:26.4 | A | 720 |
| IC63 #5 | 00:59:08.0 | 60:53:50.7 | A | 660 |
| IC63 #11 | 00:59:10.7 | 60:53:19.0 | A,T | 300 |
| IC63 #8 | 00:59:15.2 | 60:53:33.4 | A | 300 |
| IC63 #51 | 00:59:18.4 | 60:55:34.9 | T | |
| IC63 #52 | 00:59:22.7 | 60:53:06.1 | A | 180 |
| IC63 #63 | 00:59:25.5 | 60:55:18.9 | A | 600 |
| IC63 #75 | 00:59:54.6 | 60:57:42.5 | A,T | 300 |
Note. aThe tabulated exposure times are for the ALFOSC observations and refer to exposure time per HWP position.
Download table as: ASCIITypeset image
Additionally, we acquired five-band photo-polarimetry for five stars with the TURPOL instrument on the same telescope in 2007 November 3–6. The TURPOL instrument provides simultaneous measurements in five pass-bands emulating the UBVRI system, by using four dichroic filters to split the light into the different spectral regions (Piirola 1988). The instrument was used in linear polarimetry mode. The HWP was rotated in 22.5 degree steps, with one complete observation of linear and circular polarization consisting of eight HWP steps. Three stars (#11, 75 and 76) were observed in common for both runs.
All the data were calibrated using observations of polarized (HD 204827 and HD 25443) and unpolarized (HD 174160) standard stars (Turnshek et al. 1990). The spectral reduction and extraction of the ALFOSC data were accomplished using standard procedures in the IRAF environment. The ordinary (o) and extra-ordinary (e) spectra for each HWP setting were then used to derive the polarization parameters by fitting the wavelength dependent function (o−e)/(o+e) to a cosine function of the HWP angle. The TURPOL data were reduced using well-established stand-alone programs (Piirola 1973). For those stars where both ALFOSC and TURPOL data exist, the two data sets, with few exceptions, gave results consistent within propagated 1σ uncertainties (see Table 2).
Table 2. Polarimetry Results
| Star/Filter | λc | Δλ | p | θ |
|---|---|---|---|---|
| (μm) | (μm) | (%) | (deg; E of N) | |
| IC63 #70 | ||||
| U | 0.36 | 2.77 ± 0.07 | 87 ± 1 | |
| B | 0.44 | 3.02 ± 0.05 | 88 ± 1 | |
| V | 0.54 | 3.11 ± 0.07 | 89 ± 1 | |
| R | 0.69 | 2.91 ± 0.05 | 90 ± 1 | |
| I | 0.83 | 2.61 ± 0.09 | 91 ± 1 | |
| H | 1.65 | ... | ... |
Only a portion of this table is shown here to demonstrate its form and content. A machine-readable version of the full table is available.
Download table as: DataTypeset image
Imaging polarimetry in the NIR H-band (1.6 μm) was conducted on the UT nights of 2008 September 15 and 2011 December 12, using the 1.8 m Perkins Telescope operated by the Lowell Observatory outside Flagstaff, AZ. Observations employed the Mimir instrument (Clemens et al. 2007), which images a 10 × 10 arcmin field of view onto a 10242 pixel Aladdin III detector array at 0.58 arcsec pixel−1. For H-band polarimetry, the instrument optical path includes an Mauna Kea Observatories (MKO) H-band filter (Tokunaga et al. 2002), a PK50 short pass filter (to block λ > 2.7 μm), a cold fixed wire grid, and a cold HWP which is stepped between images. Observations of IC 63 consisted of a set of "short" exposures, each 0.4 s duration, and three (2008) or four (2011) sets of "long" exposures, each of 10 s duration. For each set, 16 images were obtained, each through a different orientation of the HWP, separated by 225. After each group of 16 images, the telescope moved to another "dither" position and the 16 exposures were repeated. This continued for a total of 6 dither positions, yielding 96 images per observation set. The short set was reduced using the standard processing pipeline developed for the Galactic Plane Infrared Polarization Survey (Clemens et al. 2012a). The individual long sets were similarly reduced with the same software, including final combining of all long observations. Stellar polarimetric values and uncertainties were extracted from the dither-combined images and corrected for instrumental polarization, efficiency, and HWP offset effects (Clemens et al. 2012b). The four data sets (two short, two long) were combined into a single list by matching duplicate observations and computing weighted mean Stokes Q, U, and the resulting P and P.A. values. All stars with S/N > 2.5 were retained, as were significant upper limits, those with σP < 0.5%, totaling 110 entries that ranged in mH from 6.9 through 15.3 mag. The weighted mean H-band polarization is 1.00% ± 0.02% and the weighted mean P.A. is 882 ± 07. The unweighted P.A. for the 79 stars with S/N > 5 is 866 with a standard deviation of 156.
2.2. Visual Photometry
CCD photometry in the ugriz system was acquired using the Sloan Digital Sky Survey (SDSS) 20 inch calibration telescope at the Apache Point Observatory on 2006 October 27, 28, 29, and 31 and 2006 November 13 and 16 under photometric conditions. The data were reduced using the SDSS pipeline process. The SDSS colors were transformed into the Johnson UBV system using the relations in Jester et al. (2005).
2.3. Near Infrared Imaging
Deep narrow-band imaging of the 2.122 μm 1–0 S(1) line of molecular hydrogen (total exposure time of 4800 s), together with KS broad-band imaging (total exposure time of 1720 s), were acquired using the WIRCam instrument (Puget et al. 2004) at the Canada–France–Hawaii Telescope (CFHT) in queue observing mode during 2008 August 12–September 14. The narrow-band continuum filter associated with the H2 1–0 S(1) filter was not installed at the time of these observations, so the KS filter was used to estimate the continuum contributions to the nebular emission (see below). The data were pipeline-reduced at the observatory. The resulting images were mosaicked and stacked, using custom routines, at which time a remnant background intensity was removed. Photometric calibration was achieved using several hundred 2MASS (Skrutskie et al. 2006) stars in the observed field. Using the zero magnitude flux given in the 2MASS explanatory supplement (Cohen et al. 2003), the measured S(1) intensity distribution was placed onto a physical flux scale.
3. ANALYSIS
3.1. Polarimetry Analysis
Based on the spectro-polarimetry from ALFOSC, we produced polarimetry for a set of synthetic "narrow-band filters," with a typically spectral width of 0.05 μm. For spectral regions with faint stellar fluxes where the polarimetry signal-to-noise ratios (S/Ns) in such a band was below three, we broadened the spectral width (see Table 2). For ease of comparison between the two optical polarimetry data sets, we also generated synthetic V-band polarimetry from the ALFOSC data, which is listed in Columns 4 and 5 of Table 3. Figure 2 shows the distribution of NIR narrow-band traced H2 fluorescence in IC 63, overlaid by the V-band polarization vectors of the background stars and the CO J = 2–1 contours from Polehampton et al. (2005). The CO data is a image overlay only (contour-levels were not explicitly provided by Polehampton et al. 2005) and will only be used here in a qualitative sense.

Figure 2. Intensity through a narrow-band filter centered on the H2 1–0 S(1) line at 2.122 μm overlaid with synthesized V-band polarization vectors (white bars). The length of each vector represents the degree of polarization (a 1% scale bar is shown in the lower right corner). The orientations of the vectors represent the equatorial position angles of the polarization. The white contours show the CO (J = 2–1) emission from Polehampton et al. (2005; see the text). North is up and East is to the left. The numbers next to each vector match the star numbers given in Table 1.
Download figure:
Standard image High-resolution imageTable 3. Observational Results
| Star | V | Sp. Classa | pV | EPA | RV | AV | d | I(H2) × 10−6 |
|---|---|---|---|---|---|---|---|---|
| (mag) | (%) | (deg) | (mag) | (mag) | (kpc) | (erg cm−2 s−1 sr−1) | ||
| IC63 #70 | 13.50 ± 0.01 | ... | 3.10 ± 0.10 | 88.9 ± 0.9 | ... | ... | ... | <1.4 |
| IC63 #68 | 14.08 ± 0.01 | F7 V (1) | 2.38 ± 0.05 | 88.2 ± 0.6 | 2.35 ± 0.10 | 2.21 ± 0.06 | 0.3 ± 0.1 | 0.07 ± 2.8 |
| IC63 #76 | 15.39 ± 0.01 | G2 V (1) | 2.60 ± 0.11 | 89.9 ± 1.2 | 2.04 ± 0.19 | 0.88 ± 0.05 | 0.9 ± 0.1 | 0.8 ± 3.3 |
| IC63 #43 | 16.76 ± 0.01 | F6 V (1) | 3.44 ± 0.26 | 89.7 ± 2.2 | 2.04 ± 0.19 | 1.39 ± 0.14 | 2.2 ± 0.2 | 0.8 ± 2.9 |
| IC63 #46 | 16.18 ± 0.01 | A7 V (1) | 0.87 ± 0.37 | 110 ± 12 | 2.05 ± 0.15 | 2.04 ± 0.13 | 2.4 ± 0.2 | 40.2 ± 4.8 |
| IC63 #15 | 16.70 ± 0.01 | F9 V (2) | 3.03 ± 0.34 | 91.3 ± 3.2 | 1.58 ± 0.10 | 1.57 ± 0.09 | 1.5 ± 0.3 | 1.4 ± 3.0 |
| IC63 #14 | 16.92 ± 0.10b | G9 V (1) | 3.13 ± 0.43 | 94.6 ± 4.0 | 1.06 ± 0.92 | 1.32 ± 0.15 | 1.0 ± 0.1 | 4.3 ± 2.8 |
| IC63 #5 | 17.77 ± 0.02 | G3 V (2) | 4.06 ± 0.32 | 76.3 ± 2.2 | 7.54 ± 1.09 | 3.94 ± 0.10c | 0.6 ± 0.1 | 13.0 ± 4.7 |
| IC63 #11 | 15.26 ± 0.01 | F6 V (1) | 4.58 ± 0.13 | 91.0 ± 0.8 | 2.24 ± 0.20 | 1.59 ± 0.13 | 1.0 ± 0.1 | 12.6 ± 4.5 |
| IC63 #8 | 16.37 ± 0.01 | F4 V (1) | 5.85 ± 0.21 | 86.9 ± 1.0 | 2.89 ± 0.18 | 2.12 ± 0.11 | 1.4 ± 0.1 | 21.7 ± 2.8 |
| IC63 #51 | 13.85 ± 0.01 | ... | 1.77 ± 0.13 | 64.9 ± 2.1 | ... | ... | ... | 4.2 ± 2.9 |
| IC63 #52 | 14.81 ± 0.01 | F0 V (1) | 3.33 ± 0.19 | 88.2 ± 1.6 | 2.63 ± 0.17 | 1.70 ± 0.07 | 1.2 ± 0.2 | <1.8 |
| IC63 #63 | 16.85 ± 0.01 | A5 V (2) | 2.84 ± 0.28 | 91.9 ± 2.9 | 2.70 ± 0.18 | 2.81 ± 0.09 | 2.6 ± 0.4 | 0.3 ± 2.8 |
| IC63 #75 | 12.43 ± 0.01 | A2 V (2) | 2.88 ± 0.24 | 94.3 ± 2.4 | 2.69 ± 0.99 | 1.02 ± 0.27 | 1.1 ± 0.2 | <2.1d |
Notes. aEstimated uncertainties, in sub-classes, are given in parenthesis. bFor IC 63 #14, BV photometry are taken from NOMAD (Zacharias et al. 2005). cThe nominal derived value of RV for target #5 is significantly above the average of the remaining targets. If we use the average value of the remaining targets 〈RV〉 = 2.27 ± 1.09, the visual extinction for the target becomes AV = 1.18 ± 0.10. dFor #75, the upper limit is 2σ.
Download table as: ASCIITypeset image
To provide context of the magnetic field and polarization of the nebula, Figure 3 shows the measured H-band polarization from the Mimir observations overlaid on a gray-scale and contour map of WISE (Wright et al. 2010) emission in the region. The gray-scale image represents WISE Band 1 (3.4 μm) and traces the stellar emission and diffuse reflection, while the contours are based on WISE Band 4 (22μ), which traces the hot dust. The red vectors are Mimir H-band polarimetry of stars with S/N > 2.5, red circles indicate stars with S/N < 2.5 but σP < 0.5%.

Figure 3. H-band Mimir polarization shows an ordered magnetic field over the extended region containing the nebula. The gray-scale corresponds to WISE band 1 (3.4 μm) emission, while the contours represent WISE band 4 (22 μm) emission. Numbered vectors correspond to entries in Table 1. Note that in the figure, only polarization measurements that achieved S/N > 2.5 have been marked.
Download figure:
Standard image High-resolution image3.2. Spectral Classification
The Stokes I (intensity) components of the ALFOSC spectra were used, together with a standard star sequence (Jacoby et al. 1984), to derive spectral classes for each target star, though the data are generally not sufficient to allow unique assignment of luminosity classes. All stars have therefore been assumed to be main sequence. However, the errors introduced in deriving visual extinctions due to this uncertainty should be small. For stars with spectral classes F or earlier, the intrinsic colors of classes V and III are very similar. In addition, any early G star observed is likely on the main sequence, as such giants would fall in the Hertzsprung-gap, which is empirically very sparsely populated (Jaschek & Jaschek 1988). For the one late G star in our sample, a luminosity class of III (giant) would statistically be more likely. If this star were to be on the giant sequence, its visual extinction would decrease from 1.3 to 0.9, which would not significantly affect the results. Intrinsic colors for the stars were extracted, based on the spectral classification, from the Bessel & Brett tables (Bessell & Brett 1988).
3.3. Photometry Analysis
The derived apparent B − V colors for the target stars (based on the ugriz photometry), together with KS photometry from the 2MASS survey, and the intrinsic colors were used to calculate the total-to-selective extinction (RV) by employing the relation RV = 1.12 × E(V − K)/E(B − V) + 0.02 (Fitzpatrick 1999). Based on these values of the total-to-selective extinction and the color excess EB − V, the visual extinction (AV) toward each target star (cf., Andersson & Potter 2007) was calculated. These derived RV and AV values are listed in Table 3.
To derive the diffuse NIR fluxes at the location of each of the program stars without introducing artificial processing errors (e.g., from imperfect stellar subtractions), we used aperture photometry in concentric annuli surrounding the program stars. Each annulus was three, 0.306 arcsec, WIRCam pixels wide. The inner radii of the annuli were chosen to be as small as possible while excluding the flux from the wings of the stellar PSF to the level of the background flux. Empirically, for stars of KS > 12.5, an inner annulus radius of 9 pixels was sufficient. For brighter stars, we found the following inner radii: For 12.5 > KS > 12 an inner radius of 12 pixels was needed, for 12.0 > KS > 11.0; 15 pixels, and for 11.0 > KS > 10.0, 18 pixels was used.
The random photometric uncertainties for both the H2 and KS filters were determined from aperture photometry of 20 faint, isolated stars surrounding the nebula, each with a 3 pixel wide annulus with an inner radius of 9 pixels. We used the square root of the average of the variances of these 20 stars as our random error on the photometry. Since the nebular emission (particularly in regions of intense H2 fluorescence) is likely to show true variations across relatively small regions, we estimated the systematic uncertainties for each region, for both filters, by measuring the average surface brightness for three annuli per star, each 3 pixels wide. In addition to the nominal rinner, we utilized rinner + 1 and rinner + 2. The standard deviation of these three measurements was adopted as the systematic uncertainty for each observation. The root-mean-square of the random and systematic uncertainties, thus derived, were finally calculated.
To calculate the continuum contribution in the diffuse light seen through the narrow-band filter, we assume that the diffuse emission in the KS filter is dominated by the line emission from H2 1–0 S(1) and a constant continuum reflection term. Then, because the relative wavelength widths of the H2 and KS filters are known, and because the KS filter fully encompasses the H2 filter, we used the KS images to subtract any diffuse continuum emission (e.g., from scattered light) from the narrow-band data through the equation:
F(KS) is the flux in counts per seconds seen in the KS filter, F(H) is the flux seen in the narrow-band filter, Δλ(X) are the filter widths and F(H2) is the continuum-corrected H2 flux. We found that the majority of the extended emission seen in the KS-band images is indeed H2 line emission, at least around those stars showing significant diffuse emission. Although the 2–1 S(1) line also falls within the KS filter bandwidth, the relative line intensities (Luhman et al. 1997) and the relative filter widths means that the error introduced in the derived 1–0 S(1) line flux should be minor.

To test our flux calibration of the NIR imaging, we used the PSF fitting routines in the DAOPHOT package in IRAF to subtract all stars within a 73 arcsec circular aperture, to mimic the Fabry–Perot observations of Luhman et al. (1997) in both the H2 and KS images. We integrated the diffuse fluxes measured within this circular area. Our net H2 flux (1.2 ± 0.2) × 10−12 erg cm−2 s−1 is marginally consistent with the value (0.46 ± 0.06) × 10−12 reported by Luhman et al. (1997). Because all of our measurements are made on a single image generated from dithered observations, the relative calibration across our image should be very good. This is supported by the small dispersion of the flux-calibration relationship between catalog and extracted magnitudes for the 2MASS stars used in the flux calibration.
Fluorescence should be a surface phenomenon, since the FUV radiation required will be rapidly extincted going into the cloud (France et al. 2005). This is supported by the spatial distribution of H2 fluorescence seen in Figure 2, where it primarily follows the outline of the cloud as traced by the CO emission. To test this, we plot the observed 1–0 S(1) H2 line intensity as a function of the visual extinction in Figure 4. No statistically significant correlation is seen, indicating that the line emission is indeed a cloud surface phenomenon and not a column density one.

Figure 4. H2 1–0 S(1) intensity for the regions immediately surrounding the stars in Table 1, plotted as a function of visual extinction toward those stars. Star #5 is show for AV calculated with the nominal value of RV as the solid diamond and for the average RV of the sample with the yellow diamond. Yellow triangles correspond to upper limits of the H2 fluorescence. No correlation appears to be present.
Download figure:
Standard image High-resolution image4. RESULTS
4.1. Line of Sight Extinction
While the derived values of RV (Table 3) are somewhat smaller than the standard ISM value of RV = 3.1, most are in a narrow range with moderate uncertainties. Excluding target #5, 〈RV〉 = 2.2 ± 0.5. The value for IC 63 #5 is anomalous at 7.54 ± 1.1. This could be due to a very red, unidentified companion or, since this sightline probes the most central part of the cloud (Figure 2), could signify that large grains remain in the former cloud core (Jansen et al. 1995; Weingartner & Draine 2001; Román-Zúñiga et al. 2007). The main results of this study are not affected by this uncertainty.
First, we need to establish that most of the visual extinction measured for our target stars originates in IC 63. This is because the target stars are faint, and therefore at large distances behind IC 63, and because we only have tracers of the gas column density with which to compare our visual (dust) extinction measurements for a limited region (e.g., CO from Jansen et al. 1994; Polehampton et al. 2005).
Consistent with the high arm:inter-arm density contrast for Galactic spiral arms noted by Heyer & Terebey (1998) and Ungerechts et al. (2000), an extinction-distance diagram based on Hipparcos data shows a single extinction layer at the distance of IC 63 with no evidence of additional extinction out to the limit of the Hipparcos/Tycho sample at ∼600 pc (Figure 1). Using our derived spectral classification and photometry, spectroscopic parallaxes for most of our target stars locate them in the inter-arm region between the local and Perseus arms.
While the extents of the CO maps are smaller than the size of the visual nebula and distribution of our target stars, a comparison of the visual extinction (Table 3) with the CO J = 2–1 map of Polehampton et al. (2005) shows a general consistency (Figure 2). Also, the largest AV value (target #5) is located toward the secondary maximum in the CO map, assuming that its nominal RV is correct. If the average RV for this target is more appropriate, the next highest value of AV (#63) is located somewhat farther in (away from γ Cas) but still in the inner part of the nebula as seen by the WISE 22 μm map (Figure 3).
4.2. Fractional Polarization
The polarization position angles for the stars in both the optical and H-band samples show an ordered magnetic field, consistent also with synchrotron measurements in the area (Sun et al. 2007). While both Sun et al. (2007) and Wolleben et al. (2006) argue that the main part of the polarized radio emission originates in the background Perseus arm, our observations show that the ordered magnetic structure exists much nearer to the Sun, including the Sharpless 185 H ii region of which IC 63 is a part. Note that since the Galactic longitudes of IC 63 and the North Celestial Pole differ by less than one degree, the polarization position angles in equatorial and Galactic coordinates differ by less than two degrees. Thus, the observed polarization is fully consistent with the general disk-parallel Galactic field (e.g., Mathewson & Ford 1970).
The plot of V-band polarization levels versus H2 line intensities (Figure 5) shows that the polarization is enhanced for high intensity H2 fluorescence (I > 10−5 erg cm−2 sr−1). This is the signature of H2 formation driven dust grain alignment. For lower fluorescent intensities (I < 10−5 erg cm−2 sr−1) no correlation is seen, possibly indicating that up to this formation rate direct RAT alignment dominates.

Figure 5. Probable correlation between V-band polarization and the diffuse H2 fluorescence in IC 63 is seen in the data. Triangles indicate upper limits for the fluorescence. The point at the lower right corresponds to star #46, which is located behind the compression ridge of the nebula and likely probes material with elevated collisional disalignment (see the text). The dashed line shows the best weighted linear fit to the data, excluding star #46.
Download figure:
Standard image High-resolution imageThe point at (I, p) ∼ (4.1 × 10⁻⁵, 0.8) in the plot corresponding to star #46 might seem to contradict the general result. However, as discussed in Section 5.2, this outlier experiences enhanced collisional disalignment as it probes the locally hot and dense material in the γ Cas-facing compression ridge of the nebula.
The dashed line in the Figure 5 is a weighted fit to the data points with measured 0 < I(H2) < 3 × 10⁻⁵ erg cm−2 sr−1) which yields:

with a Pearson R coefficient of 0.89. While acknowledging that we have excluded target #46 from the fit and that only three of the remaining points are significantly offset from the "clump" around I(H2) ≈ 0, we find that if we eliminate any one of these three "high p" targets (#5, #8, and #11), the resultant fit coefficients are unaffected within 1.5σ mutual uncertainties from the values in Equation (4).
Figure 6 shows the fractional polarization, overlaid with a power-law fit to the data, from which the four high-fluorescence targets have been excluded. This fit represents the average grain alignment for regions without evidence for either extreme collisional rates or high H2 formation driving. The exponent of the power-law (−1.1 ± 0.1) is significantly steeper than that (−0.52 ± 0.07) seen in the general ISM (Whittet et al. 2008). The fractional polarization for target #5 is located in the middle right. If, instead of the nominal RV = 7.54, we use the average value of RV from the remaining lines of sight to calculate the visual extinction for this target, the point moves to the upper left. Note in both cases that the point lies significantly above the power-law fit. Targets #51 and #70 were only observed with TURPOL in photo-polarimetry. We hence do not have spectral classifications or visual extinctions for these stars.

Figure 6. Fractional polarization (p/AV) vs. extinction (AV) shows a steeper drop with visual extinction than that found in the general ISM (−0.52 ± 0.07; Whittet et al. 2008). The dashed line represent the best-fit power-law with the four high-fluorescence lines of sight excluded (yellow symbols). Note that whether calculated with the nominal value of RV, or the average value from the remaining targets, the fractional polarization of target #5 lies well above the line. Since targets #51 and #70 were only observed with five-band photo-polarimetry, we do not have spectral classifications, and hence extinctions, for these two targets. Hence, they do not appear in this plot.
Download figure:
Standard image High-resolution image4.3. Wavelength Dependence of Polarization
The wavelength dependence of the polarization for the target stars is given in Table 2. The wavelength dependences for all targets except #46 are well-described by Serkowski curves (Table 4). The general S/Ns of the data are not good enough to warrant the use of the K-parameter (Codina-Landaberry & Magalhaes 1976) as a free fitting parameter and it has therefore been set to the standard K = 1.15 value (Serkowski 1973). The fitted values of pmax and λmax were, however, consistent whether or not K was used as a free fitting parameter. As Table 2 shows, the position angles are consistent with a constant value for each target, again with the possible exception of #46.
Table 4. Serkowski Fit Results
| Star | pmax | λmax | 〈θ〉 |
|---|---|---|---|
| (%) | (μm) | (deg) | |
| IC63 #70 | 3.17 ± 0.05 | 0.53 ± 0.01 | 89 ± 1 |
| IC63 #68 | 2.67 ± 0.06 | 0.48 ± 0.01 | 88 ± 1 |
| IC63 #76 | 2.82 ± 0.09 | 0.52 ± 0.02 | 89 ± 1 |
| IC63 #43 | 3.92 ± 0.18 | 0.51 ± 0.03 | 90 ± 1 |
| IC63 #46a | 0.75 ± 0.31 | 0.74 ± 1.01 | 94 ± 12 |
| IC63 #15 | 3.22 ± 0.25 | 0.55 ± 0.07 | 86 ± 2 |
| IC63 #14 | 3.54 ± 0.28 | 0.54 ± 0.06 | 95 ± 2 |
| IC63 #5 | 4.36 ± 0.15 | 0.60 ± 0.03 | 76 ± 1 |
| IC63 #11 | 4.97 ± 0.09 | 0.54 ± 0.02 | 90 ± 1 |
| IC63 #8 | 6.37 ± 0.16 | 0.55 ± 0.02 | 85 ± 1 |
| IC63 #51 | 1.81 ± 0.06 | 0.55 ± 0.03 | 65 ± 1 |
| IC63 #52 | 3.59 ± 0.10 | 0.54 ± 0.02 | 88 ± 1 |
| IC63 #63 | 3.06 ± 0.14 | 0.53 ± 0.04 | 92 ± 1 |
| IC63 #75 | 3.07 ± 0.12 | 0.55 ± 0.07 | 91 ± 1 |
Note. aSee the Appendix for details.
Download table as: ASCIITypeset image
While the polarization data for target #46 are noisy and of marginal significance, for illustrative purposes, we modeled it by a combination of Serkowski and scattering terms. Since both Mie scattering in the small grain size limit ("Rayleigh limit"; cf. Krügel 2003) and nominal Rayleigh scattering (due to polarizable molecules; e.g., Jackson 1975) shows a wavelength dependence of λ−4, we will refer to this component as the "Rayleigh" term. We note, however, that the data do not exclude a more negative power-law exponent. Assuming either of these two physical mechanisms and given that we detect a diffuse H-band emission in the compression ridge region, an origin for the non-Serkowski component in dust scattering is likely. That the power-law term originates in the nebula, rather than being intrinsic to the background star is shown by the combination of the data for targets #46 and #76 and the diffuse H-band emission, as detailed in the Appendix. A simultaneous Stokes (q, u) fit for target #46 yields polarization parameters: pmax = (0.75 ± 0.31)%, λmax = (0.74 ± 1.01) μm, θS = (94 ± 12)°, cR = (0.05 ± 0.03)% and θR = (131 ± 24)°, where cR is the amplitude of the scattering term and θS and θR are the position angles for the Serkowski and scattering terms, respectively. We note that the Serkowski and scattering position angles derived are, respectively, consistent with the general magnetic field in the nebula and the orientation of the radius vector between γ Cas and IC 63. That a Rayleigh term is seen in the final spectrum for target #46, even though the extraction of the ordinary and extraordinary spectra were accompanied by, and nominally corrected for, the "sky spectra" indicates that the scattered light varies rapidly across the sub-region around IC 63 #46. This is consistent with the narrow extent of the diffuse H-band emission seen in the nebula (Figure 9).
4.4. The 3D Location of the Nebula
In addition to the Hipparcos parallax to the star and assuming a physical connection between γ Cas and IC 63, we can use extinction mapping to locate Sh-II 185 along the line of sight. In Figure 1, we show the measured extinctions of stars within 1° of IC 63 in the Hipparcos (Perryman et al. 1997) and Tycho (Høg et al. 2000) catalogs. A step in the visual extinction is seen at ∼200 pc. No further step is seen in the extinction out to the depth of the plot, approximately 0.6 kpc.
As the exciting star, γ Cas is situated outside the nebula (about 20 arcmin to the west-southwest), the PDR and associated fluorescence appear mainly located on the surface of the nebula most illuminated by γ Cas. Examining the distribution of the diffuse H2 fluorescence, a number of coherent "streamers" are seen to originate from the brightest regions (Figure 7). These streamers appear to be oriented at significantly steeper position angles than the projected radius vector from γ Cas to the nebula. The projected radius vector makes an angle of ∼30° with lines of constant declination (i.e., P.A. ∼ 60° E of N). The streamers, in contrast, make angles of about 48° (i.e., P.A. ∼ 42° E of N).

Figure 7. Narrow-band emission in the 1–0 S(1) line of H2 (same as Figure 2) overplotted with lines paralleling several "streamers" seen in the emission. Several of these"streamers" can be seen to originate from the main regions of H2 fluorescence. These form steeper angles with the horizontal than the projected radius-vector to γ Cas (yellow arrow). If this difference in angles is due to projection effects, then the nebula-to-γ Cas-vector makes an angle of 58° with respect to the plane-of-the-sky.
Download figure:
Standard image High-resolution imageIf this difference is due to projection (i.e., that the nebula and the star are at different distances), then, from geometry, the line between the star and nebula makes an angle of ∼58° with respect to the plane of the sky. The position angle of the "Rayleigh" term in the solution for the polarization toward IC63 #46, θR = 131° ± 24° east of north, is consistent with this interpretation as being scattered at a 90° angle from the illumination direction.
5. DISCUSSION
The radiatively driven grain alignment theory has by now faced and met a number of observational challenges, including decreasing alignment with increasing opacity (Andersson & Potter 2007; Whittet et al. 2008; Jones et al. 2011), enhanced alignment close to localized radiation sources (Andersson & Potter 2010; Matsumura et al. 2011), and a dependence on the angle between the radiation anisotropy and the magnetic field (Andersson et al. 2011). The results presented herein are fully consistent with RAT alignment. Because the torques from "Purcell rockets" were originally introduced in the context of paramagnetic relaxation alignment, we discuss the effect of such torques in the RAT paradigm and how our results can be interpreted in the RAT context. We then discuss the implications of our results for the balance between grain alignment and disalignment. Finally, we discuss the location of the IC 63 nebula relative to its illuminating star, γ Cas.
5.1. Dust Grain Alignment due to H2 Formation
Our observations show enhanced polarization for three out of four line of sight probing locations of enhanced H2 1–0 S(1) line emission. The fourth probes a region of significantly enhanced gas-grain collision rates. Thus, our observations provide evidence for grain alignment driven by H2 formation. To evaluate the implications of these results under the radiative alignment paradigm, we compare our results to the detailed predictions of RAT theory in two ways: (1) spatial variations of the magnitude of alignment, and (2) the wavelength dependence of the polarization.
5.1.1. Variations in Alignment Efficiency
Figure 5 indicates that the H2 formation torques contribute significantly, compared to the RAT torques, only at high H2 formation rates. This is consistent with the alignment models by Hoang & Lazarian (2009). Detailed modeling of the grain alignment in IC 63 is deferred to a separate paper (T. Hoang et al. 2013, in preparation), but here we present a qualitative argument for this consistency.
Figure 3 of Hoang & Lazarian (2009) plots the relative importance of RAT and H2 formation torques for various grain sizes under "normal" diffuse cloud conditions and shows that H2 pinwheel torques dominate for almost all grain sizes, at least for grains with a small number of active sites.
To adapt this plot to the case of IC 63, we note that, according to Equations (10) and (13) of Hoang & Lazarian (2009), both RATs and H2 pinwheel torques are, to first order, linear in the radiation field strength. However, (1) the radiation field in the nebula is significantly enhanced (× 650) compared to the diffuse interstellar field, and (2) the opacity per unit column density for the radiation responsible for RAT and H2 formation torques are very different.
The RAT torques are dominated by the coupling to light with wavelengths of the order of, or slightly larger than, the grain size. Hoang & Lazarian (2009) use 1.2 μm as the characteristic wavelength for the RAT driving. To dissociate an H2 molecule requires radiation with a wavelength shortward of 1108 Å. Since the interstellar extinction curve rises very steeply into the blue and UV (Cardelli et al. 1988), the opacity for H2 dissociating photons per unit column density is much larger than that for RAT torques. Using the extinction curve data from Cardelli et al. (1988), unit extinction at λ = 1100 Å is reached at AV ≈ 0.25 mag, or equivalently: Apinwheel/AV ≈ 4.0. This ignores self-shielding in the H2 lines (van Dishoeck & Black 1986) which will make the effective dissociating opacity even larger. Adopting λ = 1.2 μm as characteristic for the RAT alignment, the ratio of the opacities for H2 formation torques and RAT photons, ARAT/AV is 0.28, hence Apinwheel/ARAT ≈ 14.
In Figure 3 of their paper, Hoang & Lazarian (2009) compare the importance of RAT and H2 formation torques as a function of grain size, assuming a nominal strength interstellar radiation field. As they show, the relative importance of the H2 torques depends strongly on the density of active (chemisorption) sites on the grain. For small grains (a < 0.1 μm), H2 torques should dominate. As the RAT driving rises more steeply with grain size than that from pinwheel torques, the RAT alignment may dominate for larger grain sizes, depending on the density of active sites, even at a nominal interstellar radiation field strengths.
To estimate the relative importance of RAT and H2 torques in IC 63, we must raise the "RAT, ISRF" curve in Figure 3 of Hoang & Lazarian (2009) by a factor of 650, noting that the RAT driving will vary only slowly with column density due to its relatively long wave cut-off. The radiative driving of the H2 torques will be much more sensitive to the column density. For material at AV ≳ 1, the effectiveness of the H2 pinwheel torques will not be elevated from the values appropriate for the diffuse ISM given in the figure in Hoang & Lazarian (2009). Under such conditions of substantial extinction, RAT torques dominate for all grains larger than a radius ∼0.05 μm and H2 formation would add very little to the alignment.
For smaller visual extinctions, also the H2 torques will be elevated by some fraction of the unattenuated radiation field strength and thus regain some of their relative importance for the grain alignment. For the grain sizes generating the optical polarization (∼0.2 μm; Kim & Martin 1995), the "H2 pinwheel torque" (single active site per grain) line in Figure 3 of Hoang & Lazarian (2009) would have to be raised by about a factor 40 to equal the RAT alignment at G = 650. This corresponds to a radial opacity (i.e., opacity to the incident stellar radiation—not necessarily observer's line-of-sight opacity) of AV ≈ 0.8 mag. (if each grain has more than one active site this number becomes even smaller).
Therefore, in regions of very small radial opacity where the intensity of the FUV radiation capable of dissociating H2 is still significant, but only there, H2 formation is also enhanced and can reassert the importance of pinwheel torques, even for the strong radiation field that is driving RAT alignment. Otherwise, the strong radiation field and the relatively smaller opacity for the RAT aligning photons means that direct RAT alignment alone dominates the grain alignment. Further modeling and higher S/N data will be needed to quantitatively address this scenario (cf. T. Hoang et al. 2013, in preparation).
5.1.2. Wavelength Dependence of H2 Torque Alignment
RAT theory predicts that the smallest grains should be better aligned in a medium with strong H2 formation torques than in a medium with radiative torques alone, resulting in enhanced polarization in the bluest part of the visible spectrum. To compare observations with theoretically calculated polarization spectra, we combined data from the highest quality high (targets #5, #8, and #11) and low (targets #14, #43, and #63) H2 fluorescence targets, projected onto the molecular cloud, in two averages (Figure 8, red and black diamonds, respectively). For ease of comparing models and data, we have normalized both models (Figure 8, lines) and data to pmax = 1.0 in this figure. Our modeling shows that very good fits of the RAT model to the data at wavelength longer than ≈0.55 μm can be accomplished based on reasonable model parameters (Table 5). Our current observational data in the blue part of the spectrum are not of sufficient quality to conclusively test the specific model predictions. However, the comparison of data and models shows that additional observationally testable predictions follow from the theory, namely that for regions with intense H2 formation the polarization curve should drop off significantly slower toward short wavelengths than without pinwheel torques.

Figure 8. Averages of the normalized polarization data for the high- and low-fluorescence targets are overplotted with ab initio theoretical model predictions based on RAT theory and the physical parameters of IC 63. Observed polarization data for IC 63 (diamonds) and model predictions (curves) for lines of sight probing high and low H2 formation rates are compared. High H2 formation rate data and models are shown in red, while low H2 formation rate data and models are shown in black. Models assuming RV = 3.1 are shown as full drawn lines while those assuming RV = 5.5 are shown as dashed lines. The gray shaded areas are located short ward of the atmospheric cut-off. Fit parameters are listed in Table 5.
Download figure:
Standard image High-resolution imageTable 5. Dust Grain Parameters for RAT Modeling
| Case | RV | H2 Formation Rate | amin | amax | ||
|---|---|---|---|---|---|---|
| (μm) | (μm) | (μm) | ||||
| 1 | 3.1 | Low | 0.005 | 0.3 | 0.1 | 0.4 |
| 2 | 3.1 | High | 0.005 | 0.3 | 0.07 | 1.0 |
| 3 | 5.5 | Low | 0.005 | 0.25 | 0.1 | 0.2 |
| 4 | 5.5 | High | 0.005 | 0.25 | 0.05 | 0.5 |


Download table as: ASCIITypeset image
In RAT theory, grains can be aligned both at high-J attractor and low-J attractor points (Hoang & Lazarian 2009). To characterize the stable alignment at high-J attractors in the presence of collisional randomization, we define as the minimum size of aligned grains, corresponding to J/Jth ≈ 3, where Jth is the thermal angular momentum of grains (see Hoang & Lazarian 2008). In general, depends on the magnitudes of RATs and H2 torques. When RATs are kept unchanged, decreases as H2 torques increase. Moreover, the fraction of grains of a given size a at high-J attractor points, fhighJ(a), is a function of grain size, shape, and dust composition. We can thus attempt to model the observed polarization spectrum based on the physical characteristics of the grains. In the current simple models, only an average fraction, , of grains aligned at high-J attractor points have been considered. A full discussion of the modeling will be presented in T. Hoang et al. (2013, in preparation).


Figure 8 presents the resulting polarization spectra from ab initio models, with parameters constrained to generally match the observed polarization data for high and low H2 formation rates and for different values of the total-to-selective extinction, RV. For these models, we assumed a driving spectrum of a B0 IV star, a gas density and temperature of 1 × 104 cm−3 and 300 K, respectively, and the grain size distribution of Draine & Li (2007), consisting of silicates only. The assumed total-to-selective extinctions (RV), the small and large cutoffs in the grain size distribution and the fraction of grains residing at the high angular momentum attractor point are listed in Table 5. Figure 8 shows the curves from RAT theory for the representative values RV = 3.1, shown as full drawn lines, and RV = 5.5, shown as dashed lines. High and low H2 formation rates are shown as red and black curves, respectively. Very good agreement is accomplished in the red part of the visual spectrum. The H-band polarimetry is not as well reproduced.
The models also predict significant variations, with and without H2 torques, shortward of 5000 Å, where the addition of strong pinwheel torques keeps the polarization from dropping off as rapidly as without them. The model predictions indicate that high-S/N data in the U and B bands will be able to directly probe the specific predictions of RAT theory about size dependent alignment in the presence of H2 torques.
In the RAT paradigm (Hoang & Lazarian 2009), detection of H2 formation driven enhancement of grain alignment argues against super-paramagnetic grains dominating the polarization. Such grains, particularly in an intense radiation field, should already be perfectly aligned by RAT torques alone. Hence if super-paramagnetic grains dominate the silicate grain distribution, no change should be seen in the fractional polarization when the H2 fluorescence changes, even if Purcell torques were present. Our observations of a likely correlation between p and I(H2) indicate that, assuming that the RAT alignment paradigm is valid, super-paramagnetism cannot dominate the grain population in IC 63. This result is in agreement with recent results comparing the fractional polarization to grain mineralogy in the diffuse ISM, which saw no enhancement in the polarization for grains with larger amounts of super-paramagnetic solids (Voshchinnikov et al. 2012).
5.2. Collisional Disalignment
In both the plots of polarization versus H2 fluorescence (Figure 5) and fractional polarization versus extinction (Figure 6), star #46 is a distinct outlier. This star probes the compression ridge region of IC 63, which contains particularly hot (T = 600 K; Fleming et al. 2010), high-density (n = 105–106 cm−3; Polehampton et al. 2005) gas, and should produce strongly enhanced collisional disalignment of the dust grains. This hypothesis is supported by the plot of fractional polarization versus extinction (Figure 6). Star #46 is there located well below the best-fit power-law, indicating a dearth of aligned grains, while the other high fluorescence targets lie significantly above the line.
The steep exponent, (−1.1 ± 0.1), in the power-law fit to the fractional polarization (Figure 6) indicates that the amount of polarization does not increase with increasing column density and hence that the polarization in IC 63 is generated in a relatively thin layer of material. While internal turbulence can cause a drop-off in fractional polarization with column density, such depolarization cannot generate a fall-off index as steep as −1 (Jones et al. 1992), indicating that grain disalignment is responsible. Given the intense radiation field in IC 63 as well as the contribution of H2-formation torques, this is most likely a result of enhanced disalignment. While the temperature of the gas in IC 63 is similar to that in diffuse clouds and in the outer layers of quiescent molecular clouds, T ≈ 80 K (Rachford et al. 2009), the gas volume density is about two orders of magnitude larger than for a molecular cloud periphery. As Equation (1) shows, collisional disalignment is therefore much more rapid in IC 63 than in diffuse molecular gas, which would explain the steep fall off in grain alignment with extinction.
5.3. The Location of the Nebula
Both the orientations of the H2 fluorescent "streamers" (Figure 7) and the position angle of the Rayleigh scattering component seen toward star #46 indicate that the nebula is not at the same distance as γ Cas. Instead, the line between the star and nebula forms an angle of ∼58° with the plane of the sky, as noted in Section 4.4.
In their two-dimensional modeling of IC 63, Jansen et al. (1995) show that a cometary nebula, offset from the plane of the sky, is a viable explanation for the observed abundances (their model "T3"—their nominal models are based on plane-parallel slabs assumed to be at a distance to the illuminating star corresponding to the projected distance between the star and nebula). The internal scattering of the UV radiation from the sides of the nebula toward its center, in the T3 case, compensates for the larger distance from the star, compared to the one-dimensional models, which are assumed to lie in the same plane as γ Cas. In the T3 model, Jansen et al. (1995) assumed an angle of 30° with respect to the plane of the sky, but noted that, at that inclination: "... [the models] cannot explain the extended C+ and C emission at the tail end of the cloud. [...] a model like T3, but with a larger inclination with respect to the plane of the sky, could solve this problem" Jansen et al. (1995, p. 239).
Since the projected angular distance between the nebula and γ Cas is ∼19.7 arcmin and the Hipparcos parallax for γ Cas gives a distance of ∼188 ± 20 pc, we find that the true distance from the star to the nebula is about 2 pc. Excitation and chemistry models of IC 63 (e.g., Jansen et al. 1995; France et al. 2005) require a number of assumptions, including geometry, internal scattering and self-shielding, but are, as noted by Jansen et al. (1995), consistent with this star-nebula distance.
The projection geometry cannot address whether the nebula is on the near or far side of the star, but we can make a plausibility argument from the kinematics of the sources. The H i data of Blouin et al. (1997) show that the LSR center velocity of neutral hydrogen in the nebula is ∼+1 km s−1, consistent with the molecular lines observed by Jansen et al. (1994). The apparent radial velocity of γ Cas is quite variable due to time dependence in the stellar spectrum, but at the time of the Blouin et al. (1997) observations (1992), showed vLSR ∼ −10 km s−1 (Nemravová et al. 2012), while it is vLSR ∼ −2 km s−1 at the present time. Both of these stellar radial velocities are bluer than the H i velocity. If we assume that that the H i velocity is also partly a flow due to the impact of the stellar radiation from the star (as the H2 "streamers" imply), this would indicate that the nebula is located beyond the star.
6. CONCLUSIONS
We have performed multi-wavelength polarimetry and photometry of background stars and H2 1–0 S(1) imaging of the emission from the reflection nebula IC 63. These observations probe the influence of H2 formation torques on the alignment of the dust grains in the nebula. Grain alignment is enhanced in nebular regions showing strong H2 fluorescence, as shown by a correlation between polarization and intensity of the H2 1–0 S(1) line emission. We caution that the limited S/N of some of our data and the presence of an outlier point means that these results should be confirmed by additional observations before they can be viewed as conclusive. The connection between the fluorescence associated with H2 formation and a dust grain dynamical effect (alignment) also provides direct experimental evidence that molecular hydrogen in the ISM is formed on grain surfaces.
Such "Purcell alignment" was thought to be one of the main drivers of alignment in the paramagnetic relaxation paradigm, which dominated grain alignment theory over much of the last half century. However, paramagnetic relaxation is no longer a viable alignment mechanism, and several other lines of observational evidence point to radiative torque (RAT) alignment as the explanation of interstellar polarization. H2 formation torques do play an important, albeit secondary, role in RAT theory. We argue that the enhancement of the polarization by H2 formation can be understood in the RAT paradigm. We have performed initial RAT-based modeling of the wavelength dependence of the polarization and find agreement with the new observational data in the red part of the optical spectrum. These models predict a distinct enhancement of the polarization shortward of ∼0.5 μm for alignment including H2 formation, leading to pinwheel ("Purcell rocket") torques. While our present data at these wavelengths are insufficient to differentiate among the models, such observations are well within the capabilities of 4+ m telescopes with modern polarimeters.
For 10 of the 14 star sample, we find a steep drop in fractional polarization (p/AV) with column density, consistent with the polarization being generated only in a relatively thin surface layer, possibly due to collisional disalignment as the external radiation field decays with extinction deeper in the warm, dense, nebula.
We gratefully acknowledge the generous telescope allocations by the review committees of the NOT and CFHT and the expert support by the observatory staffs of the facilities.
The data presented here were obtained in part using the Nordic Optical Telescope (NOT) with ALFOSC, which is provided by the Instituto de Astrofisica de Andalucia (IAA) under a joint agreement with the University of Copenhagen and NOTSA.
Based also, in part, on observations obtained with WIRCam, a joint project of the Canada-France-Hawaii Telescope (CFHT), Taiwan, Korea, Canada, France. The CFHT is operated by the National Research Council (NRC) of Canada, the Institute National des Sciences de l'Univers of the Centre National de la Recherche Scientifique of France, and the University of Hawaii.
This research was conducted also, in part, using the Mimir instrument, jointly developed at Boston University and Lowell Observatory and supported by NASA, NSF, and the W.M. Keck Foundation.
Funding for the SDSS and SDSS-II has been provided by the Alfred P. Sloan Foundation, the Participating Institutions, the National Science Foundation, the U.S. Department of Energy, the National Aeronautics and Space Administration, the Japanese Monbukagakusho, the Max Planck Society, and the Higher Education Funding Council for England.
B-GA., M.C.-L., and A.L. acknowledge financial support from the NSF through grant AST-1109469. D.P.C. recognizes support from the NSF under AST 06-07500 and 09-07790. T.R.G.'s research is supported by the Gemini Observatory, which is operated by the Association of Universities for Research in Astronomy, Inc., on behalf of the international Gemini partnership of Argentina, Australia, Brazil, Canada, Chile, the United Kingdom, and the United States of America.
APPENDIX: SCATTERED LIGHT POLARIZATION COMPONENT TOWARD STAR #46
In this appendix, we lay out the justification for including a second polarization component in the wavelength fits to the data for star #46. While at some wavelengths the S/N of the data for this star are marginal, there are three reasons why we have included both a Serkowski and a "Rayleigh" component in the fit to the polarization data.
- 1.First, both the polarization percentages and position angles of the data for this star show (Table 2) wavelength variations which are not consistent with simple interstellar dichroic extinction (i.e., a Serkowski curve).
- 2.Second, as shown in Figure 9, a narrow ridge of H-band emission coincides with the location of star #46, likely due to dust scattering of the radiation from γ Cas.
- 3.Third, a similar rise in the polarization is seen in our TURPOL observations of star #76, with the sky beams of the instrument oriented E–W, as for the ALFOSC observations for star #46. Observations with TURPOL oriented by 70°, show a standard "Serkowski" polarization curve.

Figure 9. Contours of H-band diffuse emission are overlaid on a false-color image of IC 63, where the R,G,B channels are our H2 image, POSS-II Red and POSS-II Blue, respectively. Also shown are the ALFOSC slit size and orientation for the observations of star #46 as well as the target and sky beam locations for the TURPOL observations of star #76. The nominal sky-beams for TURPOL are shown in red while the target beam is in blue. In the nominal instrument orientation, the eastern sky beam of TURPOL samples the narrow ridge of H-band emission when the target beam is located on star #76. In the rotated configuration, the off beams (yellow) do not sample this diffuse emission.
Download figure:
Standard image High-resolution imageA.1. Diffuse H-band Emission in the IC 63 Nebula
Reprocessing the Mimir H-band observations to focus on the diffuse emission, a distinct ridge of diffuse emission can easily be seen, just inside of the onset of optical nebulousity. Figure 9 shows the H-band emission as contours overlayed on a false-color image of the nebula, where the R,G,B channels represent our H2 1–0 S(1) image, POSS-II Red and POSS-II Blue. A narrow ridge of H-band emission is clearly seen almost exactly overlaying the location of star #46. At the location of star #46, the ridge has a width of only 7'' (∼0.006pc at the distance of the nebula). The narrowness of the ridge, and consequent rapid spatial variations of possible associated optical emission/scattering would explain why our sky-subtraction in the ALFOSC spectro-polarimetric data might not have been fully successful for this star.
The sensitivity of the Mimir observation are not sufficient to detect a polarization signal from the diffuse H-band emission. However, the H-band ridge is significantly narrower than the diffuse emission seen in the blue and green channels of the image (dominated by the Balmer lines) and while there are a number of high-m hydrogen Brackett lines within the H filter pass-band (as well as lines of [Fe ii]), the coincidence of NIR flux and blue polarization argue for an origin of the ridge in dust scattering. With the present data we cannot, however, conclusively determine the fraction of flux due to line emission and scattered light.
A.2. Background Contamination in the TURPOL Observation of Star #76, and its Implication for the ALFOSC Observations of Star #46
While the "Rayleigh" component in the polarization spectrum of star #46 might conceivably be intrinsic to the background star itself or to an associated disk, the detection of a similar polarization component in observations (accidentally) probing a nearby part of the H-band ridge provides additional evidence for a nebular origin of this second polarization component. As part of our 2007 observing run, we observed star #76 in two separate instrument configurations that differed in the location of their "sky beams." TURPOL is a chopping photo-polarimeter (Piirola 1973, 1988) with two sky beams, one each for the ordinary (o) and extra-ordinary (e) beams, separated from the target beam by 15'', each. In our 2007 NOT/TURPOL observations, we used 7 5 diameter apertures. The standard instrument configuration places the sky beams to the East and West of the target beam. During our 2007 observations of target #76, we acquired data both in this configuration and with the instrument rotated by 70° (counter clockwise). The locations of the target and sky beams are shown in Figure 9, with the nominal configuration sky-beams indicated as red circles and the rotated configuration as yellow circles. The eastern sky beam in the nominal instrument configuration can be seen to probe the diffuse H-band ridge, while the rotated configuration does not sample this diffuse emission.
Figure 10 (left) shows the resulting polarization spectrum for the nominal TURPOL instrument position angle, compared with that of the ALFOSC data for target #46. A similar wavelength behavior for the amount of polarization is seen for the two targets, with a steeply rising polarization toward short wavelengths. The position angle variations for the two target star are different, with the one for #46 increasing toward the blue and the one for #76 decreasing. However, this position angle discrepancy can be understood as being due to the flux in the eastern sky beam of TURPOL dominating the fluxes of the target- and western sky- beams. If the eastern sky beam samples the e-beam and the flux in the target and western sky beams are approximated as zero, we would expect a polarization spectrum based on the light from the eastern sky beam, but with the position angle rotated by 90° from nominal (as the instrument coordinate system is set by the o-beam). A full analysis of the polarization and position angle spectra for the combined light of target #76 in the E–W configuration of TURPOL, for all filters, is beyond the scope of this paper. We note, however, that the relatively late G2 V spectral class of the star, at U-band the star is very faint and this idealized picture should be a good approximation. The blue open diamond in Figure 10 (left) shows the position angle resulting from adding 90° to that measured in this configuration. Figure 10 (right) compares the polarization data for target #76 from the rotated TURPOL configuration and the ALFOSC observations. For this TURPOL configuration, the two data sets agree and show only standard "Serkowski-like" polarization spectra. No upturn of the amount of polarization, toward the blue, is seen and a constant position angle is seen for all wavelengths. Thus, the rapidly rising polarization toward the blue is likely real and associated with the IC 63 nebula.

Figure 10. Left: polarization (filled diamonds) and position angle (θ; open diamonds) spectra for target star #46 observed with ALFOSC (red) and star #76 observed with TURPOL in the nominal (E–W) instrument configuration (black) are compared. A steep rise in the amount of polarization toward the blue is seen for both sources as well as a rotation of the P.A. of the polarization. As discussed in the appendix, the different sign of the P.A. rotation is likely due to the fact that the diffuse scattered light enters TURPOL in the e-ray sky-beam, causing a rotation of 90° from the nominal. The blue open diamond indicates the location of this rotated position angle for the U-band measurement for target star #76 (where the diffuse emission is likely to dominate most strongly over the stellar flux). Right: the polarization and position angle spectra for target star #76 are compared between ALFOSC (black) and TURPOL rotated by 70° from the nominal (red). No upturn of the amount of polarization toward the blue is seen in either data set and the position angles are consistent with a constant value at all wavelengths.
Download figure:
Standard image High-resolution imageA.3. Fitting the Wavelength Dependence of the Polarization Toward Star #46
We fitted the observed multi-wavelength polarization for star #46 using two independent methods. Following Andersson & Wannier (1997), we implemented a simultaneous Stokes q,u fit of the data using the nonlinear fitting routines in MPFIT (Markwardt 2009), implemented in IDL. A second method used a matrix least-squares procedure, based on the method of Poeckert et al. (1979), implemented in Excel. Because of the low S/N of the data, we imposed fixed wavelength dependencies on the two polarization terms. The Serkowski function is given by

While the index of the power-law term is not well constrained, we choose to fix this to −4, appropriate to both Rayleigh scattering from polarizable molecules and Mie scattering in the small grain limit

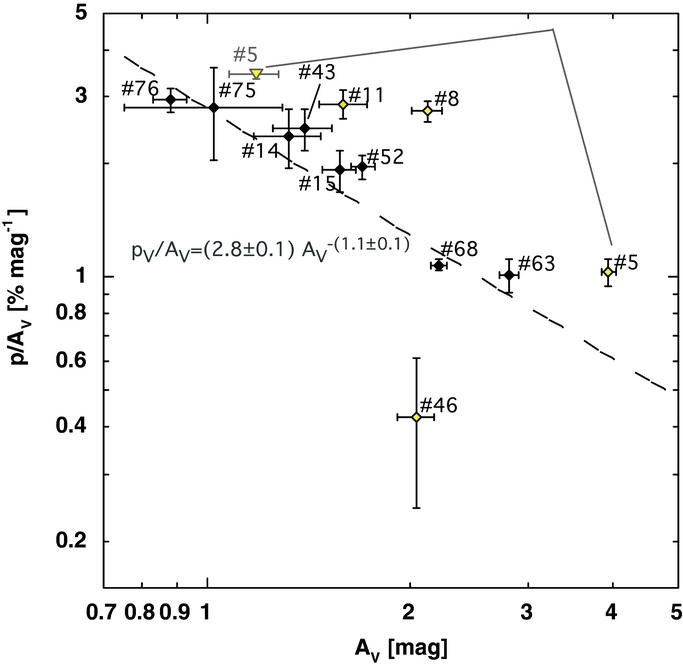
For the second fitting method we fixed the λmax parameter to 0.55 μm based on the other lines of sight through IC 63 (Equation (4)). The two methods yield results within 1σ of each other in all parameters. Both sets of fit results are summarized in Table 6 and the more conservative MPFIT based results are given above the main text.
Table 6. Polarization Curve Fitting for Target #46
| Parameter | MPFIT Based Fit | PBL79 Based Fit |
|---|---|---|
| Serkowski parameters | ||
| pmax (%) | 0.75 ± 0.31 | 0.88 ± 0.14 |
| λmax (μm) | 0.74 ± 1.01 | 0.55 (fixed) |
| θS (deg) | 94 ± 12 | 99 ± 4 |
| "Rayleigh" parameters | ||
| cR (%) | 0.05 ± 0.03 | 0.027 ± 0.002 |
| θR (deg) | 131 ± 24 | 140 ± 3 |
Download table as: ASCIITypeset image