


ABSTRACT
We present chemical abundance analyses of sodium, iron-peak, and neutron-capture elements for 97 kinematically selected thick disk, inner halo, and outer halo stars with metallicities −3.3 < [Fe/H] <−0.5. The main aim of this study is to examine chemical similarities and differences among metal-poor stars belonging to these old Galactic components as a clue to determine their early chemodynamical evolution. In our previous paper, we obtained abundances of α elements by performing a one-dimensional LTE abundance analysis based on the high-resolution (R ∼ 50, 000) spectra obtained with the Subaru/HDS. In this paper, a similar analysis is performed to determine abundances of an additional 17 elements. We show that, in metallicities below [Fe/H] ∼−2, the abundance ratios of many elements in the thick disk, inner halo, and outer halo subsamples are largely similar. In contrast, in higher metallicities ([Fe/H] ≳ −1.5), differences in some of the abundance ratios among the three subsamples are identified. Specifically, the [Na/Fe], [Ni/Fe], [Cu/Fe], and [Zn/Fe] ratios in the inner and outer halo subsamples are found to be lower than those in the thick disk subsample. A modest abundance difference between the two halo subsamples in this metallicity range is also seen for the [Na/Fe] and [Zn/Fe] ratios. In contrast to that observed for [Mg/Fe] in our previous paper, [Eu/Fe] ratios are more enhanced in the two halo subsamples rather than in the thick disk subsample. The observed distinct chemical abundances of some elements between the thick disk and inner/outer halo subsamples with [Fe/H] >−1.5 support the hypothesis that these components formed through different mechanisms. In particular, our results favor the scenario that the inner and outer halo components formed through an assembly of multiple progenitor systems that experienced various degrees of chemical enrichments, while the thick disk formed through rapid star formation with an efficient mixing of chemical elements. The lower [Na/Fe] and [Zn/Fe] observed in stars with the outer halo kinematics may further suggest that progenitors with longer star formation timescales contributed to the buildup of the relatively metal-rich part of stellar halos.
1. INTRODUCTION
Due to the advent of dedicated photometric and spectroscopic surveys such as the Sloan Digital Sky Survey (SDSS), the old metal-poor components of our Milky Way (MW) Galaxy, namely, the thick disk and the stellar halo, are found to be far more complex than previously thought exhibiting various degrees of substructures. The origins of the complex nature of these old structural components have been studied through observations and theoretical models as one of the central issues to unveil how the MW formed and evolved along with the evolution of galaxies in the universe. Although these efforts were successful in greatly advancing our view of these old MW components, their origins remain unclear.
Although the MW thick disk has been known for many years, its dynamical and chemical structures are still controversial in constraining its formation mechanism. The MW thick disk was originally discovered as an extra component required to fit the stellar number density distribution over the thin disk component at distances from the disk plane greater than ∼1 kpc (Yoshii 1982; Gilmore & Reid 1983). The thick disk is widely believed to have been formed at an early epoch of Galaxy formation because constituent stars have older ages and lower metallicities compared to thin disk stars (e.g., Bensby et al. 2003). In the solar neighborhood, thick disk stars lag in rotational velocities behind thin disk stars by ∼20–50 km s−1 (Chiba & Beers 2000; Carollo et al. 2010). Chemical abundances of the thick disk stars are known to be characterized by higher [α/Fe] ratios than the thin disk stars (Fuhrmann 1998; Bensby et al. 2003, 2005; Reddy et al. 2003, 2006; Prochaska et al. 2000; Ruchti et al. 2011), more similar to the stars in the Galactic bulge (Melendez et al. 2008; Bensby et al. 2010). Systematic analyses of low-resolution spectra for a large number of stars from the Sloan Extension for Galactic Understanding and Exploration (SEGUE) have significantly advanced our view of this component (e.g., Carollo et al. 2010; Lee et al. 2011; Cheng et al. 2012). In particular, based on the SDSS/SEGUE data, Carollo et al. (2010) suggest that the previously known metal-poor tail (−2.7 < [Fe/H] <−1.0) of the metallicity distribution function of the thick disk, which is called the "metal-weak thick disk" (MWTD; e.g., Beers et al. 2002), could indeed be associated with an independent stellar component. On the other hand, Bovy et al. (2012) questioned the distinct nature of the thick disk apart from the thin disk based on the analysis of chemically defined subpopulations by carefully taking into account possible selection biases in the SDSS spectroscopic data.
The MW stellar halo is known as another oldest remnant of the early chemodynamical evolution of our Galaxy. Recent large surveys such as SDSS reveal that the MW stellar halo is highly structured and cannot be approximated by a smooth spherical distribution of metal-poor stars (e.g., Ivezić et al. 2012). It became clear that the stellar halo contains a number of substructures in spatial distribution (e.g., Ibata et al. 1994; Newberg et al. 2002; Majewski et al. 2003; Jurić et al. 2008) or kinematics (e.g., Helmi et al. 1999; Chiba & Beers 2000; Kepley et al. 2007; Schlaufman et al. 2009) of constituent stars. The most prominent example is a currently merging dwarf galaxy, Sagittarius, and its tidal debris (e.g., Helmi 2008; Ivezić et al. 2012 and references therein). Furthermore, Carollo et al. (2007, 2010) recently confirmed that the MW stellar halo is divisible into two globally overlapping stellar components, namely, the inner and outer stellar halos, based on the analysis of kinematics and metallicity for a large sample of calibration stars obtained by SDSS/SEGUE. Those authors showed that the inner halo dominates at Galactocentric distances r smaller than ∼10–15 kpc. It has a modestly flattened distribution of stars with a mean metallicity of [Fe/H] ∼−1.6. The kinematics of the stars likely belonging to the inner halo are characterized by a zero to slightly prograde mean rotational velocity with large velocity dispersions. In contrast, the outer halo was found to dominate at r > 10–15 kpc and exhibit a more spherical stellar density distribution. The mean metallicity was estimated to be [Fe/H] ∼−2.2, which is lower than that of the inner halo. The kinematics of the outer halo component are characterized by a larger number of extreme motions (e.g., large prograde or retrograde orbit) that are the outlier of the typical inner halo stars (Carollo et al. 2007, 2010). Although the definite rotational properties of the two components remain under discussion (e.g., Schönrich et al. 2011; Beers et al. 2012), the proposed difference in the structural properties between the inner and outer parts of the MW halo suggests that these two components formed through different mechanisms (Carollo et al. 2010).
Chemical abundances of individual metal-poor stars that constitute the thick disk and stellar halos provide a unique opportunity to test theoretical models for the chemodynamical evolution of these components, particularly for the possible progenitors of these systems (Freeman & Bland-Hawthorn 2002). It has long been known that chemical abundances of metal-poor stars in the solar neighborhood are characterized by an enhancement of α elements (Mg, Si, Ca, and Ti) to iron abundance ratios ([α/Fe]; e.g., Luck & Bond 1981; McWilliam et al. 1995; Cayrel et al. 2004; Lai et al. 2008). This result is usually interpreted as evidence that the MW field metal-poor stars are formed out of gas enriched mainly through Type II supernovae (SNe) of massive stars, which would yield high [α/Fe] (e.g., Matteucci & Greggio 1986). On the other hand, observations of spatial distribution, kinematics, and metallicity for a number of MW stars suggest that the metal-poor stars in the Galaxy are a mixture of apparently different stellar populations (e.g., Bell et al. 2008). If each of these populations has their own chemical enrichment histories, we would expect to distinguish these populations through kinematics and detailed chemical abundances of individual metal-poor stars.
In this context, any correlation between orbital kinematics and chemical compositions is of particular interest since a star with extreme kinematics is more likely to have been accreted from an external system, which may have quite different chemical enrichment histories in their birthplace. Detailed chemical abundances of such stars provide us with clues for understanding properties such as star formation rates, efficiency of galactic wind, initial mass function (IMF), etc., of possible building blocks of our Galaxy (Lanfranchi & Matteucci 2003). Taking advantage of a high-resolution spectrograph on 8–10 m class telescopes, comprehensive studies on the correlation between detailed chemical abundances and kinematics of nearby halo stars have been carried out (Stephens & Boesgaard 2002; Fulbright 2002; Roederer 2008; Zhang et al. 2009; Ishigaki et al. 2010; Nissen & Schuster 2010, 2011; Ishigaki et al. 2012, hereafter Paper I). Stephens & Boesgaard (2002) reported that stars having a large apocentric distance (Rapo) tend to have lower [α/Fe] while no correlations of abundances on other orbital parameters were identified. Since sample stars with extreme outer halo kinematics were still limited, the presence or absence of the correlation remained uncertain. Recently, Nissen & Schuster (2010) suggest that their sample of nearby dwarf stars can be divisible into two distinct groups in terms of abundances of several α elements, namely, the low-α and high-α stars. The two chemically distinct groups of stars tend to show different characteristic kinematics. Nissen & Schuster (2011) further reported that these groups show different abundances in other elements such as Na and Zn. These studies imply that the stars more metal-poor than [Fe/H] <−0.5 cannot be formed within a single well-mixed gas but more likely formed in different pre-Galactic clumps that have their own chemical enrichment history.
It remained uncertain, however, how the presence of the chemically distinct groups of stars in the solar neighborhood fits into the formation scenario for thick disk and inner/outer stellar halos. A sample of stars with a wide range of kinematics and metallicities, including those characteristics of the thick disk, inner halo, and outer halo components, would provide useful insights into this issue. In this paper, we investigate similarities and differences in detailed chemical abundance patterns among the kinematically selected thick disk, inner halo, and outer halo stars. This allows us to investigate whether or not the stars in these components with their overlapping metallicity range formed under the influence of a similar chemical enrichment history. For this purpose, a sample of 97 metal-poor ([Fe/H] <−0.5) stars spanning a wide range of orbital parameters and [Fe/H] are studied. In Paper I, we present the abundance analysis of α-elements (Mg, Si, Ca, and Ti) for the sample stars. We showed that in a metallicity range of −1.5 < [Fe/H] <−0.5, kinematically defined thick disk stars have higher [Mg/Fe] and [Si/Fe] with small scatter, while the inner and outer halo stars show lower average abundance ratios for these elements with larger scatter. In the present study, we further present the results for sodium, iron(Fe)-peak, and neutron-capture elements for the same sample of stars and investigate possible scenarios that consistently explain the observed abundance patterns in each of the old Galactic components.
This paper is organized as follows. In Section 2, we present a summary of our sample stars and their membership to the thick disk, inner halo, and outer halo subsamples that have been taken from Paper I. In Section 3, a brief review of the observation, which was fully described in Paper I, is presented. Then, determination of stellar atmospheric parameters and abundance analyses of individual elements are described. In Section 4, we present the abundance results of the distribution in the [X/Fe]–[Fe/H] plane for each of the kinematically selected subsamples and examine the correlation between [X/Fe] and orbital parameters. Finally, Section 5 discusses the interpretation of the abundance differences and similarities among the three subsamples and their implications for the formation of these components.
2. THE SAMPLE
The sample of 97 dwarf and giant stars with [Fe/H] ⩽−0.5 was selected from the catalogs of Carney et al. (1994), Ryan & Norris (1991), and Beers et al. (2000) based on their kinematics. The proper motions and distance estimates were partly updated from those in the original catalog as described in Paper I. The radial velocities for the sample stars were also updated to those measured from the high-resolution spectra obtained in our observation. The orbital parameters Rapo (apocentric distance), Zmax (maximum distance from the Galactic plane), and e (orbital eccentricity) were calculated by adopting the Stöchel-type Galactic potential in the same manner as described in Chiba & Beers (2000). More details on the sample selection and kinematics of the sample stars are described in Paper I.
2.1. Kinematics and Membership Assignment
Based on the kinematics, we assigned the membership for the thick disk, inner halo, or outer halo components to each of the sample stars as described in Paper I. In short, we calculated the probabilities that each of the sample stars belongs to the thick disk (PTD), inner halo (PIH), or outer halo components (POH), based on their space velocities in the Galactic cylindrical coordinate (VR, Vϕ, and VZ). In this calculation, the mean velocities and dispersions for the thick disk, inner halo, and outer halo components as well as a fractional contribution of each component at different Zmax were adopted from the values obtained by Carollo et al. (2010) based on their analyses of SDSS DR7. Then, the thick disk, inner halo, and outer halo stars were defined as the stars with PTD > 0.9, PIH > 0.9, and POH > 0.9, respectively. Other stars with PTD, PIH, POH ⩽ 0.9 were classified as either the thick disk/inner halo or the inner halo/outer halo intermediate populations. In the remainder of this paper, we conventionally refer to the stars classified as the thick disk, inner halo, and outer halo categories as the "thick disk, inner halo, and outer halo stars/subsamples," respectively. In the above definitions, 12, 34, and 37 stars are assigned to the thick disk, inner halo, and outer halo components, respectively. The adopted criteria for the membership assignment are purely based on kinematics while metallicities for each component are not taken into account. We briefly describe its consequence in the next subsection.
As shown in Figure 1 of Paper I, the thick disk stars in our sample have a mean rotational velocity of Vϕ ∼ 180 km s−1, whose orbit is confined to ∼1 kpc above and below the Galactic plane (Zmax < 1 kpc). The inner halo stars show no rotation Vϕ ∼ 0 on average and exhibit larger velocity dispersion. Finally, the outer halo stars show a much larger dispersion in Vϕ and some have extreme prograde or retrograde rotation. At the same time, almost all stars with orbits that reach the distance of >10 kpc from the Galactic plane were classified as outer halo stars by definition.
2.2. Metallicity of the Sample
Our classification of the sample stars into the thick disk, inner halo, and outer halo subsamples described above is purely based on kinematics. As a result, metallicities for each of the three subsamples may be different from those of the thick disk, inner halo, and outer halo components obtained in previous works (e.g., Carollo et al. 2010). In this subsection, we compare metallicities of our thick disk, inner halo, and outer halo subsamples with the metallicity distribution functions reported in the literature for each Galactic component.
The thick disk stars in our sample span a lower metallicity range than that reported for the canonical thick disk component and likely include stars with chemical and kinematical properties similar to the MWTD component. The canonical thick disk component was reported to dominate in the metallicity range −1.0 ≲ [Fe/H] ≲ −0.4 (e.g., Wyse & Gilmore 1995), while our thick disk subsample extends to the metallicity as low as −2.7. At metallicities below [Fe/H] <−1.0, Carollo et al. (2010) suggested that the independent MWTD component is required to account for the observed [Fe/H] and Vϕ distribution for their sample stars close to the Galactic plane. They also reported that the metallicity of the MWTD component is in a range −1.7 < [Fe/H] <−0.8 and Vϕ ∼ 100–150 km s−1 with a dispersion of ∼35–45 km s−1. Four of the thick disk stars in our sample with [Fe/H] <−0.8 have rotational velocities similar to the MWTD (140 < Vϕ < 190 km s−1), where two of the most metal-poor stars have the lowest Vϕ values. It is unclear whether these two stars represent the lowest metallicity tail of the MWTD or interlopers from the halo component.
Chemical abundances other than iron for the MWTD have been investigated by several studies, in which a distinct chemical signature for this component was not clearly identified. Reddy & Lambert (2008) studied elemental abundances for α, iron-peak, and neutron-capture elements in the 14 candidate MWTD stars and found that their abundances are indistinguishable from halo stars with similar metallicity. Ruchti et al. (2011) studied abundances of iron and α-elements for a large sample of metal-poor stars based on the medium-resolution spectroscopic data from the Radial Velocity Experiment. They reported that the metal-poor thick disk stars are enhanced in [α/Fe] ratios similar to the halo stars.
In Paper I, we investigate [α/Fe] for the four stars with similar properties as the elusive MWTD as mentioned above. As a result, these stars were shown to have higher [Mg/Fe] or [Si/Fe] ratios than the inner/outer halo stars. Although the number of stars in this sample is very small to extract a definite conclusion about the properties of the proposed MWTD, we later compare their chemical abundances other than α elements with those of the typical thick disk, inner halo, and outer halo stars in our sample.
Our classification of inner and outer halo stars may not be representative of the stellar halo components observed in other surveys (Carollo et al. 2010; De Jong et al. 2010; An et al. 2013). Stars with outer-halo-like kinematics are classified as outer halo members regardless of their [Fe/H]. Following the same criteria, stars with inner halo kinematics are assigned to the inner halo component independently from their metallicity. As a result, our sample of inner halo and outer halo stars both span the wide range in metallicity −3.5 < [Fe/H] <−0.4. This is in contrast to the inner/outer halo division reported by Carollo et al. (2010), where the inner halo stars have a peak metallicity of −1.6 while the outer halo stars have ∼ − 2.2 dex. Note that some of the stars assigned to the inner halo or the outer halo have metallicity in agreement with these components as derived in previous works.
The reason for this metallicity difference is not clear. One possible explanation is that our sample selection in the solar neighborhood (<1–2 kpc) may be biased toward/against particular metallicity among the inner halo or outer halo components. In the following, we focus on comparing abundance ratios between kinematically defined subsamples at a given metallicity.
3. OBSERVATION AND DATA ANALYSIS
3.1. Observation and Data Reduction
The observations for all of the sample stars were made with the High Dispersion Spectrograph (HDS; Noguchi et al. 2002) mounted on the Subaru telescope during 2003–2010. The wavelength range of ∼4000–6800 Å was covered with a spectral resolution of R ∼ 50, 000 for most of the sample stars, while the several sample stars (G 64−12, G 64−37, BD+13 2995, G 14−39, and G 20−15) were observed with R ∼ 90, 000. The data reduction including bias correction, cosmic-ray removal, flat fielding, scattered light subtraction, wavelength calibration, and continuum normalization was performed with standard IRAF routines. Details of the observational setting and their reduction procedures are described in Ishigaki et al. (2010) and Paper I. The equivalent widths (EWs) of absorption lines were measured by fitting Gaussian to each feature.
3.2. Abundance Analysis
Abundance analyses are performed by using an LTE code with model atmospheres of Castelli & Kurucz (2003), which is widely described in Aoki et al. (2009) and in Paper I. In this subsection, we describe additional details on derivation of individual elemental abundances.
3.2.1. Stellar Atmospheric Parameters
We basically adopt the effective temperature (Teff), surface gravity (log g), and micro-turbulent velocity (ξ) that were estimated and used in Paper I. The Teff was estimated by the color Teff relation using the calibrations of Casagrande et al. (2010) for dwarfs and Ramírez & Meléndez (2005) for giants that are based on the infrared flux method. As mentioned in Paper I, adopting Teff from the color results in a non-negligible slope in the iron abundances versus excitation potentials of the Fe i lines for some of the sample stars. The two stars HD 171496 and LP 751−19 show exceptionally large slopes (0.09 and 0.14 dex eV−1, respectively) compared to the median value of −0.06 dex eV−1 for the whole sample. A possible reason for the peculiar behavior of these stars is that the E(B − V) values may be underestimated. Both HD 171496 and LP 751−19 are located at the Galactic latitude, b = −7.7317 and −5.2902, respectively. For these directions, the E(B − V) values in Schlafly & Finkbeiner (2011) have been reported to be 0.38 and 0.61, respectively. On the other hand, we estimate E(B − V) = 0.10 and 0.025, respectively, using the iterative algorithm to take into account the finite distance to each star (294 and 56 pc, respectively). These estimates may be affected by the uncertainty in the distance estimate as well as the uncertainty in the distribution of dust near the Galactic disk. Since accurate estimates of E(B − V) from interstellar Na i lines is difficult for the spectral resolution of our data, we adopt the Teff value of HD 171496 from Alves-Brito et al. (2010), in which the same Teff-scale of Ramírez & Meléndez (2005) was used but with a more sophisticated E(B − V) estimate based on the Na i D line. For LP 751−19, we adopt the value from Paper I. As described below, the LP 751−19 shows anomalous abundances for some elements compared to the behavior of other sample stars, which might result from adopting a wrong Teff value. The log g and ξ values of HD 171496 are updated, adopting the revised value of Teff, based on the Fe i/Fe ii excitation equilibrium and the Fe i abundance–EW relation.
3.2.2. Abundances
We use the EWs of metal absorption lines in the derivation of abundances for most of the elements. The measured EWs are given in Table 1. For Cu and Eu, we adopt a spectral synthesis for their abundance estimates. The derived abundances are normalized with the solar values from Asplund et al. (2009) to obtain the [X/H] value. The [X/Fe] ratios are then derived by normalizing [X/H] with [Fe i/H] or [Fe ii/H] for neutral or ionized species, respectively. The derived abundances and adopted stellar atmospheric parameters are given in Table 2.
Table 1. Equivalent Widths
| Object Name | Z/Ion | Element | λ | log gf | χ | EW | Flaga | Refs.b | hfs |
|---|---|---|---|---|---|---|---|---|---|
| (Å) | (dex) | (eV) | (mÅ) | ||||||
| BD+01°3070 | 11 1 | Na i | 5682.63 | −0.70 | 2.10 | 9.82 | 1 | NS10 | |
| BD+01°3070 | 21 2 | Sc ii | 4400.40 | −0.54 | 0.61 | 67.22 | 1 | I06 | hfs |
| BD+01°3070 | 21 2 | Sc ii | 4670.42 | −0.72 | 1.36 | 35.52 | 1 | R10 | hfs |
| BD+01°3070 | 21 2 | Sc ii | 5031.02 | −0.40 | 1.36 | 45.74 | 1 | I06 | hfs |
| BD+01°3070 | 21 2 | Sc ii | 5239.82 | −0.77 | 1.45 | 26.14 | 1 | I06 | hfs |
Notes. a1: used in the abundance analysis; 0: not used in the abundance analysis. bReference of the adopted log gf. A complete list of references is given in the electronic version of this table.
Only a portion of this table is shown here to demonstrate its form and content. A machine-readable version of the full table is available.
Download table as: DataTypeset image
Table 2. Atmospheric Parameters and Abundances
| Object Name | Teff | log g | ξ | [Fe i/H] | [Fe ii/H] | [Na/Fe] | [Sc/Fe] | [V/Fe] | [Cr i/Fe] | [Cr ii/Fe] |
|---|---|---|---|---|---|---|---|---|---|---|
| (K) | (dex) | (km s−1) | (dex) | (dex) | (dex) | (dex) | (dex) | (dex) | (dex) | |
| BD+01°3070 | 5404 | 3.65 | 1.18 | −1.36 ± 0.14 | −1.37 ± 0.13 | −0.30 ± 0.12 | 0.18 ± 0.07 | 0.34 ± 0.10 | −0.12 ± 0.06 | 0.14 ± 0.08 |
| BD+04°2466 | 5223 | 2.02 | 1.72 | −1.93 ± 0.14 | −1.94 ± 0.12 | −0.08 ± 0.14 | 0.13 ± 0.08 | −9.99 ± 0.00 | −0.20 ± 0.08 | 0.28 ± 0.10 |
| BD+04°2621 | 4754 | 1.63 | 1.72 | −2.40 ± 0.16 | −2.41 ± 0.12 | −9.99 ± 0.00 | 0.08 ± 0.08 | −0.03 ± 0.12 | −0.24 ± 0.09 | 0.17 ± 0.07 |
| BD+09°2870 | 4632 | 1.30 | 1.63 | −2.38 ± 0.17 | −2.42 ± 0.12 | −9.99 ± 0.00 | 0.07 ± 0.08 | −0.14 ± 0.11 | −0.31 ± 0.08 | 0.11 ± 0.07 |
| BD+10°2495 | 4974 | 2.29 | 1.64 | −2.01 ± 0.15 | −2.01 ± 0.12 | −9.99 ± 0.00 | 0.02 ± 0.07 | −0.04 ± 0.10 | −0.21 ± 0.07 | 0.17 ± 0.07 |
Only a portion of this table is shown here to demonstrate its form and content. A machine-readable version of the full table is available.
Download table as: DataTypeset image
We describe below notes on derivation of individual elemental abundances and atomic data.
Sodium. Sodium abundance is mainly determined from the Na i lines at 5682.6, 6154.2, and 6160.8 Å. We avoid using the Na i resonance lines at 5890/5896 Å since large negative non-LTE correction (log  NLTE − log LTE) up to ∼ − 0.5 dex was previously reported for these lines (Takeda et al. 2003; Andrievsky et al. 2007). On the other hand, for the Na i lines used in the present analysis, the non-LTE calculation by Takeda et al. (2003) suggests that its correction is not more than −0.11 dex for their sample of modestly metal-poor (−1.0 < [Fe/H] <0.0) dwarf stars. Since the reported amount of correction is not significantly larger than the errors in the Na abundances in this study, we shall consider that correction for the dwarf stars in our sample within this metallicity range is negligible. The values for the correction may vary depending on Teff, log g, or metallicities in a complex way. However, we assume that the correction is small for our whole sample of stars and simply adopt the abundances derived from the LTE analysis with no correction.
Scandium. Sc abundances have been determined from EWs of Sc ii lines. The hyperfine splitting (hfs) was taken into account in the abundance derivation, adopting the wavelength and the fractional strength of each hyperfine component from the Kurucz (1995) database. The total log gf values for each line are normalized to those in Ivans et al. (2006) and Roederer et al. (2010). The effect of the hfs is very small, which is typically ∼0.03 dex or less, for the present sample.
Vanadium, chromium, nickel, zinc, yttrium, and zirconium. The EWs of the V i, Cr i, Cr ii, Ni i, Zn i, Y ii, and Zr ii lines were used for their abundance determination, where log gf values were mainly adopted from Ivans et al. (2006) and Roederer et al. (2010). For the Cr i lines, the log gf values from the recent laboratory measurements of Sobeck et al. (2007) are also included.
Manganese. For the abundance determination of Mn, EWs of Mn i lines were used. The log gf values of Ivans et al. (2006) and Roederer et al. (2010) and the new measurements of Blackwell-Whitehead & Bergemann (2007) were adopted. hfs of these lines is taken into account based on the fractional strengths of each component in the Kurucz (1995) database.
Cobalt. Co i lines are used for the abundance analysis of Co taking into account the hyperfine structure for these lines. The log gf values and the atomic data for the hyperfine structure were taken from Pickering (1996).
Copper. Abundances of Cu have been obtained from the Cu i line at 5105.5 Å for a subset of the sample stars. We have employed a spectral synthesis for the abundance estimate, since line broadening due to hyperfine and isotopic splitting is expected for this line (Simmerer et al. 2003). The line splitting and the fractional strength of each hyperfine component were adopted from the Kurucz (1995) database, while the overall log gf value for this line was taken from Fuhr & Wiese (2005). The isotopic fractions of the two stable isotopes, 63Cu and 65Cu, were assumed to be the solar-system fractions of 69% and 31%, respectively (Simmerer et al. 2003).
Strontium. For most of the sample stars, the strong Sr ii lines at 4077.2 Å and 4215.5 Å are identified. However, these lines are saturated or blended especially in the sample stars with [Fe/H] ≳ −1.0 and are not useful for the abundance estimates (a change in the Sr abundance makes only a small change in the line strength). We exclude the sample stars with equivalent widths log (EW/λ) ⩾ −4.6 in the following discussions on the Sr abundances. The log gf values for these lines were adopted from Fuhr & Wiese (2005).
Barium. Barium abundances have been obtained from EWs of the Ba ii lines at 4554.0, 4934.1, 5853.7, and 6141.7 Å. In the abundance calculation, hfs and isotopic shifts for each of the five stable Ba isotopes (134Ba, 135Ba, 136Ba, 137Ba, and 138Ba) have been taken into account. The fractional contribution of each hyperfine component and their wavelength shifts are basically adopted from McWilliam (1998), with some modifications described below.
The assumption about the isotopic fraction, which is determined by the fractional contribution of the s- and the r-process in synthesizing the observed Ba, affects the abundance determination, since the odd mass number isotopes show hfs while the even mass number isotopes do not. In the present analysis, we adopt the isotopic fraction expected for the solar-system r-process component from McWilliam (1998), except for the two Ba-rich stars. As shown later, these two stars show exceptionally low-[Eu/Ba] ratios, which indicate a significant contribution of the s-process nucleosynthesis. For these two stars, we assume the solar s- and r-process mix (81% and 19%, respectively) predicted by Arlandini et al. (1999) and the isotopic fractions of the s-process component from Anders & Grevesse (1989). Assuming the solar-system r-process isotopic fraction may not be adequate for the sample stars with [Fe/H] >−1.5, since some contribution from the s-process is expected in this metallicity range. In order to reduce the abundance errors due to the uncertainty in the isotopic fraction, we exclude the two resonance lines at 4554.03 Å and 4934.10 Å, which are particularly sensitive to the assumed isotopic fractions in the Ba abundance determination for the sample stars with [Fe/H] >−1.5. Other two lines in the redder spectral region are relatively insensitive to the assumed isotopic fraction and the difference in derived Ba abundances when the two assumptions on the isotopic fraction are made is typically less than 0.02 dex. We have also updated the overall log gf values of each Ba line to those recommended by Fuhr & Wiese (2005).
Lanthanum. Lanthanum abundances are estimated from EWs of La ii lines, taking into account the hfs for these lines. The log gf values and the atomic data for the hfs were taken from Ivans et al. (2006). The La ii lines for which hyperfine structure data are not available in Ivans et al. (2006) are not used in the abundance derivation.
Neodymium and Samarium. The abundances of neodymium and samarium have been obtained from EWs of Nd ii and Sm ii lines, respectively. The log gf values for these lines have been adopted from Ivans et al. (2006), in which the values from recent laboratory measurements were employed.
Europium. Europium abundances have been determined from the spectral synthesis of Eu ii 4129.7 and/or 6645.1 Å lines. An example of the fitted spectrum is shown in Figure 1. The abundance fraction of two naturally occurring isotopes, 151Eu and 153Eu, is assumed to be 151Eu≡ 151Eu/(151Eu+153Eu) =0.5, which is roughly consistent with the r-process component of the solar-system meteorite abundance (Anders & Grevesse 1989). Hyperfine and isotopic structures for these lines were calculated based on the data listed in Lawler et al. (2001). The oscillator strengths were also taken from Lawler et al. (2001). The relative strengths of the transitions were computed with a standard manner as described in Lawler et al. (2001). For lines of other species within a few Å of each Eu ii line, we have adopted the log gf values from the current version of the Kurucz (1995) database. The Eu ii 6645 Å line is probably contaminated by a Si i line at 6645.21 Å in the adopted line list. The log gf value of this line was slightly modified so that the calculated synthetic spectrum for the Sun best reproduces the observed solar spectra in the wavelength range surrounding this line. Mashonkina et al. (2012) reported that non-LTE correction for the Eu ii 4129 Å line ranges from 0.05 to 0.12 dex and is generally larger for lower gravity stars (i.e., giants). In order to avoid systematic errors due to the non-LTE effect, we present the results considering dwarfs and giants separately when comparing the Eu abundances among the subsamples (see Section 4.1.8).

Figure 1. Example spectra (circles) of the two sample stars for wavelength regions around the Eu II 4129.7 Å (left) and 6645.1 Å (right) lines. The adopted atmospheric parameters of these stars are indicated on the top of the left panels as "Teff(K)/log g/[Fe/H]." The solid lines show the best-fit synthetic spectra and the dotted lines show the spectra for Δlog (Eu) = ±0.1 dex from the best-fit values.
Download figure:
Standard image High-resolution image3.2.3. Abundance Errors
Errors in the abundances are computed by taking into account line-to-line scatter in derived abundances and uncertainty in the adopted atmospheric parameters as in Paper I. The line-to-line scatter in the abundances from individual lines is typically smaller than 0.10 dex. Errors in the mean of the abundances due to the scatter are calculated as the line-to-line scatter divided by a square root of the number of lines used to compute the mean. When only one line is used to estimate the abundances, we assume that the error is equal to the line-to-line scatter in Fe i lines, which are typically the most numerous. Abundance errors due to the uncertainty in the adopted Teff, log g, and ξ values are examined by changing these parameters by ±100 K, ±0.3 dex, and ±0.3 km s−1, respectively, in the abundance estimates. The final errors are obtained by summing these contributions in quadrature and are listed in Table 2.
3.3. Comparison with Other Studies
Figure 2 shows the comparison of derived abundance ratios with those from Nissen & Schuster (2010, 2011) for the nine stars analyzed in common (G 112−43, G 53−41, G 125−13, G 20−15, G 176−53, G 188−21, HD 111980, HD 105004, and HD 193901). The abundance results of the two studies are also summarized in Table 3. For [Na/Fe], [Ni/Fe], and [Zn/Fe], the derived abundances show an excellent agreement within 0.01 dex with the rms scatter for the difference of ⩽0.07 dex. The [Cr/Fe], [Mn/Fe], [Cu/Fe], and [Y/Fe] in the two studies marginally agree within the mean differences of at most 0.09 dex. The derived [Ba/Fe] ratios tend to be larger in this work than in Nissen & Schuster (2011) by 0.28 dex on average with a scatter of 0.10 dex. The large difference is partly attributed to the difference in the adopted microturbulent velocity (ξ). As shown in Paper I, the present study has adopted systematically lower ξ than that in Nissen & Schuster (2011), which results in the larger Ba abundances. Another possible cause for the discrepancy is the difference in the adopted damping constant, for which the Unsöld (1955) approximation to the Van der Waals constant, enhanced by a factor of 2.2, was employed in this study.
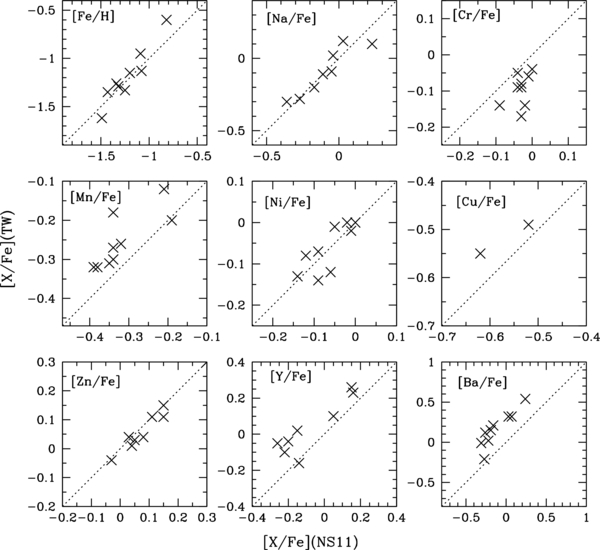
Figure 2. Comparison of the derived [Fe/H], [Na/Fe], [Cr/Fe], [Mn/Fe], [Ni/Fe], [Cu/Fe], [Zn/Fe], [Y/Fe], and [Ba/Fe] abundance ratios with those from Nissen & Schuster (2010, 2011).
Download figure:
Standard image High-resolution imageTable 3. Comparison with Nissen & Schuster (2010, 2011)
| Star Name | NS10/TW | Teff | log g | ξ | [Fe/H] | [Na/Fe] | [Cr i/Fe] | [Mn/Fe] | [Ni/Fe] | [Cu/Fe] | [Zn/Fe] | [Y/Fe] | [Ba/Fe] | Classification |
|---|---|---|---|---|---|---|---|---|---|---|---|---|---|---|
| (K) | (dex) | (km s−1) | (dex) | (dex) | (dex) | (dex) | (dex) | (dex) | (dex) | (dex) | (dex) | |||
| G112−43 | TW | 6176 | 4.0 | 1.4 | −1.33 | −0.11 | −0.04 | −0.20 | 0.00 | −0.49 | 0.30 | −0.16 | −0.21 | OH |
| NS | 6074 | 4.0 | 1.3 | −1.25 | −0.11 | 0.00 | −0.19 | −0.02 | −0.52 | 0.30 | −0.14 | −0.27 | Low-α | |
| G53−41 | TW | 6070 | 4.6 | 0.8 | −1.15 | 0.10 | −0.09 | −0.32 | −0.14 | −0.75 | 0.04 | 0.10 | 0.54 | IH |
| NS | 5859 | 4.3 | 1.3 | −1.20 | 0.23 | −0.03 | −0.38 | −0.09 | ⋅⋅⋅ | 0.03 | 0.05 | 0.24 | Low-α | |
| G125−13 | TW | 6079 | 4.8 | 0.8 | −1.35 | −0.20 | −0.14 | −0.32 | −0.07 | −0.80 | 0.03 | −0.10 | −0.01 | IH |
| NS | 5848 | 4.3 | 1.5 | −1.43 | −0.17 | −0.09 | −0.39 | −0.09 | ⋅⋅⋅ | 0.05 | −0.22 | −0.31 | (High-α) | |
| HD111980 | TW | 5798 | 4.0 | 1.2 | −1.13 | 0.12 | −0.14 | −0.30 | 0.00 | ⋅⋅⋅ | 0.15 | 0.23 | 0.32 | OH |
| NS | 5778 | 4.0 | 1.5 | −1.08 | 0.03 | −0.02 | −0.34 | 0.00 | −0.32 | 0.15 | 0.16 | 0.07 | High-α | |
| G20−15 | TW | 6042 | 4.3 | 1.2 | −1.62 | ⋅⋅⋅ | −0.17 | −0.26 | −0.01 | ⋅⋅⋅ | 0.11 | −0.16 | 0.02 | OH |
| NS | 6027 | 4.3 | 1.6 | −1.49 | −0.18 | −0.03 | −0.32 | −0.05 | ⋅⋅⋅ | 0.11 | −0.14 | −0.22 | (Low-α) | |
| HD105004 | TW | 6115 | 5.0 | 0.4 | −0.60 | −0.09 | −0.08 | −0.12 | −0.12 | ⋅⋅⋅ | 0.01 | 0.02 | 0.21 | IH |
| NS | 5754 | 4.3 | 1.2 | −0.82 | −0.05 | −0.03 | −0.21 | −0.06 | −0.22 | 0.04 | −0.15 | −0.16 | Low-α | |
| G176−53 | TW | 5753 | 5.0 | 0.2 | −1.26 | −0.30 | −0.06 | −0.31 | −0.08 | ⋅⋅⋅ | 0.04 | −0.05 | 0.12 | OH |
| NS | 5523 | 4.5 | 1.0 | −1.34 | −0.36 | −0.01 | −0.35 | −0.12 | −0.57 | 0.08 | −0.26 | −0.26 | Low-α | |
| HD193901 | TW | 5908 | 4.9 | 0.3 | −0.95 | −0.28 | −0.05 | −0.18 | −0.13 | −0.55 | −0.04 | −0.04 | 0.15 | IH |
| NS | 5650 | 4.4 | 1.2 | −1.09 | −0.27 | −0.04 | −0.34 | −0.14 | −0.62 | −0.03 | −0.20 | −0.19 | Low-α | |
| G188−22 | TW | 6170 | 4.5 | 1.1 | −1.29 | 0.02 | −0.09 | −0.27 | −0.02 | ⋅⋅⋅ | 0.11 | 0.26 | 0.32 | IH/TD |
| NS | 5974 | 4.2 | 1.5 | −1.32 | −0.04 | −0.04 | −0.34 | −0.01 | −0.41 | 0.15 | 0.15 | 0.03 | High-α |
Download table as: ASCIITypeset image
Figure 3 shows comparisons of derived [Fe/H], log (Zn), log (Y), and log (Eu) abundances with those from Roederer et al. (2010) and Simmerer et al. (2004) for the 21 stars studied in common. The abundance results from these studies and this work are summarized in Table 4. For [Fe/H], log (Zn), and log (Y), our abundances are systematically higher, where the means of the difference (scatter) are Δ[Fe/H](TW-R10) = 0.12 (0.17), Δlog (Zn)(TW-R10) = 0.12 (0.12), and Δlog (Y) (TW-R10) = 0.10 (0.21) dex. These offsets could partly be attributed to the difference in the adopted Teff, which is higher in this study by ∼60 K on average than those of Roederer et al. (2010) taken from Simmerer et al. (2004). The mean of the difference is smaller for log (Eu) (−0.01 dex) but with a larger scatter of 0.28 dex. The larger scatter for log (Y) and log (Eu) is partly due to a few stars for which large discrepancy is found. For the sample star G 63−46 with Δlog (Y) (TW-R10) =0.44 dex, the difference is likely attributed to ∼160 K difference in the adopted Teff. For another star HD 128279 with Δlog (Eu)(TW-R10) =0.67 dex, only a single Eu ii line, which is close to the detection limit, is used for the abundance estimate in the present study. Thus, the uncertainty in the synthetic spectral fitting may be mainly responsible for the discrepancy.

Figure 3. Comparison of the derived [Fe/H], log (Zn), log (Y), and log (Eu) abundances with those from Roederer et al. (2010).
Download figure:
Standard image High-resolution imageTable 4. Comparison with Roederer et al. (2010)
| Name | Teff, TW | Teff, R10 | log gTW | log gR10 | ξTW | ξR10 | [Fe/H] TW | [Fe/H] TW | log (Zn)TW |
log (Zn)R10 |
log (Y)TW |
log (Y)R10 |
log (Eu)TW |
log (Eu)R10 |
|---|---|---|---|---|---|---|---|---|---|---|---|---|---|---|
| (K) | (dex) | (km s−1) | (dex) | (dex) | (dex) | (dex) | ||||||||
| HD 107752 | 4826 | 4649 | 1.6 | 1.6 | 1.9 | 2.0 | −2.78 | −2.78 | 1.92 | 1.93 | −0.84 | −0.90 | −1.90 | −1.99 |
| HD 119516 | 5605 | 5382 | 1.9 | 2.5 | 1.9 | 2.5 | −1.92 | −2.26 | 2.67 | 2.32 | 0.02 | −0.43 | −0.98 | −1.43 |
| HD 124358 | 4745 | 4688 | 1.4 | 1.6 | 1.8 | 2.1 | −1.70 | −1.91 | 2.73 | 2.64 | −0.13 | −0.22 | −1.02 | −0.94 |
| HD 128279 | 5328 | 5290 | 3.2 | 3.0 | 1.4 | 1.5 | −2.18 | −2.51 | 2.45 | 2.15 | ⋅⋅⋅ | −1.04 | −1.60 | −2.27 |
| HD 85773 | 4370 | 4268 | 0.7 | 0.5 | 2.0 | 2.0 | −2.44 | −2.62 | 2.65 | 2.56 | −0.80 | −0.93 | −1.95 | −1.84 |
| G17−25 | 5174 | 4966 | 4.8 | 4.3 | 0.0 | 0.8 | −1.14 | −1.54 | 3.68 | 3.40 | ⋅⋅⋅ | 0.87 | −0.33 | 0.00 |
| HD 214362 | 5783 | 5727 | 2.0 | 2.6 | 2.3 | 2.0 | −1.90 | −1.87 | 2.76 | 2.71 | 0.22 | 0.32 | −1.17 | −0.82 |
| HD 218857 | 5107 | 5103 | 2.7 | 2.4 | 1.7 | 1.9 | −1.91 | −1.90 | 2.75 | 2.64 | −0.09 | −0.19 | −1.55 | −1.42 |
| G153−21 | 5566 | 5700 | 3.9 | 4.4 | 0.9 | 1.4 | −0.65 | −0.70 | 4.16 | 4.06 | 1.36 | 1.46 | 0.01 | 0.34 |
| G176−53 | 5753 | 5593 | 5.0 | 4.5 | 0.2 | 1.2 | −1.26 | −1.34 | 3.38 | 3.18 | 0.90 | 0.63 | −0.21 | −0.32 |
| G188−22 | 6170 | 5827 | 4.5 | 4.3 | 1.1 | 1.2 | −1.29 | −1.52 | 3.41 | 3.24 | 1.18 | 0.94 | −0.44 | −0.60 |
| G63−46 | 5867 | 5705 | 4.6 | 4.2 | 0.6 | 1.3 | −0.62 | −0.90 | 4.12 | 3.86 | 1.70 | 1.26 | 0.20 | −0.05 |
| G23−14 | 5061 | 5025 | 3.1 | 3.0 | 1.1 | 1.3 | −1.47 | −1.64 | 3.19 | 3.05 | 0.61 | 0.46 | −0.52 | −0.58 |
| HD 105546 | 5179 | 5190 | 2.3 | 2.5 | 1.8 | 1.6 | −1.44 | −1.48 | 3.24 | 3.29 | 0.76 | 0.74 | −0.63 | −0.56 |
| HD 108317 | 5284 | 5234 | 2.9 | 2.7 | 1.5 | 2.0 | −2.27 | −2.18 | 2.43 | 2.40 | −0.22 | −0.39 | −1.22 | −1.32 |
| HD 122956 | 4609 | 4508 | 1.6 | 1.6 | 1.7 | 1.6 | −1.71 | −1.95 | 2.92 | 2.87 | 0.29 | 0.16 | −0.83 | −0.79 |
| HD 171496 | 4795 | 4952 | 1.9 | 2.4 | 1.1 | 1.4 | −0.64 | −0.67 | 4.23 | 4.11 | 1.22 | 1.40 | −0.23 | 0.11 |
| HD 184266 | 5618 | 6000 | 1.6 | 2.7 | 2.4 | 3.0 | −1.68 | −1.43 | 2.99 | 3.19 | 0.22 | 0.69 | −1.08 | −0.43 |
| HD 188510 | 5654 | 5564 | 5.0 | 4.5 | 0.1 | 1.0 | −1.47 | −1.32 | 3.15 | 3.01 | 0.71 | 0.44 | −0.55 | −0.52 |
| HD 193901 | 5908 | 5750 | 4.9 | 4.5 | 0.3 | 1.5 | −0.95 | −1.08 | 3.59 | 3.36 | 1.21 | 0.83 | 0.06 | −0.10 |
| HD 210295 | 4763 | 4750 | 2.2 | 2.5 | 1.3 | 1.6 | −1.24 | −1.46 | 3.52 | 3.37 | 1.00 | 0.85 | −0.46 | −0.34 |
Download table as: ASCIITypeset image
3.4. [X/Fe]–Teff Correlation
The sample stars in the present study have various Teff values in the range 4000–6900 K. In this subsection, we examine the [X/Fe]–Teff correlation among the sample stars and examine the extent to which such a correlation might affect the abundance comparison between the thick disk, inner halo, and outer halo subsamples.
Figures 4–6 show the [X/Fe] plotted against Teff. The left and right rows of each figure show the plots for [Fe/H] ⩾−2 and < − 2, respectively. The three sizes of symbols represent the three metallicity intervals with the larger symbols corresponding to higher metallicities (see the caption of Figure 4). A slope of the linear regression line, which is calculated by a two-sigma clipping algorithm, is indicated in the top of each panel.

Figure 4. Abundance ratios of Na, Sc, V, Cr i, Cr ii, and Mn plotted against the adopted Teff values for the sample stars with the metallicity [Fe/H] ⩾−2 (left) and [Fe/H] <−2 (right). The size of the symbols corresponds to metallicity; in the left (right) panel, small: −2.0 ⩽ [Fe/H] <−1.5 ([Fe/H] <−3.0), medium: −1.5 ⩽ [Fe/H] <−1.0 (−3.0 ⩽ [Fe/H] <−2.5), and large: −1.0 ⩽ [Fe/H] (−2.5 ⩽ [Fe/H] <−2.0). A dotted line in each panel shows the result of a least-squares fit to a straight line [X/Fe] =b + aTeff. The slope a of the fit is indicated in each panel.
Download figure:
Standard image High-resolution image
Figure 5. Same as Figure 4, but for Co, Ni, Cu, Zn, Sr, and Y.
Download figure:
Standard image High-resolution image
Figure 6. Same as Figure 4, but for Zr, Ba, La, Nd, Sm, and Eu.
Download figure:
Standard image High-resolution imageIt can be seen from the figures that some of the elements show a slope larger than 3σ in the [X/Fe]–Teff plane in one or both metallicity range(s). In [Fe/H] ⩾−2 (the left columns of Figures 4–6), a significant [X/Fe]–Teff correlation can be recognized for V, Cr i, Co, Nd, Sm, and Eu. For V, Cr, and Co, the slopes are ⩽0.13 dex/1000 K, which is comparable to the observational errors, while for Nd, Sm, and Eu, the slopes exceed ⩾0.18 dex/1000 K, which may affect the abundance comparison between the subsamples. In [Fe/H] <−2 (right columns of Figures 4–6), the abundance ratios of Sc, V, Cr i, Y, Zr, Nd, and Sm show a slope of >3σ with Teff. Particularly large slopes for [Nd/Fe] and [Sm/Fe] versus Teff plots are partly attributed to paucity of data points in the range Teff > 5000 K, in which Nd and Sm abundances are below detection limits for many of the sample stars. Since the upper limits for some of the sample stars in this temperature range are below [Nd/Fe], [Sm/Fe] ∼ 0.5 dex, the apparent extreme slopes are likely artificial.
The abundance–Teff correlations as indicated above or the discrepancy in the derived abundances between dwarf and giant stars have been reported in previous studies. Bonifacio et al. (2009) compare abundances in the sample of dwarfs and giants in the metallicity range of −4 ≲ [Fe/H] ≲ −2. They reported that the dwarf versus giant discrepancy presents for many elements. In particular, the Sc, Cr, Mn, Zn, and Co abundances were found to be higher in dwarf stars than in giant stars. This effect is also seen in our sample for Sc and Cr i in a similar metallicity range. On the other hand, our sample does not show a significant dwarf/giant discrepancy for Mn, Zn, and Co.
The exact reason for the discrepancy is currently unclear. Bonifacio et al. (2009) suspect that granulation in the stellar atmospheres (three-dimensional effects) and/or departure from LTE might be responsible for the discrepancy observed in some elements. Since the magnitudes and direction of these effects may be different among different species and lines used in the analysis, we do not correct [X/Fe] values to vanish the [X/Fe]–Teff slopes in the following analysis. Instead, for the elements with the large slopes, we separately treat dwarfs and giants in the abundance comparisons among the three subsamples.
4. RESULTS
4.1. Distribution of the Sample Stars in [X/Fe]–[Fe/H] Planes
Figures 7 and 8 show the abundance ratios ([X/Fe]) plotted against [Fe/H] for the thick disk stars (crosses), the inner halo stars (filled circles), the outer halo stars (filled triangles), and their intermediate populations (thick disk/inner halo: open circles; inner halo/outer halo: open triangles). For particularly interesting elements, namely, Na, Ni, Zn, and Eu, we additionally discuss the behavior of low-[Mg/Fe] stars with [Mg/Fe] <0.1, which are analogous to the low-α stars in Nissen & Schuster (2010) for the purpose of examining the consistency of the present results with those of Nissen & Schuster (2010). The low-[Mg/Fe] stars are marked with gray circles in the corresponding panels in Figures 7 and 11. Table 5 summarizes the means (μ) and scatters (σ) of the abundance ratios for the three subsamples (in the second column, "TD," "IH," and "OH,") for the thick disk, inner halo, and outer halo subsamples, respectively. This table also includes the means and scatters of the abundance ratios taking into account dwarfs (μd) or giants (μg) alone. The anomalous star, LP 751−19 (see Section 3.2.1), is excluded in the calculation of the means and scatters.

Figure 7. Abundance ratios for Na, Sc, V, Cr i, Cr ii, Mn, Co, Ni, Cu, and Zn plotted against [Fe/H]. The crosses, filled circles, and filled triangles indicate the sample stars with PTD > 0.9 (the thick disk stars), PIH > 0.9 (the inner halo stars), and POH > 0.9 (the outer halo stars), respectively. The open circles show the stars whose kinematics are intermediate between the thick disk and the inner halo (PTD, PIH ⩽ 0.9 and PTD, PIH ⩾ POH), while open triangles indicate the stars whose kinematics are intermediate between the inner and the outer halo (PIH, POH ⩽ 0.9 and PIH, POH ⩾ PTD). Symbols marked with a gray open circle in the [Na/Fe], [Ni/Fe], and [Zn/Fe] panels represent the sample stars with [Mg/Fe] <0.1.
Download figure:
Standard image High-resolution image
Figure 8. Same as Figure 7, but for neutron-capture elements (Sr, Y, Zr, Ba, La, Nd, Sm, and Eu). The two sample stars, G 18–24 and BD+04°2466, which are identified as s-process-rich stars, are marked with larger circles.
Download figure:
Standard image High-resolution imageTable 5. Means and Standard Deviations in the Abundance Ratios
| [X/Fe] | [Fe/H] >−1.5 | −2.5 < [Fe/H] ⩽−1.5 | [Fe/H] ⩽−2.5 | |||||||||||||
|---|---|---|---|---|---|---|---|---|---|---|---|---|---|---|---|---|
| μa | σb | Nc | μd(N)d | μg(N)e | μ | σ | N | μd(N) | μg(N) | μ | σ | N | μd(N) | μg(N) | ||
| Na | TD | 0.10 | 0.11 | 8 | 0.16 ± 0.06 (2) | 0.13 ± 0.04 (4) | −0.08 | 0.08 | 2 | ... | −0.03 ± 0.14 (1) | ⋅⋅⋅ | ... | ... | ||
| IH | −0.13 | 0.17 | 16 | −0.14 ± 0.02 (11) | −0.13 ± 0.07 (3) | −0.15 | 0.14 | 8 | −0.19 ± 0.05 (4) | −0.11 ± 0.04 (2) | ⋅⋅⋅ | ... | ... | |||
| OH | −0.28 | 0.19 | 11 | −0.23 ± 0.03 (6) | −0.30 ± 0.14 (1) | −0.28 | 0.18 | 5 | −0.01 ± 0.09 (1) | −0.35 ± 0.02 (4) | −0.06 | 0.14 | 1 | ... | −0.06 ± 0.14 (1) | |
| Sc | TD | 0.21 | 0.09 | 8 | 0.29 ± 0.07 (2) | 0.22 ± 0.02 (4) | 0.15 | 0.05 | 2 | ... | 0.19 ± 0.08 (1) | 0.17 | 0.10 | 1 | ... | ... |
| IH | 0.14 | 0.07 | 18 | 0.15 ± 0.02 (12) | 0.15 ± 0.06 (3) | 0.13 | 0.09 | 13 | 0.18 ± 0.04 (6) | 0.07 ± 0.02 (4) | 0.14 | 0.26 | 3 | 0.28 ± 0.04 (2) | −0.16 ± 0.08 (1) | |
| OH | 0.14 | 0.06 | 11 | 0.16 ± 0.01 (6) | −0.03 ± 0.12 (1) | 0.05 | 0.10 | 20 | 0.08 ± 0.05 (5) | 0.03 ± 0.02 (8) | 0.24 | 0.26 | 6 | 0.36 ± 0.11 (4) | 0.04 ± 0.09 (1) | |
| V | TD | 0.02 | 0.19 | 8 | 0.22 ± 0.11 (2) | −0.10 ± 0.08 (4) | 0.04 | 0.02 | 2 | ... | 0.05 ± 0.13 (1) | ⋅⋅⋅ | ... | ... | ||
| IH | 0.06 | 0.13 | 15 | 0.12 ± 0.04 (9) | −0.11 ± 0.03 (3) | 0.14 | 0.24 | 8 | 0.28 ± 0.08 (5) | −0.09 ± 0.05 (3) | 0.17 | 0.17 | 1 | 0.17 ± 0.17 (1) | ... | |
| OH | 0.12 | 0.12 | 10 | 0.15 ± 0.02 (6) | −0.12 ± 0.17 (1) | −0.05 | 0.13 | 11 | −0.19 ± 0.13 (1) | −0.09 ± 0.02 (6) | −0.27 | 0.16 | 1 | ... | −0.27 ± 0.16 (1) | |
| Cr i | TD | −0.13 | 0.11 | 8 | −0.07 ± 0.00 (2) | −0.14 ± 0.07 (4) | −0.23 | 0.07 | 2 | ... | −0.18 ± 0.07 (1) | −0.06 | 0.07 | 1 | ... | ... |
| IH | −0.14 | 0.12 | 18 | −0.09 ± 0.01 (12) | −0.29 ± 0.11 (3) | −0.14 | 0.08 | 13 | −0.07 ± 0.01 (6) | −0.22 ± 0.02 (4) | −0.06 | 0.10 | 3 | −0.00 ± 0.01 (2) | −0.17 ± 0.14 (1) | |
| OH | −0.10 | 0.07 | 11 | −0.08 ± 0.01 (6) | −0.26 ± 0.18 (1) | −0.17 | 0.09 | 20 | −0.12 ± 0.03 (5) | −0.26 ± 0.02 (8) | −0.23 | 0.12 | 5 | −0.18 ± 0.08 (3) | −0.31 ± 0.08 (1) | |
| Cr ii | TD | 0.18 | 0.06 | 8 | 0.22 ± 0.01 (2) | 0.15 ± 0.03 (4) | 0.18 | 0.06 | 2 | ... | 0.22 ± 0.09 (1) | 0.18 | 0.10 | 1 | ... | ... |
| IH | 0.16 | 0.05 | 18 | 0.17 ± 0.01 (12) | 0.13 ± 0.05 (3) | 0.19 | 0.05 | 13 | 0.20 ± 0.02 (6) | 0.17 ± 0.02 (4) | 0.16 | 0.07 | 1 | ... | 0.16 ± 0.07 (1) | |
| OH | 0.17 | 0.05 | 11 | 0.17 ± 0.02 (6) | 0.09 ± 0.09 (1) | 0.15 | 0.06 | 19 | 0.15 ± 0.02 (5) | 0.13 ± 0.02 (8) | 0.08 | 0.06 | 1 | ... | 0.08 ± 0.06 (1) | |
| Mn | TD | −0.08 | 0.18 | 8 | −0.03 ± 0.10 (2) | 0.01 ± 0.07 (4) | −0.33 | 0.08 | 2 | ... | −0.27 ± 0.07 (1) | −0.68 | 0.07 | 1 | ... | ... |
| IH | −0.25 | 0.08 | 18 | −0.27 ± 0.02 (12) | −0.22 ± 0.01 (3) | −0.34 | 0.10 | 13 | −0.35 ± 0.02 (6) | −0.23 ± 0.04 (4) | −0.44 | 0.12 | 2 | −0.35 ± 0.16 (1) | −0.53 ± 0.14 (1) | |
| OH | −0.27 | 0.08 | 11 | −0.28 ± 0.02 (6) | −0.17 ± 0.08 (1) | −0.37 | 0.10 | 20 | −0.34 ± 0.03 (5) | −0.42 ± 0.03 (8) | −0.34 | 0.16 | 1 | ... | −0.34 ± 0.16 (1) | |
| Co | TD | −0.05 | 0.12 | 5 | −0.07 ± 0.13 (1) | −0.04 ± 0.07 (4) | 0.12 | 0.19 | 2 | ... | −0.02 ± 0.14 (1) | 0.05 | 0.10 | 1 | ... | ... |
| IH | 0.08 | 0.15 | 5 | 0.20 ± 0.03 (2) | 0.04 ± 0.12 (2) | 0.11 | 0.13 | 8 | 0.13 ± 0.03 (5) | 0.09 ± 0.13 (3) | 0.17 | 0.03 | 2 | 0.15 ± 0.16 (1) | 0.19 ± 0.17 (1) | |
| OH | 0.10 | 0.10 | 5 | 0.14 ± 0.02 (4) | −0.05 ± 0.16 (1) | 0.06 | 0.13 | 9 | 0.10 ± 0.01 (4) | 0.32 ± 0.22 (1) | ⋅⋅⋅ | ... | ... | |||
| Ni | TD | −0.01 | 0.05 | 8 | 0.02 ± 0.02 (2) | 0.00 ± 0.01 (4) | −0.06 | 0.05 | 2 | ... | −0.10 ± 0.10 (1) | ⋅⋅⋅ | ... | ... | ||
| IH | −0.08 | 0.05 | 18 | −0.09 ± 0.01 (12) | −0.08 ± 0.01 (3) | −0.08 | 0.06 | 12 | −0.08 ± 0.04 (5) | −0.07 ± 0.03 (4) | −0.06 | 0.04 | 2 | −0.09 ± 0.18 (1) | −0.04 ± 0.11 (1) | |
| OH | −0.12 | 0.07 | 11 | −0.08 ± 0.03 (6) | −0.17 ± 0.09 (1) | −0.10 | 0.09 | 19 | −0.14 ± 0.04 (5) | −0.13 ± 0.02 (8) | 0.03 | 0.12 | 2 | 0.12 ± 0.08 (1) | −0.06 ± 0.08 (1) | |
| Cu | TD | −0.26 | 0.23 | 7 | −0.07 ± 0.01 (2) | −0.25 ± 0.05 (4) | −0.57 | 0.12 | 1 | ... | −0.57 ± 0.12 (1) | ⋅⋅⋅ | ... | ... | ||
| IH | −0.49 | 0.29 | 11 | −0.53 ± 0.09 (6) | −0.20 ± 0.27 (2) | −0.70 | 0.24 | 4 | −0.45 ± 0.12 (1) | −0.67 ± 0.08 (2) | ⋅⋅⋅ | ... | ... | |||
| OH | −0.54 | 0.18 | 6 | −0.49 ± 0.12 (1) | −0.85 ± 0.12 (1) | −0.74 | 0.27 | 8 | ... | −0.87 ± 0.07 (6) | −0.68 | 0.12 | 1 | ... | −0.68 ± 0.12 (1) | |
| Zn | TD | 0.20 | 0.08 | 8 | 0.22 ± 0.04 (2) | 0.22 ± 0.04 (4) | 0.14 | 0.00 | 2 | ... | 0.14 ± 0.18 (1) | ⋅⋅⋅ | ... | ... | ||
| IH | 0.06 | 0.09 | 18 | 0.03 ± 0.02 (12) | 0.14 ± 0.06 (3) | 0.13 | 0.15 | 12 | 0.04 ± 0.04 (5) | 0.23 ± 0.10 (4) | −0.01 | 0.27 | 2 | −0.20 ± 0.21 (1) | 0.18 ± 0.13 (1) | |
| OH | 0.03 | 0.12 | 11 | 0.07 ± 0.05 (6) | −0.07 ± 0.19 (1) | 0.01 | 0.10 | 19 | 0.01 ± 0.06 (5) | 0.01 ± 0.04 (8) | 0.11 | 0.10 | 2 | ... | 0.04 ± 0.21 (1) | |
| Sr | TD | ⋅⋅⋅ | ... | ... | −0.03 | 0.23 | 1 | ... | ... | ⋅⋅⋅ | ... | ... | ||||
| IH | −0.07 | 0.10 | 6 | −0.07 ± 0.04 (6) | ... | 0.13 | 0.15 | 5 | 0.13 ± 0.07 (5) | ... | 0.09 | 0.17 | 3 | 0.16 ± 0.12 (2) | −0.04 ± 0.18 (1) | |
| OH | 0.02 | 0.07 | 4 | 0.02 ± 0.03 (4) | ... | −0.09 | 0.25 | 6 | −0.04 ± 0.11 (5) | ... | 0.06 | 0.12 | 4 | 0.08 ± 0.08 (3) | ... | |
| Y | TD | −0.11 | 0.14 | 8 | −0.05 ± 0.16 (2) | −0.16 ± 0.07 (4) | −0.10 | 0.09 | 2 | ⋅⋅⋅ | −0.04 ± 0.09 (1) | −0.04 | 0.09 | 1 | ⋅⋅⋅ | ⋅⋅⋅ |
| IH | 0.06 | 0.20 | 17 | 0.09 ± 0.06 (12) | 0.07 ± 0.03 (3) | −0.12 | 0.32 | 11 | 0.02 ± 0.10 (4) | −0.36 ± 0.09 (4) | −0.07 | 0.27 | 2 | 0.12 ± 0.12 (1) | −0.26 ± 0.09 (1) | |
| OH | −0.02 | 0.12 | 9 | −0.00 ± 0.05 (6) | ⋅⋅⋅ | −0.23 | 0.20 | 16 | −0.14 ± 0.12 (4) | −0.32 ± 0.06 (8) | −0.46 | 0.05 | 2 | ⋅⋅⋅ | −0.49 ± 0.10 (1) | |
| Zr | TD | 0.12 | 0.21 | 4 | 0.10 ± 0.20 (2) | −0.04 ± 0.10 (1) | 0.25 | 0.01 | 2 | ⋅⋅⋅ | 0.25 ± 0.11 (1) | 0.42 | 0.09 | 1 | ⋅⋅⋅ | ⋅⋅⋅ |
| IH | 0.29 | 0.18 | 4 | 0.40 ± 0.15 (2) | ⋅⋅⋅ | 0.20 | 0.37 | 6 | 0.40 ± 0.24 (3) | 0.01 ± 0.15 (3) | 0.20 | 0.09 | 1 | ⋅⋅⋅ | 0.20 ± 0.09 (1) | |
| OH | 0.34 | 0.12 | 5 | 0.32 ± 0.06 (4) | ⋅⋅⋅ | −0.06 | 0.11 | 7 | ⋅⋅⋅ | −0.03 ± 0.04 (6) | −0.16 | 0.14 | 1 | ⋅⋅⋅ | −0.16 ± 0.14 (1) | |
| Ba | TD | 0.09 | 0.07 | 8 | 0.05 ± 0.06 (2) | 0.13 ± 0.03 (4) | 0.06 | 0.08 | 2 | ⋅⋅⋅ | 0.12 ± 0.22 (1) | −0.50 | 0.12 | 1 | ⋅⋅⋅ | ⋅⋅⋅ |
| IH | 0.21 | 0.29 | 18 | 0.27 ± 0.10 (12) | 0.07 ± 0.07 (3) | −0.03 | 0.53 | 13 | 0.00 ± 0.08 (6) | −0.34 ± 0.20 (4) | −0.25 | 0.14 | 3 | −0.24 ± 0.14 (2) | −0.25 ± 0.12 (1) | |
| OH | 0.09 | 0.15 | 10 | 0.11 ± 0.07 (6) | ⋅⋅⋅ | −0.11 | 0.26 | 20 | 0.03 ± 0.08 (5) | −0.23 ± 0.09 (8) | −0.28 | 0.37 | 5 | −0.03 ± 0.05 (3) | −0.46 ± 0.17 (1) | |
| La | TD | 0.14 | 0.08 | 5 | ⋅⋅⋅ | 0.14 ± 0.05 (4) | 0.31 | 0.11 | 2 | ⋅⋅⋅ | 0.39 ± 0.15 (1) | ⋅⋅⋅ | ⋅⋅⋅ | ⋅⋅⋅ | ||
| IH | 0.42 | 0.48 | 9 | 0.73 ± 0.29 (4) | 0.15 ± 0.09 (3) | 0.43 | 0.63 | 5 | ⋅⋅⋅ | 0.16 ± 0.08 (2) | ⋅⋅⋅ | ⋅⋅⋅ | ⋅⋅⋅ | |||
| OH | 0.46 | 0.35 | 6 | 0.36 ± 0.12 (3) | 0.25 ± 0.14 (1) | 0.34 | 0.47 | 7 | 0.36 ± 0.14 (1) | 0.12 ± 0.09 (4) | −0.02 | 0.14 | 1 | ⋅⋅⋅ | −0.02 ± 0.14 (1) | |
| Nd | TD | 0.27 | 0.19 | 8 | 0.55 ± 0.15 (2) | 0.16 ± 0.01 (4) | 0.33 | 0.00 | 2 | ⋅⋅⋅ | 0.33 ± 0.10 (1) | ⋅⋅⋅ | ⋅⋅⋅ | ⋅⋅⋅ | ||
| IH | 0.57 | 0.30 | 18 | 0.68 ± 0.07 (12) | 0.23 ± 0.01 (3) | 0.30 | 0.53 | 10 | 0.62 ± 0.16 (3) | −0.12 ± 0.18 (4) | 0.17 | 0.10 | 1 | ⋅⋅⋅ | 0.17 ± 0.10 (1) | |
| OH | 0.50 | 0.17 | 10 | 0.62 ± 0.07 (5) | 0.35 ± 0.14 (1) | 0.23 | 0.26 | 14 | 0.57 ± 0.04 (3) | 0.09 ± 0.05 (7) | −0.11 | 0.11 | 1 | ⋅⋅⋅ | −0.11 ± 0.11 (1) | |
| Sm | TD | 0.19 | 0.11 | 8 | 0.21 ± 0.10 (2) | 0.14 ± 0.05 (4) | 0.50 | 0.07 | 2 | ⋅⋅⋅ | 0.45 ± 0.10 (1) | ⋅⋅⋅ | ⋅⋅⋅ | ⋅⋅⋅ | ||
| IH | 0.50 | 0.34 | 10 | 0.82 ± 0.16 (4) | 0.21 ± 0.06 (3) | 0.35 | 0.50 | 7 | ⋅⋅⋅ | 0.11 ± 0.12 (4) | 0.33 | 0.11 | 1 | ⋅⋅⋅ | 0.33 ± 0.11 (1) | |
| OH | 0.60 | 0.16 | 7 | 0.68 ± 0.13 (3) | 0.47 ± 0.16 (1) | 0.26 | 0.13 | 10 | ⋅⋅⋅ | 0.25 ± 0.05 (7) | 0.03 | 0.12 | 1 | ⋅⋅⋅ | 0.03 ± 0.12 (1) | |
| Eu | TD | 0.19 | 0.16 | 8 | 0.22 ± 0.09 (2) | 0.09 ± 0.07 (4) | 0.51 | 0.03 | 2 | ⋅⋅⋅ | 0.48 ± 0.10 (1) | 0.06 | 0.21 | 1 | ⋅⋅⋅ | ⋅⋅⋅ |
| IH | 0.39 | 0.27 | 18 | 0.48 ± 0.04 (12) | 0.01 ± 0.25 (3) | 0.20 | 0.42 | 9 | 0.35 ± 0.12 (5) | −0.01 ± 0.23 (4) | 0.43 | 0.10 | 2 | 0.70 ± 0.20 (2) | 0.36 ± 0.21 (1) | |
| OH | 0.50 | 0.21 | 10 | 0.49 ± 0.08 (6) | 0.23 ± 0.21 (1) | 0.34 | 0.32 | 20 | 0.59 ± 0.06 (5) | 0.16 ± 0.11 (8) | 0.09 | 0.11 | 1 | 1.07 ± 0.31 (2) | 0.09 ± 0.11 (1) | |
Notes. aMeans of the abundance ratios within a given [Fe/H] interval. bStandard deviations of the means. cThe number of stars used to calculate the μ and σ. dA mean and its error for dwarf stars only. The number of stars is given in parentheses. eA mean and its error for giant stars only. The number of stars is given in parentheses.
4.1.1. Sodium, Scandium, and Vanadium
The thick disk, inner halo, and outer halo subsamples show different trends and scatters in the [Na/Fe]–[Fe/H] diagram. First, the thick disk stars are modestly enhanced in [Na/Fe] ratios at metallicities [Fe/H] >−1.5 with a mean abundance of [Na/Fe] =0.10 dex, while most of the inner and outer halo stars show lower ratios at similar metallicities. Second, scatter in the [Na/Fe] ratios in this [Fe/H] range is relatively small (0.11 dex) for the thick disk stars, which is comparable to the observational error, while the inner and outer halo stars show larger scatter (⩾0.17 dex). Third, the mean [Na/Fe] ratio for the outer halo stars (−0.28 ± 0.06 dex) is lower than that of the inner halo stars (−0.13 ± 0.04 dex). There are also abundance differences among the three subsamples when only dwarfs or giants are taken into account (see Table 5). Furthermore, among the inner halo and outer halo stars, those with lower [Mg/Fe] ratios (gray circled symbols) tend to show lower [Na/Fe] ratios in a given metallicity range with a possible exception of the two stars having [Na/Fe] >0.0.
The observed trends of [Na/Fe] ratios with [Fe/H] for our three subsamples are in agreement with previous studies. Reddy et al. (2006) reported modestly enhanced [Na/Fe] ratios and decreasing [Na/Fe] with decreasing [Fe/H] for their sample of thick disk stars with [Fe/H] <−0.6, which is similar to the trend seen in the plot in Figure 7. The non-LTE (re)analysis of sodium abundances by Takeda et al. (2003) suggests that [Na/Fe] ratios in their sample of thick disk stars are near-solar, which is roughly consistent with the present result if the suggested non-LTE correction up to ∼ − 1.0 dex is applied to our sample.
For the inner and outer halo stars, our results suggest that the [Na/Fe] ratios are likely correlated with both kinematics and [α/Fe], which qualitatively supports previous findings by Stephens & Boesgaard (2002), Fulbright (2002), and Nissen & Schuster (2010, 2011). As an example, Fulbright (2002) reported that a fraction of Na-poor stars defined as [Na/Fe] <−0.36 in his sample increases for stars with a large apocentric distance (Rapo > 20 kpc). The suggested dependence is similar to the present result in that the outer halo subsample, which includes stars with Rapo > 15 kpc, tends to show relatively low [Na/Fe] ratios than the inner halo stars. We will discuss the likely [Na/Fe]–kinematics correlations in Section 4.2. Nissen & Schuster (2010) reported the distinct [Na/Fe] ratios for the low- and high-α stars in the metallicity range of −1.6 < [Fe/H] <−0.4, for which a similar trend is apparent in Figure 7. To summarize, the inner and outer halo stars, at least in part, show lower [Na/Fe] ratios than the thick disk stars and the lowest [Na/Fe] stars in our sample tend to have outer halo kinematics and/or low [Mg/Fe] ratios.
The observed difference in the [Na/Fe] ratios among the three subsamples suggests that progenitors of the thick disk and the inner and outer halos experienced largely different chemical enrichment histories. Sodium is mainly synthesized during hydrostatic carbon burning in massive stars (Woosley & Weaver 1995) and its yield is known to be dependent on the mass and metallicity of the progenitor star (Kobayashi et al. 2006). Therefore, the IMF, typical metallicities, and/or the relative contribution of Fe from Type Ia SNe may be responsible for determining [Na/Fe] abundance ratios of the progenitor systems. One possible interpretation for the origin of the observed lower [Na/Fe] stars in our inner and outer halo subsamples is that higher mass stars were deficient in their progenitors compared to those of the thick disk. Alternatively, metals ejected from massive stars more easily escape in the progenitor of the inner and outer halos than in those of the thick disk. Star formation rate is another factor that could affect [Na/Fe] ratios since it determines the relative contribution of Na predominantly from Type II SNe to Fe from Type Ia SNe. In order to examine which of the above factors is the most important for explaining the observed [Na/Fe] difference among the three subsamples, a chemical evolution modeling which takes into account the difference in star formation environment during the formation of the three components is necessary.
The [Sc/Fe] ratios for the thick disk, inner halo, and outer halo subsamples are all enhanced in the metallicity range [Fe/H] >−1.5 with a modest decreasing trend toward lower [Fe/H] with small scatter (<0.10 dex). A significant difference in this trend among the three subsamples is not found. In [Fe/H] below ∼ − 1.5, the trend appears to be flattened at [Sc/Fe] ∼0.10 dex showing a much larger scatter (>0.25 dex; Table 5). The observed enhanced [Sc/Fe] ratios are generally consistent with those found in previous studies for stars with [Fe/H] >−1.5 (Prochaska et al. 2000; Reddy et al. 2006; Zhao & Magain 1990; Nissen et al. 2000; Cayrel et al. 2004).
The [V/Fe] ratios for the three subsamples are nearly flat at the solar value in the metallicity below [Fe/H] ∼−1.0 without a significant difference among the subsamples. The near-solar value for the halo stars is in agreement with previous studies (Gratton & Sneden 1991; Lai et al. 2008). The enhancement in the [V/Fe] ratio in [Fe/H] >−1.0 is reported by Prochaska et al. (2000) and Reddy et al. (2006) for the thick disk stars, while a modest enhancement (0.02–0.12 dex) is also seen in our sample.
In the theoretical calculation of Woosley & Weaver (1995), both Sc and V are produced through explosive oxygen, silicon, and neon burning in massive stars and thus their yield is sensitive to various parameters of SN explosions. The similarity in the observed trend in [Sc/Fe] and [V/Fe] among the three subsamples may indicate that the astrophysical sites for the production of these elements are largely common among the different Galactic populations.
4.1.2. Chromium
For chromium, we first note that the abundances derived from the neutral and ionized species ([Cr i/Fe] and [Cr ii/Fe], respectively) are systematically different, as can be seen in the plot in Figure 7. The [Cr i/Fe] ratios are subsolar for the whole [Fe/H] range and slightly decrease toward lower metallicity, while the [Cr ii/Fe] ratios are supersolar without any trends with [Fe/H]. The observed discrepancy in the Cr abundance ratios between those derived from neutral and ionized species has previously been reported in the literature (Gratton & Sneden 1991; Lai et al. 2008; Bonifacio et al. 2009). The reason for this discrepancy and which species is the more reliable indicator of the true Cr abundance are not clear. Gratton & Sneden (1991) suggested that the neutral species is affected by overionization and thus use of Cr i lines would underestimate the overall Cr abundance.
As far as the [Cr ii/Fe] ratio is concerned, which is presumably less affected by the overionization, the abundance ratios show a negligible scatter of 0.06 dex at most for all of the thick disk, inner halo, and outer halo subsamples over the whole [Fe/H] range. This result is consistent with that of a more precise analysis of Cayrel et al. (2004), which reported the 0.05 dex scatter over the metallicity −4 < [Fe/H] <−2. The present results further confirm the small cosmic scatter in the [Cr/Fe] ratios in the solar neighborhood stars independent of their kinematics and metallicity.
4.1.3. Manganese, Nickel, and Zinc
For all of the three subsamples, the [Mn/Fe] ratios show an increasing trend with increasing [Fe/H] in the range [Fe/H] >−2. In a more metal-poor range, the trend appears to be flattened with larger scatter. The increasing [Mn/Fe] trend is consistent with previous studies for the thick disk and halo stars in the range −1.5 < [Fe/H] <0.0 (Prochaska et al. 2000; Nissen et al. 2000; Reddy et al. 2006). Systematic differences between the thick disk, inner halo, and outer halo stars are not clearly seen.
Manganese is thought to be mostly produced by explosive silicon burning in massive stars in their outer incomplete Si-burning layers (Umeda & Nomoto 2005) and in Type Ia SNe (Iwamoto et al. 1999). In metallicities below [Fe/H] ∼−1, the low [Mn/Fe] ratios are mainly determined by the yields from Type II SNe of massive stars (Tsujimoto & Shigeyama 1998). In [Fe/H] ≳ −1, the increasing [Mn/Fe] with increasing [Fe/H] is interpreted as an onset of contribution from Type Ia SNe (Kobayashi et al. 2006). It was also suggested that the dependence of Mn yields of Type Ia SNe on metallicity may contribute to the increase of [Mn/Fe] ratios with [Fe/H] (Cescutti et al. 2008). The observed increase in the [Mn/Fe] ratios for the three subsamples, therefore, may indicate that Type Ia SNe have played some role for chemical evolution in the progenitors of the thick disk, inner halo, and outer halo components. This interpretation favors the idea that the formation timescales for these progenitors were modestly longer than those of the Type Ia SNe. The timescale for the chemical enrichment via Type Ia SNe is poorly constrained due to the uncertainties in physical mechanisms that give rise to the explosion (e.g., Maoz et al. 2010). Analyses of SN rates in galaxies and galaxy clusters suggest that the SN rate as a function of the delay time from major star formation to SN explosions is higher within a few Gyr and decreases toward longer time delays (Totani et al. 2008; Maoz et al. 2010). Such estimates for the SN delay time distributions as well as constraints on SN Mn yields are essential to interpret the [Mn/Fe] ratios for each of the three subsamples.
For the [Ni/Fe] ratios, a modest difference between the thick disk and inner/outer halo subsamples can be recognized. As indicated in Table 5, the thick disk stars show near-solar [Ni/Fe] ratios while the inner halo and outer halo stars show ∼0.10 dex lower [Ni/Fe] ratios in [Fe/H] >−2.5. The difference between the two halo subsamples is not very clear. All of the subsamples show relatively small scatter (⩽0.09 dex) of [Ni/Fe] ratios about the mean value. Nissen & Schuster (2010) reported the underabundance of Ni in low-α stars. Although the present study does not have very high precision to convincingly confirm this argument, the low-[Mg/Fe] stars (gray circled symbols) tend to show lower [Ni/Fe] than the other stars (predominantly the thick disk stars and thick disk/inner halo intermediate stars) in [Fe/H] ≳ −1.2.
Nickel isotopes are produced in both deep layers of massive stars and in Type Ia SNe (Woosley & Weaver 1995; Timmes et al. 1995). The observed difference in [Ni/Fe] among the thick disk and the inner/outer halo stars at [Fe/H] >−2.5 may indicate that the relative contribution of massive stars and Type Ia SNe to the Ni production is different among the progenitors of these subsamples.
The [Zn/Fe] ratios show an interesting difference between the subsamples as can be seen in the bottom right panel of Figure 7. The thick disk stars show supersolar [Zn/Fe] values with relatively small scatter over all metallicities. The inner halo stars show slightly lower [Zn/Fe] particularly in [Fe/H] >−1.0 with a modest scatter. The outer halo stars show lower [Zn/Fe] than the other two subsamples in the intermediate metallicity range with a scatter similar to the inner halo stars. One outer halo star G 112−43, which constitutes a common-proper-motion system with G 112−44, shows an exceptionally high-[Zn/Fe] abundance compared to the other outer halo stars. Such a peculiar abundance for this star is previously noted by Nissen & Schuster (2010, 2011).
Nissen & Schuster (2011) reported that in −1.6 < [Fe/H] <−0.4, the thick disk stars and the high-α halo stars show constantly high-[Zn/Fe] ratios while those of the low-α stars show a mildly decreasing trend with [Fe/H]. In this metallicity, a similar difference can be recognized in our sample: the [Zn/Fe] ratios of low-[Mg/Fe] stars (gray circled symbols) are lower than other stars on average. Additionally, the difference seems to continue toward a lower metallicity of [Fe/H] ∼−2.0 in the present sample. In the much lower metallicity range ([Fe/H] <−2), both the inner halo and the outer halo stars show supersolar [Zn/Fe] ratios in agreement with previous studies (Cayrel et al. 2004; Takeda et al. 2005; Lai et al. 2008).
At low metallicities ([Fe/H] ≲ −2.5), Zn is thought to be produced in the deep complete Si-burning region in massive Type II SNe (Umeda & Nomoto 2005; Kobayashi et al. 2006). Umeda & Nomoto (2005) suggest that the ejection of Zn is more enhanced in higher energy SNe, which is called hypernovae. Zinc is also thought to be synthesized through a weak s-process component in massive stars (Timmes et al. 1995). The observed supersolar [Zn/Fe] in our sample, therefore, could be a signature of the hypernovae and/or neutron-capture process in massive stars. At higher metallicities, the contribution from the s-process in low-mass asymptotic giant branch (AGB) stars and Fe production through Type Ia SNe could affect the observed [Zn/Fe] (Timmes et al. 1995). The [Zn/Fe] differences among the three subsamples predominantly seen in [Fe/H] >−2.0 indicate different contributions of Type Ia and AGB products in the progenitor interstellar medium (ISM) of these populations. Additionally, the difference in mass and/or metallicity of stars responsible for the Zn production may also affect the observed abundance differences. Deeper understanding of the [Zn/Fe] among different populations requires more robust estimates of Zn yields and their production timescales in various astrophysical sites.
4.1.4. Cobalt and Copper
The [Co/Fe] ratios of the thick disk, inner halo, and outer halo stars all show similar behavior against [Fe/H], namely, the [Co/Fe] is close to the solar value in [Fe/H] >−2.0, while it is ∼0.2 dex in lower metallicities. The scatter of 0.10–0.19 dex may partly be attributed to the observational error, since only one line, which is particularly strong in giant stars, is used for the abundance estimate in most of the sample stars. The enhanced [Co/Fe] ratios in [Fe/H] <−2.0 generally agree with the results of Cayrel et al. (2004) and Lai et al. (2008).
Cobalt is produced in both Type II and Type Ia SNe (Timmes et al. 1995; Kobayashi et al. 2006). A chemical evolution model of Timmes et al. (1995) suggests that the trend in [Co/Fe] with respect to [Fe/H] is determined by the dependence of Co ejection on mass/metallicity of massive stars and by the production of Fe through Type Ia SNe. The observed similarity in [Co/Fe] among the thick disk, inner halo, and outer halo subsamples is in contrast to the [Zn/Fe], for which abundance differences among the three subsamples are identified. This result suggests that, unlike [Zn/Fe], [Co/Fe] ratios are relatively insensitive to star formation/chemical enrichment histories in various progenitor systems.
The [Cu/Fe] ratios are plotted against [Fe/H] in the bottom right panel of Figure 7. The downward arrows are overlaid for the sample stars for which only an upper limit has been obtained. The thick disk stars show near to subsolar [Cu/Fe] ratios in the range −0.5 to 0.0. Both of the inner halo and outer halo stars show lower [Cu/Fe] (∼ − 0.8) at metallicities up to [Fe/H] ∼−1.0 with much larger scatter. The lower [Cu/Fe] for the halo stars than the thick disk stars is consistent with the results of Mishenina et al. (2002) and Reddy et al. (2006). An increasing [Cu/Fe] trend with [Fe/H] is modestly seen in the thick disk and the inner halo subsamples, while the trend is not clear in the outer halo subsample.
A large fraction of Cu is thought to be produced in a neutron-capture process in massive stars during their convective core He-burning and the shell C-burning (e.g., Pignatari et al. 2010). The neutron source in these stars is mostly provided by the 22Ne(α,n)25Mg reaction, where 22Ne is produced from CNO isotopes. Thus, in this scenario, the production of Cu depends on the initial CNO composition of the progenitor star. This production channel of Cu may explain the modest increasing [Cu/Fe] trend with [Fe/H] for the thick disk and the inner halo stars. If this production channel is dominant at [Fe/H] >−1.5, the lower [Cu/Fe] ratios for some inner/outer halo stars may require extra enrichment of Fe presumably from Type Ia SNe.
4.1.5. Light Neutron-capture Elements: Sr, Y, and Zr
The [Sr/Fe] abundances are near-solar with scatter 0.07–0.25 dex for both of the inner halo and the outer halo subsamples (the top panel of Figure 8). Although only one thick disk star has the Sr abundance measurement, the abundance of this star seems to agree with the inner/outer halo stars with similar metallicity. The trends for the inner halo and the outer halo stars are indistinguishable. The near-solar [Sr/Fe] in [Fe/H] >−2.0 is in agreement with previous studies (Gratton & Sneden 1994; Burris et al. 2000), and the large dispersion in lower metallicity is also consistent with previous studies (McWilliam et al. 1995; Burris et al. 2000; Honda et al. 2004; François et al. 2007), although the sample size with [Fe/H] <−2.0 in this study is not large enough to quantify the scatter.
For [Y/Fe] ratios, the three subsamples show relatively large abundance scatter in all metallicities. We note that two stars, BD+04°2466 and G 18–24, with exceptionally high [Y/Fe], are the Y- and Ba-rich stars reported previously (Burris et al. 2000; Zhang et al. 2009; Ishigaki et al. 2010) and marked in Figure 8 with large open circles. The former was found to be a spectroscopic binary (Jorissen et al. 2005), while the binary nature of the latter is unclear (Latham et al. 2002).
The different behavior in the thick disk, inner halo, and outer halo subsamples is modestly apparent in [Fe/H] >−1.5. The thick disk stars show the [Y/Fe] slightly below the solar value with a scatter of 0.14 dex. On the other hand, some of the inner halo stars show the [Y/Fe] above the solar value. Finally, the outer halo stars show, again, near to subsolar [Y/Fe]. In the lower metallicity, the inner halo and the outer halo subsamples both seem to show decreasing [Y/Fe] ratios with decreasing [Fe/H] with a large scatter of ⩾0.20 dex.
Our results for the thick disk stars are generally consistent with the previous studies of Bensby et al. (2005), Prochaska et al. (2000), and Reddy et al. (2006). The decreasing [Y/Fe] for the halo stars with decreasing [Fe/H] is also consistent with the results of Gratton & Sneden (1994) and François et al. (2007).
[Zr/Fe] ratios in the range [Fe/H] >−1.5 show a hint of difference among the subsamples in that the inner/outer halo stars seem to be more enhanced with [Zr/Fe] than the thick disk stars. In the lower metallicity, [Zr/Fe] is higher in the thick disk stars than in the halo stars. The [Zr/Fe] trend with [Fe/H] for the halo stars is in agreement with that reported by Gratton & Sneden (1994). Such a trend in [Zr/Fe] ratios toward lower [Fe/H] has also been reported by François et al. (2007). In this study, we show that the decreasing trend toward lower [Fe/H] is seen only for the inner/outer halo stars with [Fe/H] <−2.0, while it is not seen for the thick disk stars.
In the solar metallicity, a large fraction of Sr, Y, and Zr is thought to be synthesized through the s-process in low-to-intermediate mass AGB stars. In the lower metallicity, it has been suggested that another nucleosynthesis component is needed to explain observed abundance patterns of extremely metal-poor stars (e.g., Honda et al. 2006). We discuss this point by taking the ratio of these elements to Ba in Section 4.1.7.
4.1.6. Heavy Neutron-capture Elements: Ba, La, Nd, Sm, and Eu
Similar to the behavior seen in the [Y/Fe]–[Fe/H] diagram, two of the sample stars, G 18–24 and BD+04°2466, stand out in abundance ratios for Ba, La, Nd, and Sm, which may suggest that surface composition has been modified during their internal evolution.
All of the three subsamples show a similar [Ba/Fe] trend with [Fe/H]; [Ba/Fe] is near-solar in the range [Fe/H] >−1.5, while it decreases toward lower [Fe/H]. The near-solar [Ba/Fe] ratios for the thick disk stars are in agreement with previous studies (Prochaska et al. 2000; Reddy et al. 2006). The observed decreasing [Ba/Fe] with decreasing [Fe/H] observed for the halo stars is also consistent with the trend reported by Gratton & Sneden (1994) and François et al. (2007).
For the [La/Fe], [Nd/Fe], and [Sm/Fe] ratios, a hint of a different trend with [Fe/H] between the thick disk and the inner/outer halo subsamples is modestly seen; the abundance ratios for the thick disk stars show a flat trend with [Fe/H] at values close to the solar ones, while the ratios for the inner/outer halo stars seem to increase with increasing [Fe/H]. In particular, at the highest metallicities, the inner/outer halo subsamples show clear overabundance at 0.42–0.60 dex on average, which is not seen in the thick disk subsample (see Table 5). In the study of Mashonkina et al. (2004), who performed Nd abundance analysis of 60 thin disk, thick disk, and halo stars, using a spectral synthesis techniques, such an abundance difference between the thick disk and halo stars was not identified. Instead, they reported that a similar overabundance of [Nd/Fe] in the range 0.23–0.45 dex for both thick disk and halo stars exists in their overlapping metallicity range. We note that some offset in abundances between the two studies exists since Mashonkina et al. (2004) employed empirical log gf values while this study adopts the log gf values from Ivans et al. (2006), which were originally taken from the measurement by Den Hartog et al. (2003). Further precise studies on the heavy neutron-capture elemental abundances between the thick disk and halo stars in their overlapping metallicity range with a larger sample are desirable to convincingly conclude the abundance differences among the different Galactic populations.
4.1.7. [X/Ba]–[Ba/H] Diagrams for Neutron-capture Elements
Abundance ratios among neutron-capture elements are widely used as a diagnostic for possible nucleosynthesis sites of these elements (e.g., François et al. 2007). Figure 9 shows [Sr/Ba], [Y/Ba], [Zr/Ba], [Nd/Ba], and [Sm/Ba] ratios plotted against [Ba/H] for the thick disk, inner halo, and outer halo subsamples. The values for the solar-system s- and r-process components from Arlandini et al. (1999) are indicated by the dotted and dash-dotted lines, respectively.

Figure 9. [Sr/Ba], [Y/Ba], [Zr/Ba], [Nd/Ba], and [Sm/Ba] ratios plotted against [Ba/H]. The symbols are the same as in Figure 7. The abundance ratios of the solar-system s-process (dotted) and r-process (dash-dotted) components predicted by Arlandini et al. (1999) are indicated by horizontal lines.
Download figure:
Standard image High-resolution imageIn the range [Ba/H] <−2.0, abundance ratios of the lighter neutron-capture elements, Sr, Y, and Zr, for most of the sample stars show higher values than those for the solar-system r-process component and an increasing trend toward lower [Ba/H]. Both the inner halo and the outer halo stars, as well as thick disk stars, seem to follow the above trend. Such a trend has previously been reported by François et al. (2007), in which it was interpreted as a possible indication that an extra production mechanism for lighter neutron-capture elements over heavier ones is required. The mechanism likely responsible for the excess of light neutron-capture elements is frequently called the Light Element Primary Process. Their nature and astrophysical sites are investigated by nucleosynthesis calculations in core-collapse SNe (Wanajo et al. 2011; Arcones & Montes 2011). Our results imply that the mechanisms responsible for the Sr, Y, and Zr enrichment were commonly efficient among the progenitor of the thick disk, inner halo, and outer halo stars with [Ba/H] <−2.0.
In [Ba/H] above ∼ − 1.5, [Nd/Ba] and [Sm/Ba] ratios for a majority of the thick disk stars and some inner/outer halo stars are below the solar-system r-process values. This result is consistent with the previous study of Mashonkina et al. (2004). A possible indication is that the s-process may have contributed to the chemical enrichment in progenitors of both the thick disk and inner/outer halo components. In the next subsection, we will discuss the r- and s-process contribution to the observed abundances of neutron-capture elements in our sample based on the Eu abundances.
4.1.8. Europium
The bottom right panels of Figure 8 show the [Eu/Fe] abundance ratios plotted against [Fe/H] for the thick disk, inner halo, and outer halo subsamples. The most remarkable feature in these plots is that the [Eu/Fe] ratios are more enhanced in the inner/outer halo subsamples than in the thick disk subsample by ∼0.2–0.3 dex in the metallicity range of [Fe/H] >−1.5. In Table 5, the mean values for the three subsamples taking into account only dwarfs (μd) or giants (μg) are also indicated. The μd for [Eu/Fe] in the inner and outer halo subsamples is again larger than that in the thick disk subsample at metallicities [Fe/H] >−1.5, while differences in μg among the three subsamples are not clear. Although further confirmation with a larger sample is desirable for a definite conclusion, the difference in μd may indicate that the abundance difference is not totally caused by systematic errors due to the inclusion of both dwarfs and giant stars in our sample.
To examine whether the enhanced [Eu/Fe] ratios observed in the inner and outer halo stars are caused by an excess of the r- or s-process contribution to the production of Eu, the middle and bottom panels of Figure 10 show the [Eu/Ba] and [Eu/La] ratios in the sample stars as well as the values for the pure r- and s-process components in the solar-system material predicted by Arlandini et al. (1999). The [Eu/Ba] ratios in many of the inner halo and outer halo subsamples show a flat trend with [Fe/H] up to [Fe/H] ∼−1.5 and do not significantly deviate from the value for the solar-system r-process component ([Eu/Ba] ∼0.7). In the same metallicity range, the thick disk subsample, on the other hand, predominantly shows the [Eu/Ba] ratios below the flat inner/outer halo trend.

Figure 10. Same as Figure 7, but for [Eu/Fe], [Eu/Ba], and [Eu/La]. The abundance ratios of the solar-system s-process (dotted) and r-process (dash-dotted) components predicted by Arlandini et al. (1999) are indicated by horizontal lines.
Download figure:
Standard image High-resolution imageSimilar behavior can be seen in the [Eu/La] versus [Fe/H] plot. Again, in the metallicity range of [Fe/H] >−1.5, the thick disk stars tend to show lower [Eu/La] ratios than the typical inner/outer halo stars. Some of the inner/outer halo stars including the known s-rich stars show much lower [Eu/Ba] and [Eu/La] ratios close to the values for the solar-system s-process component.
These results suggest that Eu in our inner/outer halo sample stars is predominantly an r-process origin. In contrast, the observed lower [Eu/Ba] and [Eu/La] ratios in the thick disk stars may indicate the contribution of the s-process to the chemical enrichment during the formation of the thick disk. A similar conclusion has been reached for the thick disk stars by previous studies (Mashonkina & Gehren 2000; Bensby et al. 2005).
If Eu is an r-process origin and if the r-process elements are predominantly ejected in Type II SNe as α elements, it is puzzling that the trend found in the [Eu/Fe] ratios for these stars does not follow that seen in the α elements. As can be seen in the top and middle panels of Figure 11, while the [Mg/Fe] ratios in many of the inner/outer halo stars follow a decreasing trend with increasing [Fe/H] (Paper I), the [Eu/Fe] ratios for these stars do not. This result is in contrast to the expectation that the [Mg/Fe] and [Eu/Fe] ratios would show a similar trend with [Fe/H] if Mg and Eu are produced in the same astrophysical site, presumably Type II SNe of massive stars. Rather, the stars with low [Mg/Fe] ratios (gray circled symbols) in our sample tend to show higher [Eu/Fe] ratios.

Figure 11. [Eu/Mg] ratios plotted against [Mg/H]. The symbols are the same as in Figure 7.
Download figure:
Standard image High-resolution imageThe difference in the behavior of the Eu and Mg abundances can be more clearly seen in the bottom panel of Figure 11, where the [Eu/Mg] ratios are plotted against [Mg/H]. In this plot, the thick disk stars show almost a flat [Eu/Mg] trend for all of the [Mg/H] range at about the solar value, while the inner/outer halo stars exhibit larger values of [Eu/Mg], mildly increasing with increasing [Mg/H]. The similar [Eu/Mg] enhancement has been reported previously by Letarte et al. (2010) for stars in Fornax dwarf spheroidal galaxy. Unlike the present sample, the Fornax stars were found to be rich in s-process elements like Ba, and thus the enhanced [Eu/Mg] ratios have been interpreted as due to the excess of the s-process in this galaxy (Letarte et al. 2010). A different interpretation is likely needed to explain the high [Eu/Mg] for the present sample since the signature of significant s-process enrichment like that seen in Fornax is not observed in these stars as mentioned above.
The implications of these results are twofold: (1) on the astrophysical site of the r-process and (2) on the different chemical enrichment histories in the progenitors of the thick disk and the inner/outer stellar halos. For point (1), the results favor the scenario that the astrophysical site which produces Eu is different from that for Mg. Magnesium is thought to be largely synthesized in massive stars during the hydrostatic burning and ejected through Type II SNe, while more than 90% of Eu in the solar-system material is thought to be synthesized in the r-process (Arlandini et al. 1999), whose astrophysical site is still unknown. A Type II SN of a relatively low-mass progenitor (8–10 M☉) is suggested to be the primary site for the r-process (e.g., Wheeler et al. 1998). These low-mass SNe as well as higher mass >20 M☉ SNe are considered in the Galactic chemical evolution model and are shown to be consistent with observations of metal-poor stars (Ishimaru & Wanajo 1999). Alternatively, neutron-star mergers are also suggested as a possible r-process site (Freiburghaus et al. 1999). Each of these scenarios suffers from large theoretical uncertainties and thus the r-process site remains controversial (e.g., Argast et al. 2004). The observed signature of the different trends in the [Eu/Fe] and the [Mg/Fe] ratios appear to be consistent with the scenario that Type II SNe of different progenitor mass ranges are responsible for the production of dominant Eu (8–10 M☉) and Mg (e.g., >10 M☉), which was also suggested from chemical evolution models (e.g., Tsujimoto & Shigeyama 1998). However, the high-[Eu/Mg] ratios at [Fe/H] >−1.5 seen in the inner/outer halo stars may require that the Eu production have a much longer timescale than Mg. Whether an alternative scenario such as neutron-star mergers can explain the abundance results must be tested by chemical evolution models taking into account the star formation history in possible progenitor systems of the thick disk and stellar halo.
For point (2), on the chemical enrichment histories in the progenitors of the thick disk and stellar halo, Paper I showed that the [Mg/Fe] ratios in the inner/outer halo stars show a decreasing trend with [Fe/H] and lower than in the thick disk stars. Low [Mg/Fe] ratios in stars with [Fe/H] >−1.5 are frequently interpreted as the result of a larger contribution of Fe from Type Ia SNe in these stars, presumably due to the lower star formation rate in their progenitor systems. However, rather enhanced [Eu/Fe] ratios found in the low-[Mg/Fe] stars in our sample may indicate difficulty in interpreting their abundances by this simple picture alone. This is because the larger contribution of Fe would also reduce the [Eu/Fe] ratios in these low-[Mg/Fe] stars than in the thick disk stars, which is in contrast to the observed trend. Chemical evolution models that allow variation of not only star formation rates, but also other factors such as an IMF may be necessary to explain the observed behavior of [Eu/Fe] and [Mg/Fe] ratios consistently among the thick disk and halo stars.
4.2. Abundance Kinematics Correlation
4.2.1. Abundance Patterns of Stars with Extreme Kinematics
Figure 12 highlights the abundances of stars with extreme orbital parameters: i.e., stars having extreme rotational velocities (Vϕ < −150 or >250 km s−1: stars), high maximum distance from the Galactic plane (Zmax > 20 kpc: crosses), large apocentric distance (Rapo > 30 kpc: diamonds), and eccentricity close to unity (e > 0.95: asterisks). Stars that meet more than one of the four categories are shown with overlapping symbols. Mean abundances of the typical inner halo stars with PIH > 0.95 in each metallicity bin of 0.5 dex are shown by the solid lines, where the dotted lines show a range in mean ± dispersion if there are ⩾2 stars in each [Fe/H] interval. The extreme cut of PIH > 0.95 was employed to exclude possible contamination of stars with thick disk-like or outer-halo-like kinematics.

Figure 12. [X/Fe]–[Fe/H] diagram for stars with extreme kinematics: stars with extreme rotational velocities (Vϕ < −150 or >250 km s−1; stars), high maximum distance from the Galactic plain (Zmax > 20 kpc; crosses), large apocentric distance (Rapo > 30 kpc; diamonds), and orbital eccentricity close to unity (e > 0.95; asterisks). The other sample stars are shown in gray symbols. The solid line in each panel connects mean abundance of the inner halo stars with PIH > 0.95 in each of the 0.5 dex [Fe/H] intervals. The dotted lines indicate the range within 1σ scatter about the means.
Download figure:
Standard image High-resolution imageIt can be seen that in the metallicity below [Fe/H] ∼−2.0, stars with any of the extreme orbital parameters will overlap with the typical inner halo distribution. On the other hand, at higher metallicities ([Fe/H] ≳ −2), deviation from the typical inner halo distribution for some elements is identified. Both stars with extreme rotational velocities and large apocentric distance show signatures of lower [Mg/Fe], [Na/Fe], [Ni/Fe], and [Zn/Fe] ratios than the other stars in [Fe/H] >−2.0. The stars with orbital eccentricity close to unity seem to be more similar to the normal halo stars.
These results imply a possible correlation of chemical abundances with some of the orbital parameters in [Fe/H] ≳ −2.0, while no correlation is expected in the lower [Fe/H]. The abundance–kinematics correlation in the metallicity range −1.5 < [Fe/H] <−0.5 is examined in the next subsection.
4.2.2. Abundance Ratios versus Orbital Parameters
In the previous subsections, we show the differences in elemental abundances in the range [Fe/H] >−2.0 between stars with extreme kinematics and the stars having typical inner halo kinematics. In order to examine whether the observed differences came from any correlation between [X/Fe] with the orbital parameters among the inner and outer halo stars, we calculate the linear correlation coefficient for the [X/Fe] with Vϕ, Zmax, Rapo, and orbital eccentricity e and probability at which a null hypothesis of no correlation can be rejected. Some of the [X/Fe] ratios appear to be weekly correlated with [Fe/H]. In order to reduce the effect of the [X/Fe] versus [Fe/H] correlation in examining the [X/Fe] versus orbital parameter correlation, we limit the sample stars to those with metallicity −1.5 < [Fe/H] <−0.5. Elements for which more than 20 stars are available in the above metallicity range are considered. As a result, we found that for Na, Sc, Ni, and Zn, the possible correlation is suggested for one or more of the above orbital parameters with the probability for the null hypotheses of less than 5%.
Figure 13 plots (top to bottom) [Na/Fe], [Sc/Fe], [Ni/Fe], and [Zn/Fe] as a function of (left to right) Vϕ, log Zmax, log Rapo, and e for the sample stars with −1.5 < [Fe/H] ⩽−0.5. As in Figure 7, the crosses, filled circles, and filled triangles indicate the thick disk stars, the inner halo stars, and the outer halo stars, respectively. Their intermediate populations are shown in the open symbols (thick disk/inner halo: open circles; inner halo/outer halo: open triangles).

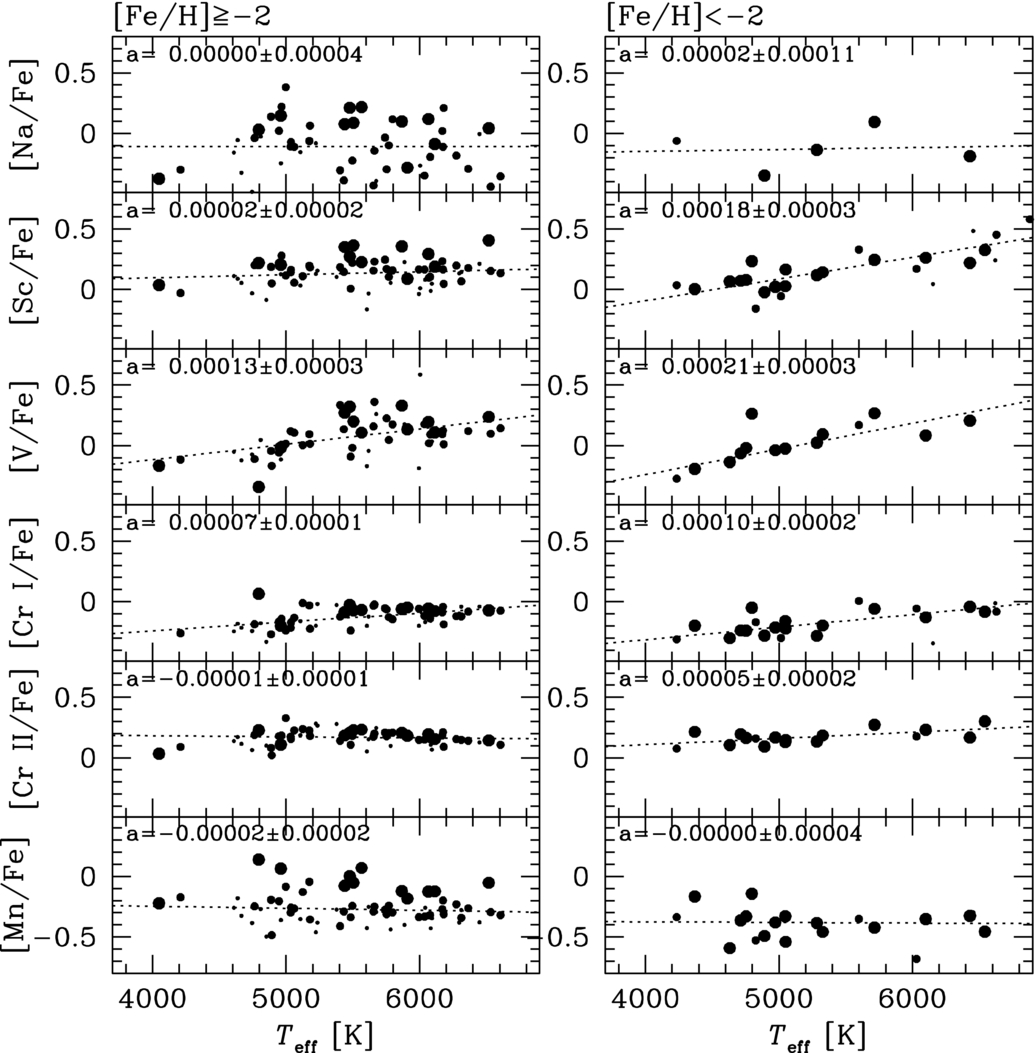
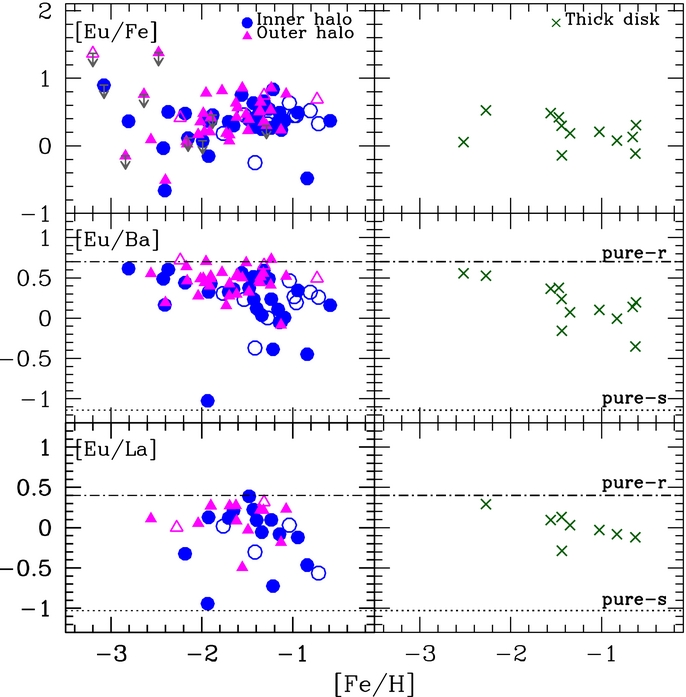
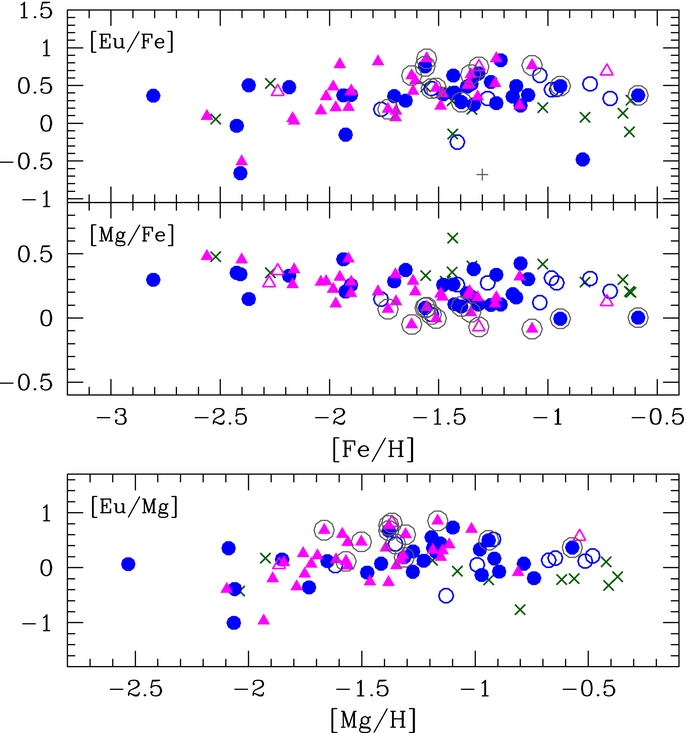
Figure 13. From top to bottom: [Na/Fe], [Sc/Fe], [Ni/Fe], and [Zn/Fe] plotted against orbital parameters. From left to right: Vϕ, log Zmax, log Rapo, and orbital eccentricity in the metallicity range −1.5 < [Fe/H] ⩽−0.5. The mean values and their 1σ scatter in each bin of the orbital parameters are indicated with solid and dotted lines, respectively. The symbols are the same as in Figure 7.
Download figure:
Standard image High-resolution image
In the [X/Fe] versus Vϕ plot, the stars on retrograde orbit (Vϕ < 0.0) tend to show lower abundance ratios compared to the stars with prograde orbits including thick disk stars (cross) and thick disk/inner halo intermediate stars (open circles). One outer halo star with an extreme prograde rotation (Vϕ ∼ 280 km s−1) clearly shows a different abundance pattern compared to the thick disk stars.
In the [X/Fe] versus log Zmax plot, the abundance scatter appears to be larger in Zmax > 1 kpc. The Zmax ∼ 1 kpc corresponds to the transition between the thick disk dominant to the inner halo dominant region according to Carollo et al. (2010). At larger Zmax, the trend is not very clear for all of the elemental abundances.
In the [X/Fe] versus log Rapo plot, stars with Rapo > 30 kpc clearly show lower [Na/Fe] and [Ni/Fe] ratios compared to the other halo stars with smaller Rapo.
Interestingly, the correlation between the [X/Fe] and e can be seen for all of the four elements. The calculated probability for the null hypothesis of no correlation is less than 2% for these elements. As mentioned in the previous subsection, the highest e stars consist of both the inner and outer halo stars in our sample. This might partly reflect our selection of high-velocity stars in the solar neighborhood, which preferentially select high-eccentricity stars. The tendency for these stars to have different chemical properties may result from our selection bias toward stars accreted from other systems, although such population may not be dominant in the inner halo region as suggested by Carollo et al. (2010)
5. SUMMARY AND DISCUSSION
We estimate elemental abundances of sodium, iron-peak, and neutron-capture elements of 97 dwarf and giant stars kinematically belonging to the MW thick disk, inner halo, and outer halo components in the metallicity range of −3.3 < [Fe/H] <−0.5. Using these samples, characteristic trends in the [X/Fe]–[Fe/H] diagrams for each of the three subsamples are investigated as a clue to the formation mechanisms of these old Galactic components. Our results show that the abundances are largely similar among the thick disk, inner halo, and outer halo subsamples in the metallicity range of [Fe/H] <−2. In contrast, the abundance differences for some elements among the three subsamples are identified at higher metallicities ([Fe/H] ≳ −1.5). Our main results are summarized as follows.
- 1.The inner halo and outer halo stars show lower [Na/Fe], [Ni/Fe], [Cu/Fe], and [Zn/Fe] ratios than the thick disk stars in the metallicity range of [Fe/H] >−1.5. In particular, the sample stars with relatively low [Mg/Fe] show low [Zn/Fe] ratios compared to the other halo stars, which is in line with the results of Nissen & Schuster (2011).
- 2.All of the three subsamples show an increasing [Mn/Fe] trend with [Fe/H], which may suggest that Mn from Type Ia SNe has contributed to enriching the progenitors of the thick disk, inner and outer stellar halos.
- 3.The [Eu/Fe] ratios in the inner/outer halo stars are higher than in the thick disk stars in the range [Fe/H] >−1.5. This behavior is in contrast to that seen in [Mg/Fe] ratios, for which many of the inner/outer halo stars show lower values than the thick disk stars. The different behavior of [Eu/Fe] and [Mg/Fe] ratios for the three subsamples may imply that the production site of Eu is different from that of Mg, although more exact interpretations require detailed chemical evolution modeling in possible progenitors of the thick disk and stellar halos as well as determination of yields for these elements.
- 4.The [Eu/Ba] and [Eu/La] ratios for the thick disk stars and a handful of the inner halo stars are below the values expected for the solar-system r-process component (Arlandini et al. 1999), which may indicate the contribution of the s-process from low-to-intermediate mass AGB stars to the chemical enrichment in the progenitors of these stars. On the other hand, many of the inner and outer halo stars follow the flat trend up to [Fe/H] ∼−1.5, likely suggesting that the r-process dominates in synthesizing heavy neutron-capture elements in their progenitor systems.
- 5.The inner/outer halo stars with extreme retrograde rotation, large Zmax, and large Rapo tend to show lower [Na/Fe], [Ni/Fe], and [Zn/Fe] ratios than those with normal inner halo kinematics in [Fe/H] >−2. In the lower metallicities, the abundances are almost indistinguishable among the kinematically different populations.
- 6.In our inner and outer halo subsamples with metallicities −1.5 < [Fe/H] ⩽−0.5, signatures of the correlation between [Na/Fe], [Sc/Fe], [Ni/Fe], and [Zn/Fe] ratios and the orbital eccentricity are identified.
Based on the above results, we discuss the possible formation mechanisms of the thick disk, inner and outer stellar halos, with particular focus on what are the likely progenitors of these components.
5.1. The Thick Disk
Several scenarios from theoretical models for the thick disk formation are proposed; (1) monolithic dissipative collapse of a disk component (e.g., Burkert et al. 1992), (2) the mergers of satellites that are tidally disrupted to populate the thick disk (e.g., Abadi et al. 2003), (3) heating a pre-existing thin disk through numerous mergers of dark matter subhalos or dwarf galaxies (e.g., Quinn et al. 1993; Velázquez & White 1999; Hayashi & Chiba 2006), (4) multiple dissipative mergers of building blocks that trigger rapid star formation (e.g., Brook et al. 2004, 2005), and (5) early evolution of a gas-rich clumpy young disk (e.g., Bournaud et al. 2009). It has also been proposed that (6) the secular radial migration of the thin disk may be responsible for the thick disk formation (e.g., Haywood 2008; Schönrich & Binney 2009). Which of the above mechanisms is dominant and how the formation of the thick disk relates to the formation of the other Galactic components, namely, the bulge, thin disk, and stellar halo, are still controversial.
In the present study and in Paper I, we found the remarkable abundance difference for several elements between the thick disk and the inner/outer halo stars in their overlapping metallicity range (−1.5 ≲ [Fe/H] ≲ −0.5). The main implications from this result on the formation mechanisms of the thick disk component are summarized as follows; first, the high-[Na/Fe] ratios, as well as high-[Mg/Fe] ratios reported in Paper I, compared to many of the inner/outer halo stars indicate that chemical evolution of the thick disk was driven primarily through nucleosynthesis products from Type II SNe. This may suggest that the thick disk formation timescale was sufficiently short and/or the IMF in the progenitor of the thick disk was biased toward high-mass stars so that nucleosynthesis products of low-mass stars (i.e., Type Ia SNe) played a minor role. Second, the increase in [Mn/Fe] with [Fe/H] for the thick disk stars indicates that some contribution of Type Ia SNe may present, since Mn is predominantly synthesized in the explosive burning of Type Ia SNe in the metallicity typical of the thick disk stars (Kobayashi & Nakazato 2011). Third, the [Eu/Ba], [Eu/La], [Sm/Ba], and [Nd/Ba] ratios for the thick disk are below the values expected for the solar-system r-process components, which suggests that the s-process has contributed to the chemical enrichment of the thick disk. Fourth, the lower [Eu/Fe] and [Eu/Mg] ratios in the thick disk stars than in the inner/outer halo stars further support distinct chemical enrichment histories among these components, while its interpretation depends on a currently unknown astrophysical site for Eu production. Finally, for most of the elements, scatter in the abundance ratios for the thick disk stars is comparable to or smaller than the observational errors, which is in contrast to that for the inner/outer halo stars with [Fe/H] >−1.5. The lack of scatter may indicate that the gas from which the thick disk has formed may have been relatively well mixed.
The short timescale for the formation of the thick disk might be expected in scenarios (1), (4), and (5), where sufficient cold gas is supplied in the form of smooth gas accretion (Bournaud et al. 2009) or multiple gaseous mergers (Brook et al. 2004) at high redshift. Scenarios (3) and (6) could also be possible if a pre-existing thin disk formed under the sufficiently high star formation rate so that the whole disk stars rapidly became metallicity as high as the thick disk stars. In each of the above cases, the nucleosynthesis products of Type Ia SNe and s-process should have been rapidly mixed in the ISM. Consistent with previous studies, the abundances of the thick disk stars in our sample do not resemble those of the known dwarf satellite galaxies around the MW, like Fornax, whose abundance is characterized by much lower [α/Fe] and [Na/Fe] and higher [Ba/Fe] at similar [Fe/H] (Letarte et al. 2010). Therefore, it is unlikely that the thick disk has been totally built through an assembly of dSphs having similar properties as surviving Galactic dSphs (e.g., scenario (2)).
The four thick disk stars with [Fe/H] <−0.8 in our sample, all of which have kinematic properties similar to the proposed MWTD component, have particular implication on the earliest evolution of the MW thick disk. As shown in the previous sections and in Paper I, the candidate MWTD stars show distinct abundance ratios for several elements from those of the inner/outer halo stars at metallicities [Fe/H] ≳ −1.5. Even though the abundance ratios in the candidate MWTD become almost indistinguishable from the inner/outer halos at lower metallicities, their trends with [Fe/H] seem to smoothly follow those seen in the canonical thick disk stars (i.e., the thick disk stars with −0.8 < [Fe/H] <−0.5) with relatively small scatter. This result implies that these candidate MWTD stars may have indeed formed within the progenitors of the thick disk, which are distinct from those of the stellar halo. In other words, our result favors the interpretation that they are remnants of the ancient MW disk system rather than the interloper of the halo population that happened to acquire disk-like kinematics. A possible implication is that whatever the formation mechanism is, the progenitor of the thick disk may have been a member of a metal-poor disk system, which later experienced relatively rapid and homogeneous chemical evolution. Further studies on the detailed chemical abundances versus kinematics as well as ages of individual metal-poor stars are necessary to get deeper insight into the formation of the thick disk and the origin of its MWTD component.
5.2. The Stellar Halos
One of the key questions on the global formation and evolution of the MW stellar halos is whether the halos have been assembled from smaller stellar systems similar to the dSph galaxies currently orbiting the MW. In the following subsections, we first address this question by examining whether the observed abundances in our inner/outer halo subsamples resemble those reported for stars in classical as well as ultra-faint dwarf galaxies. For this comparison, we separately consider two metallicity ranges ([Fe/H] >−2 and < − 2) since observed abundance trends for the inner/outer halo subsamples vary depending on their metallicity. Then, we discuss whether these abundances in the MW thick disk, inner and outer stellar halos are compatible with proposed MW formation scenarios based on other observations or numerical simulations.
5.2.1. Comparisons with MW dSph Galaxies
[Fe/H] <−2. In metallicities below −2.0, the abundances of several elements in both the inner and outer halo subsamples are found to be in general agreement with known classical and ultra-faint dwarf galaxies regardless of their kinematics. In this metallicity range, the inner/outer halo stars generally show enhanced [Mg/Fe] and [Si/Fe] ratios, near-solar ratios for [Ni/Fe] or [Sc/Fe], and the low [Mn/Fe] ratios. Similar abundance ratios were reported for the lowest metallicity stars ([Fe/H] ≲ −2.5) in classical dwarf galaxies like Draco (Cohen & Huang 2009), Ursa minor (Cohen & Huang 2010), Carina (Venn et al. 2012), and Sculptor (Starkenburg et al. 2013). The abundances of light elements (Z < 30) in newly discovered ultra-faint dwarf galaxies also show abundances similar to the halo stars (Frebel et al. 2010; Simon et al. 2010; Gilmore et al. 2013) in the whole metallicity range spanned by these stars ([Fe/H] ≲ −2.0).
Despite these similarities, our sample of both inner and outer halo stars with [Fe/H] <−2.0 also confirms some of the known discrepancies in abundances between the dSphs and MW halo stars. First, as discussed in Paper I, our sample of inner and outer halo stars both shows enhanced [Mg/Fe] ratios, while those in extremely metal-poor stars in Sextans dSph are systematically lower than the MW halo stars at similar metallicities (Aoki et al. 2009). Second, abundance ratios of neutron-capture elements like [Sr/Fe] or [Ba/Fe] tend to be low in both classical (Aoki et al. 2009; Venn et al. 2012) and ultra-faint dwarf galaxies (Koch et al. 2008; Frebel et al. 2010; Simon et al. 2010), with an exception of a possible binary star (Honda et al. 2011), while the field halo stars including our inner/outer halo samples exhibit both high and low abundances of these neutron-capture elements. In conclusion, the abundance differences as indicated above remain even if the present sample of the outer halo stars with extreme kinematics is taken into account. The suggested abundance differences in neutron-capture elements may point to some differences in chemical evolution between progenitors of the MW field halo and some of the dSphs. In order to get deeper insights into this discrepancy, chemical evolution modeling which takes into account star formation and mixing of elements within a small system as well as investigation of nucleosynthesis yields of neutron-capture elements at this low metallicity would be necessary.
To summarize, in the metallicity below [Fe/H] ∼−2.0, abundances of α and Fe peak elements in both of our inner and outer halo subsamples largely overlap with those of the extremely metal-poor stars in some of the classical and ultra-faint dwarf galaxies. The similarity supports the hypothesis that metal-poor stars in both of the inner and outer halos in this low-metallicity range are at least in part accreted from systems similar to many of the currently known classical and ultra-faint dwarf galaxies. We note that, as we have mentioned in Section 2.2, recent surveys suggest that the metallicity distribution function is different between the inner and outer halos, and thus, the inner halo stars with [Fe/H] ∼−2.0 are relatively minor population. Therefore, the accretions of such metal-poor dSphs-like systems are likely more dominant in the outer halo than in the inner halo.
[Fe/H] >−2. In this metallicity range, abundances of several elements in most of the outer halo stars, especially those with extreme kinematics, overlap with those in the MW dSph stars, while the stars with the typical inner halo kinematics typically show a larger discrepancy in the abundances from the dSphs as recognized in previous studies (Venn et al. 2004; Tolstoy et al. 2009). As an example, [Na/Fe] ratios in stars in Fornax and Sagittarius dSphs with −1.5 < [Fe/H] <−0.5 have been reported to be subsolar in a range −1 < [Na/Fe] <−0.2 (Letarte et al. 2010; Sbordone et al. 2007), while the present sample of the outer halo stars also shows subsolar [Na/Fe] ratios in contrast to the thick disk and some of the inner halo stars mostly showing the supersolar ratios. A similar trend is found in the [Ni/Fe] ratios, for which the outer halo stars largely show subsolar values similar to stars in Fornax and Sagittarius dSphs (Letarte et al. 2010; Sbordone et al. 2007), while the thick disk and some of the inner halo stars generally show supersolar values.
On the other hand, differences in Ba abundances in these dSph stars (Sbordone et al. 2007; Letarte et al. 2010) and the inner/outer halo stars seem to be substantial regardless of kinematics. Ba in moderately metal-poor stars is thought to be mainly produced in low-to-intermediate mass AGB stars. The difference between the MW inner/outer halo stars and the dSphs indicates that chemical enrichment by low-to-intermediate mass stars may be different in the progenitors of the inner/outer halo from the surviving dSphs.
Then, the intriguing question is: what is the origin of the kinematically classified outer halo stars with [Fe/H] >−2.0 which show chemical abundance ratios different from the normal inner halo stars? Again, we note that recent determination of the metallicity distribution function (e.g., An et al. 2013) suggests that the outer halo population is dominated by more metal-poor stars ([Fe/H] ∼−2.0), and thus our kinematically defined outer halo stars with [Fe/H] >−2.0 could be a relatively minor population (see Section 5.2.2). The implication from the abundance results in the present study and in Paper I is that the progenitors of these relatively metal-rich outer halo stars may have experienced a certain interval of chemical evolution that has allowed the system to be enriched with nucleosynthesis products of low-to-intermediate mass stars. It is clear that the currently known ultra-faint dwarf galaxies cannot be a dominant progenitor in metallicities [Fe/H] >−2, since they are more metal-poor and tend to show different chemical abundance patterns. Indeed, the known ultra-faint dwarf galaxies were reported to have much simpler stellar population which have ended their major star formation events at much earlier times than brighter dwarf galaxies (Okamoto et al. 2012). Although the surviving dSphs like Fornax or Sagittarius may not be a direct progenitor of these stars, the similarity in light elements may suggest that gas-rich systems that have longer star formation timescales have contributed to the relatively metal-rich part of the outer stellar halo.
5.2.2. Comparisons with Other Observations and Numerical Simulations
In order to accommodate the observed phase space and chemical abundance distributions, the formation of the stellar halo is believed to have involved multiple processes. These processes are frequently classified into two mechanisms, namely, a dissipational collapse of a proto-Galactic gas cloud within a very short timescale, which was introduced by a landmark study of Eggen et al. (1962), and dissipationless mergers of smaller stellar systems with much longer timescales, which was proposed by Searle & Zinn (1978). The existing observations of halo stars seem to favor the scenario that the inner part of the stellar halo is formed via dissipative collapse of gaseous proto-galactic fragments while the outer part has built up through dissipationless merging of small stellar systems (e.g., Chiba & Beers 2000; Carollo et al. 2007, 2010). Recently, An et al. (2013) studied metallicity of the stellar halo at heliocentric distances in the range 5–8 kpc based on the SDSS ugriz photometry. They found that the metallicity distribution function can be modeled with two Gaussian components with peaks at [Fe/H] ∼−1.7 and ∼ − 2.3, which favors the above scenario that at least two mechanisms are responsible for building up the present-day stellar halo. It was also shown that such a hybrid scenario can naturally occur in the context of galaxy formation theory under the current standard cosmology (e.g., Bekki & Chiba 2001; Zolotov et al. 2010; Font et al. 2011; McCarthy et al. 2012; Tissera et al. 2012, 2013).
Our results show that the inner halo at relatively low metallicity ([Fe/H] <−2) has similar abundance ratios as the outer halo and is broadly consistent with previous abundance results for the MW dSphs. This may suggest that, in [Fe/H] <−2, inner halo stars were, at least in part, assembled from progenitor systems similar to these dSphs. The presence of stars accreted from dSphs is also predicted from cosmological hydrodynamical simulation of McCarthy et al. (2012), which suggests that, although the inner halo is expected to be dominated by stars formed in situ within the proto-disk and later dynamically heated up to the halo region, a small fraction of accreted populations is indeed expected. In the higher metallicity range, the abundance ratios in the inner halo subsample for some elements were clearly different from those in the thick disk subsample. In particular generally larger dispersion in abundance ratios in the inner halo stars compared to those in the thick disk stars argues against the hypothesis that the inner halo component is entirely built up with a single dissipational collapse and star formation within a well-mixed gas. Rather, the results favor the scenario that multiple gas-rich systems that have experienced various levels of chemical evolution prior to the merging have contributed to the present-day inner halo.
The cosmological simulation of Zolotov et al. (2010) suggests that a certain fraction of inner halo stars are expected to form within the central region of a galaxy later heated up to halo-like orbits via mergers and such stars can be distinguished from accreted stars with their chemical abundances. Stars that are likely formed in such a process can indeed frequently be found in our inner halo subsample with [Fe/H] >−2, characterized as high [Mg/Fe], [Si/Fe], [Na/Fe], and [Zn/Fe] ratios. The simulation of McCarthy et al. (2012) suggests that the large fraction of the inner halo is populated by the stars formed in the disk system later puffed up by the dynamical heating via merging dark matter subhalos. The candidate of such population can be found in our sample stars having kinematics intermediate between the thick disk and the inner halo subsamples. These stars are found to have similar abundance as the thick disk stars inferring that a certain fraction of the halo is populated by stars originally belonging to the MW disk and later heated up while partly conserving their initial kinematics and chemical abundances.
Our outer halo subsample shows broadly similar abundance ratios of light elements (Z < 30) with many of the MW dSphs in [Fe/H] <−2.0, which may support the hypothesis that the outer stellar halo, where Carollo et al. (2007, 2010) found it to be dominant in [Fe/H] <−2, was assembled from stellar systems similar to the present-day low-luminosity MW dSphs. On the other hand, our outer halo subsample with higher metallicity ([Fe/H] >−2) shows different abundance ratios for some elements compared to the inner halo stars. Our sample of more metal-rich outer halo stars is generally similar to the low-α stars reported by Nissen & Schuster (2010, 2011) in terms of abundances (e.g., low [Na/Fe] and [Zn/Fe]) and kinematics (e.g., extreme retrograde orbit), although distinction from higher-α halo stars at a given [Fe/H] is not as clear as that observed in their works. These results may suggest that systems that have experienced extended period of chemical evolution including Type Ia SNe before their accretion may have contributed to relatively metal-rich outer halo stars in the solar neighborhood that have distinct abundances compared to the bulk of inner halo stars. The contribution of a certain fraction of the accreted stars is also suggested from medium resolution spectroscopic samples that include more distant halo stars (Schlaufman et al. 2012; Sheffield et al. 2012).
The present study of chemical abundances in the kinematically selected sample stars provides important insights into the progenitor systems that gave rise to the present stellar halo at least in the solar neighborhood. However, the number of sample stars is too small and incomplete to quantify the fractional contribution of accretions to build up the stellar halo in the solar neighborhood. Upcoming surveys such as Gaia and its spectroscopic followup will provide valuable insights into the origins of halo stars by measuring accurate phase-space information and chemical abundances of a large number of stars within several kpc from the Sun. Besides, kinematics and chemical abundance analysis of in situ outer halo stars at Galactocentric distance of several tens of kpc are important to constrain the nature of the outer stellar halo.
We are grateful to the referee for a careful reading of this manuscript and for a number of constructive comments, which have significantly improved our paper. We thank A. Tajitsu, T.-S. Pyo, and the staff members of the Subaru telescope for their helpful support and assistance with our HDS observation. M.N.I. is grateful to S. Wanajo and T. Tsujimoto for useful discussions and comments. This work is supported in part by Grant-in-Aid for Scientific Research (23740162,23224004) of the Ministry of Education, Culture, Sports, Science, and Technology of Japan.
Facilities: Subaru (HDS) - Subaru Telescope.