


ABSTRACT
We investigate the evolution of the ionization rates by the decay of radionuclides in protoplanetary disks at the early stage of planet formation where size growth and settling of dust particles proceed extensively. Because most of the nuclides to ionize gas, such as short-lived nuclide 26Al and long-lived one 40K, are refractory elements, they are contained in the solid material of dust particles. Thus, the ionization by these nuclides is affected by the following three processes: (1) the change of the relative abundance of dust particles due to the settling toward the midplane of the disk, (2) the energy loss of emitted energetic particles inside the solid material of dust particles, and (3) the absorption of energetic particles by the other dust particles located nearby. In this series of papers we comprehensively investigate the basic physical processes, calculate the settling and size growth of dust particles numerically, and clarify the evolution of the ionization rates relative to their initial values in various disk models at this stage. In this paper we investigate the energy-loss processes concerning dust particles, formulate the coalescence equation for settling particles, and apply them to quiescent disk models that are similar to the solar nebula. For simplicity, dust particles are assumed to be compact spheres that remain perfect sticking for mutual collisions. Because the settling of dust particles is not appreciable in the first 103 yr, the ionization rate varies little except in the outermost part near the disk surface. As the settling proceeds, the rate around the midplane increases considerably. The maximum ionization rates by 26Al in the minimum mass solar nebula are about 100, 51, and 14 times larger than their initial values for the orbits R = 0.5, 1, and 5 AU, respectively, which are close to or exceed the ionization rate by cosmic ray in the interstellar medium. The rates by 40K also increase by factors of about 36, 19, and 5 at the same orbits. In the inner orbital regions, these rates exceed the rates by the attenuated cosmic rays by an order of magnitude. The rates in the residual parts decrease extensively as time goes by, because amounts of the floating dust particles decrease continuously.
Export citation and abstract BibTeX RIS
1. INTRODUCTION
In the core accretion paradigm of planet formation, planetesimal formation in protoplanetary disks is the first step for the formation of rocky planets and the rocky cores of gas giant planets. A standard scenario begins with the collisional growth of submicron-sized dust particles to dust aggregates. They grow further by mutual sticking, gradually settle to the midplane of the disk, and finally form a dense dust layer. The formation of planetesimals in itself remains an open issue whether the gravitational instability of the thin layer or the direct growth of the aggregates occurs.
Observationally, some evidence of dust size growth has been proposed based on dust continuum emission from protoplanetary disks, such as power-law indices in spectral energy distribution and a feature of 10 μm silicate emission (e.g., Beckwith & Sargent 1991; Miyake & Nakagawa 1993, 1995; Beckwith et al. 2000; Kitamura et al. 2002; van Boekel et al. 2003; Lommen et al. 2010; Ricci et al. 2010; Sicilia-Aguilar et al. 2011; Furlan et al. 2011). Dust evolution in which micron-sized interstellar dust particles grow into centimeter-sized particles with settling toward the midplane of the disk has been studied theoretically both in a quiescent state (Weidenschilling 1980; Nakagawa et al. 1981, 1986) and in a local turbulence induced by the shear between dust and gas layers near the midplane (Cuzzi et al. 1993; Weidenschilling 1997, 2004).
In addition to the shear-induced turbulence, there exists global turbulent motion of the gas in protoplanetary disks, which is caused mainly by magnetorotational instability (MRI; e.g., Balbus & Hawley 1991). The global motion of turbulent gas can affect the dust evolution processes extensively: relative motion induced by turbulence increases the mutual collision rate, i.e., the growth rate of dust particles (e.g., Völk et al 1980); turbulent mixing motion lets particles move diffusively (e.g., Cuzzi et al. 1993); and turbulent eddies trap dust particles (e.g., Klahr & Henning 1997; Cuzzi et al. 2001; Johansen et al. 2004). On the other hand, the disk instability induced by MRI depends on the spatial and size distribution of dust particles (e.g., Mizuno et al. 1988; Sano et al. 2000; Nomura 2004). Therefore, unified investigation of the evolution of dust particles and the turbulent motion (disk instability) is needed to understand the very beginning of the planet formation in the disk where dust particles settle toward the midplane and form a dust layer.
Magnetic field is expected to play a major role in the self-consistent evolution of dust particles and disk turbulence at this stage. Coupling of the gas with magnetic field that depends mainly on sorts of charged particles and their relative densities is the most important factor in determining which parts of the disk become magnetorotationally unstable. Many authors have examined whether protoplanetary disks can be ionized enough to sustain MHD turbulence (e.g., Gammie 1996; Sano et al. 2000; Ilgner & Nelson 2006a, 2006b, 2006c; Wardle 2007). One of the important findings is that MRI in protoplanetary disks is strongly controlled by the concentration of dust material since surface areas of dust particles provide important places for sticking and reaction (especially recombination) of various chemical (ionized) species in gas phase. Thus, the settling and size growth of dust particles affect extensively the disk instability, and vice versa.
Charge state of dust particles directly affects the collisional growth of dust particles in protoplanetary disks. Okuzumi (2009) pointed out that electrostatic repulsion between dust aggregates becomes strong enough to prevent the mutual collisions, and consequently the negative charging of dust particles in a weakly ionized disk could significantly slow down the coalescence process. Furthermore, Okuzumi et al. (2011a, 2011b) investigated how the charging affects the evolution of the size distribution and found out a location where the charging stops dust growth at the fractal growth stage where the settling of dust particles remains of little importance.
In addition, the chemistry of protoplanetary disks is strongly related to the ionization process and the charge states of gas and dust particles. The chemical evolution in the disk has been investigated extensively by using highly sophisticated models of the chemical reaction network (e.g., Finocchi & Gail 1997; Ilgner & Nelson 2006a; Bergin et al. 2007; Walsh et al. 2012). Although the model of chemical evolution was constrained by the chemical record gathered from meteorites, planetary atmospheres, and cometary comae, large questions such as the origin of cometary ices and the organic contents of gas/solid reservoirs that produced life remain regarding the chemical evolution of gas and dust particles in protoplanetary disks.
In the part of protoplanetary disks where the temperature is below several hundred kelvin and thermal ionization is inefficient, the gas is mainly ionized by non-thermal particles such as cosmic rays, X-rays, and UV radiation from central stellar objects (e.g., Matsumura & Pudritz 2003; Bergin et al. 2007). As the depth χ (in column density) from the surface of the disk increases, the flux of these particles decreases extensively. A very thin layer with the characteristic depth smaller than 10−1 g cm−2 is adequate to attenuate UV photons (Perez-Becker & Chiang 2011). X-ray observations of star-forming regions revealed a surprisingly strong X-ray activity of young stellar objects (YSOs). Based on the observations (ROSAT, Einstein, and ASCA) of soft X-ray emission from YSOs, Igea & Glassgold (1999) investigated the ionization rate by low-energy X-rays (<20 keV) in the inner region (≲ 5 AU) of the disk and found that X-rays penetrate and ionize the gas at the depth from the surface up to ∼10 g cm−2. Recently, the Chandra and XMM-Newton observations show that hard X-ray emission up to ∼8–10 keV is common in disk-bearing YSOs (e.g., Preibisch et al. 2005). Furthermore, superhot flares from pre-main-sequence stars observed in the Chandra Orion Ultradeep Project are definitely hotter than 100 MK, with derived peak temperature above 200 MK (Getman et al. 2008). Although we need detailed calculations of hard X-ray penetration in the disk, the ionization by X-rays can be efficient in the upper zone with χ ≲ 100 g cm−2 (e.g., Ilgner & Nelson 2006c). The ionization rate by highly energetic (cosmic-ray) particles including the effects of secondary particles such as electrons and γ-rays decreases exponentially with the characteristic (attenuation) length λCR ≈ 96 g cm−2 (Umebayashi & Nakano 1981). At depth χ larger than some critical value, matter is ionized primarily by the activity of radionuclides contained in the disk. As shown by Umebayashi & Nakano (1981), both the long-lived radionuclides, which have half-lives t1/2 much longer than 108 yr and survive in many objects of the present solar system, and the short-lived ones, which have t1/2 ≪ 108 yr and are already extinct in the objects of the present solar system but alive to some extent in the primitive solar nebula and in the other dense objects, contribute the ionization of matter. Actually, there is evidence in meteorites that short-lived nuclides existed in the formation stage of the Sun and the solar system about 4.6 billion years ago (e.g., Wadhwa et al. 2007).
Many γ-ray spectroscopy instruments have also detected γ-ray emission in a narrow line at 1809 keV from the equatorial plane of the Galaxy (Mahoney et al. 1984; Harris et al. 1990, 1997; Plüschke et al. 2001; Smith 2004; Diehl et al. 2006). This line is interpreted as resulting from the decay of 26Al in the present interstellar medium (ISM), whose mass ratio 26Al/27Al is about six times smaller than the ratio estimated by the analysis of meteoritic material (Wadhwa et al. 2007). Detection of the 60Fe decay γ-ray line from the inner Galaxy was also reported (Wang et al. 2007). These short-lived radionuclides must be generated continuously by nucleosynthesis in the Galaxy and exist universally in the ISM from which stars and exoplanetary systems are formed.
The ionization rate by the decay of radionuclides was also investigated by many authors (Cameron 1962; Nakano & Tademaru 1972; Umebayashi & Nakano 1981; Stepinski 1992; Finocchi & Gail 1997). Umebayashi & Nakano (2009, hereafter UN09) have reinvestigated comprehensively the ionization rates both by long- and short-lived nuclides whose relative abundance has been measured in some meteorites and/or by γ-ray astronomy. Because most of these radionuclides can be naturally condensed in dust material, the ionization rate by radionuclides is greatly affected by the change in size and spatial distribution of dust particles. Thus, UN09 pointed out that the growth and settling of dust particles, which are believed to be important processes leading to planet formation in the disk, affect the ionization rate by radionuclides. Inversely, the ionization rate is one of the essential factors for the ionization state in the disk, and it can affect the coupling of the gas with magnetic field and the charge state of dust particles. A unified approach to the physical and chemical evolution of the disk is needed to understand the early stage of the planet formation that could lead to planetesimal formation.
We investigate in this series of papers the fundamental process that the ionization rate by radionuclides is affected by the change in size and spatial distribution of dust particles. The size of dust particles must increase significantly by coalescence through mutual collisions, and the spatial distribution of dust particles must change considerably by settling toward the midplane of the disk. Because it is difficult to solve the dynamics of the disk simultaneously, we calculate the change of the ionization rate by radionuclides in various models of protoplanetary disks.
In this paper, we investigate the elementary processes about the settling and size growth of dust particles and the energy loss of energetic particles emitted by radionuclides and apply them to the disk models similar to the solar nebula in a quiescent state. Because we want to clarify the mechanism for changing the ionization rate, we simply assume in numerical calculations represented in this paper that a coalescence model deals with perfect sticking of the compact sphere. In Section 2, we summarize the model of protoplanetary disks and the motion of dust particles and formulate the settling and size growth (coalescence) equation of dust particles generally. In Section 3, we investigate the elementary loss processes of available energy emitted by the decay of radionuclides, i.e., energy loss in the solid material of dust particles and absorption (shielding) of emitted energies by other dust particles located nearby. Using the coalescence equation for settling dust particles obtained in Section 2, we numerically simulate the evolution of the dust size distribution, calculate the change of the ionization rates by radionuclides at representative orbits of various disk models, and find the maximum ionization rates around the midplane in Section 4. Discussion of some related problems, such as adequacy for the coalescence model of dust particles, contribution of minor radionuclides, and effects of internal structure of dust aggregates, occurs in Section 5. In Appendices A and B, we summarize the mean free path in a gas mixture and calculate the traveling path length of the emitted particle in the dust particle, the results of which are essential to the elementary processes. The ionization rate by radionuclides under a turbulent motion of the disk and/or various models of non-compact dust aggregates will be investigated in the forthcoming paper (T. Umebayashi et al., in preparation, hereafter referred to as Paper II).
2. MODELS AND BASIC EQUATIONS
2.1. Disk Model
There seems to be no really acceptable model of protoplanetary disks in the evolutionary stage of dust settling and size growth. In view of such a situation, we adopt a simplified model used previously in order to investigate the effects of the dust evolution on the ionization rate by radionuclides. As the gas surface density Σ and the gas and dust temperature T of the disk we assume a power-law distribution given by
where R is the radial distance in the conventional cylindrical coordinate system (R, ϕ, z) anchored at the central star and p and q are arbitrary positive parameters (e.g., Cassen 1994). We adopt this temperature distribution even for the opaque region near the midplane because it may be regarded as being in a thermal bath of this temperature. Hayashi (1981) proposed a model with Σ0 = ΣH = 1700 g cm−2, T0 = 280(L⋆/1 L☉)1/4 K, p = 1/2, and q = 3/2 for the minimum mass solar nebula (MMSN; e.g., Safronov 1969; Hayashi et al. 1985), where L⋆ is the luminosity of the central star. In the following, we primarily investigate the evolution of the ionization rate in the models with q = 3/2 and  , where fΣ (≳ 1) is an arbitrary parameter. Indeed, Zhu et al. (2010) suggested that at least the inner part (dead zone) of the solar nebula can be more massive than the MMSN.
The surface density of dust particles is
where Σdust0 depends on the temperature of the dust particles at distance R. For the MMSN we have Σdust0 ≈ 7.1 and 30 g cm−2 for R ≲ 2.7 and ≳ 2.7 AU, respectively, taking into account the effect of water ice sublimation (Hayashi 1981). Note that Σdust0 is also proportional to fΣ and the border radius between different Σdust0 depends on T0 and p. The sound velocity is given by
where μ is the mean molecular weight of the gas and k and mH are the Boltzmann constant and the mass of atomic hydrogen, respectively.
In a gravitationally stable disk, the gravity perpendicular to the disk is mainly contributed by the central star. The balance of the stellar gravity and the pressure force in the vertical direction determines the density at height z from the midplane as
where
is the scale height of the disk and
is the Keplerian angular velocity, with M⋆ and G being the mass of the central star and the gravitational constant, respectively. The density at the midplane (z = 0) is given by
The disk is gravitationally stable as long as Toomre's (1964) Q = csΩ/πGΣ > 1. In our case stable disks must fulfill a condition
For the disk with q = 3/2 and fΣ ≲ 10 this condition is satisfied in the part R ≲ 100 AU, which is far beyond the outermost region of planet formation.
2.2. Equations of Motion for Gas and Dust Particles
The equations of motion for gas and dust particles in the disk are given by
where u, U, ρgas, and ρdust are the velocities (in the inertial frame of reference) and the mass densities of gas and dust particles, respectively, r = (R, ϕ, z) is the position vector in the cylindrical coordinate system anchored at the central star, and Pgas is the gas pressure. Following Epstein's law or Stokes' law, the coefficient of the drag force A is given by
where a and ρs are the radius and the inner solid density of dust particles, respectively, and  and lgas are the thermal speed and the mean free path of gas particles, respectively. Around the disk midplane, we have
where  is the average cross section for mutual collisions of gas particles. For the neutral gas composed of hydrogen molecules (H2) and helium (He) atoms with solar abundance, we have
  on average (for further details, see Appendix A) and obtain lgas = 1.3 cm in Earth's region of the MMSN. In this paper, we simply assume that the shape of dust particles is a compact sphere. We note that the area-to-mass ratio, which strongly affects the drag force coefficient and the sticking rate of dust aggregates, depends on their shape (the fractal structure of dust aggregates; see also Section 5).
Furthermore, we assume that the disk is axisymmetric and rotates around the central star nearly with circular Keplerian velocity vK = RΩK(R)eϕ, where eϕ is a unit vector in the azimuthal (ϕ) direction. We use the gas and dust velocities relative to the Keplerian velocity  and
and  . Because the time for dust particles to approach the equilibrium velocity owing to the gas drag force is much smaller than the Keplerian time and the mutual collision time of dust particles as long as the dust radii are small enough (e.g., Nakagawa et al. 1981), the mean motion of dust particles becomes steady soon. By setting ∂/∂t = 0 in Equations (10) and (11), we obtain (for details, see Nakagawa et al. 1986) the terminal velocities in the radial (R) and the vertical (z) directions as
and
where ρ = ρgas + ρdust, Dgas = Aρgas, D = Aρ, and
is half the ratio of the pressure force to the stellar gravity in the R-direction around the disk midplane (z ≈ 0).
2.3. Coalescence Equation for Settling Dust Particles
We solve the settling and size growth (coalescence) equation of dust particles to investigate the effects of dust evolution on the ionization rate by radionuclides. Letting n(m, z)dm be the number density of dust particles with mass between m and m+dm at the height z from the disk midplane, the size growth of settling dust particles is represented by the equation
where the rate coefficient of the dust particle of mass m and radius a colliding to attach with one of m' and a' is given by

ps and δV being the probability for sticking together and the relative velocity for mutual collision of dust particles (Nakagawa et al. 1981). We note that ps depends on size, relative velocity of collision, chemical composition, and/or the shape of dust particles (e.g., Weidenschilling & Cuzzi 1993; Weidenschilling 2004; see also references therein). Owing to the lower values of δV, we simply neglect in Equation (17) the fragmentation of dust particles in the course of mutual collisions, which could occur if the dust particles become large and their velocities relative to small particles become high enough (e.g., Dullemond & Dominik 2005).
The second term on the left-hand side of Equation (17) shows the transport of dust particles in the vertical direction. Because the mean vertical velocity of the gas is negligibly small (vz ≈ 0) in a quiescent state of the disk, the dust particles of mass m and radius a settle toward the midplane with the mean velocity
We completely neglect the transport of dust particles in the radial direction since we are mainly interested in the evolutionary stage that a mass fraction of gas in a certain position is larger than that of dust particles where the dust particles scarcely move in the radial direction (Nakagawa et al. 1986).
Numerically, we solve the following discrete equation of coalescence:
where
is the integrated mass density of dust particles whose mass ranges from mi − 1/2 to mi + 1/2 in the position of z = zl,  is the average rate coefficient of the dust particle of mass mj = (mj − 1/2 + mj + 1/2)/2 colliding to attach with one of mk, and γijk is the factor between 0 and 1 that represents the branching ratio that the dust particle of mass mi is formed through the collision between particles of mj and mk. This factor is induced because the integrated form of mass density φ(i, zl) is used to calculate Equation (17) numerically (Nakagawa et al. 1981; Nakagawa & Kohno 1999; Nomura & Nakagawa 2006). The total mass density of dust particles at a given position zl can be obtained from
The transport term in Equation (20) is calculated by using the spatial grids in the z-direction indexed by discrete number (integer) l.
For the relative collision velocity between dust particles, δV, we take into account the thermal Brownian motion
the velocity differences in the R- and z-directions δVR = VR(j) − VR(k) and δVz = Vz(j) − Vz(k), and the turbulence-induced relative velocity δVt, which can be neglected in a quiescent disk. We neglect the velocity difference in the ϕ-direction δVϕ because the azimuthal velocity Vϕ of dust particles considered in this paper hardly depends on their radius a (e.g., Nakagawa et al. 1986). We adopt the square root of the sum of the squares of these velocity differences as relative collision velocity:

3. ENERGY LOSS AND SHIELDING OF THE EMITTED ENERGETIC PARTICLES
3.1. General Remarks on the Ionization by Radionuclides
As for the long-lived radionuclides, UN09 shows that the dominant nuclide for the ionization of matter is 40K and that 232Th (Th series), 235U (Ac series), and 238U (U series) contribute about 20% of the total ionization rate by the long-lived nuclides. Among the short-lived radionuclides, UN09 reveals that 26Al is the dominant ionization source overwhelming the ionization by the long-lived nuclides and that the ionization rates by 60Fe and 36Cl are more efficient than those by the long-lived nuclides. Cosmochemically, elements Al, Th, and U are refractory, Fe is a siderophile element whose condensation temperature for iron–nickel mixtures is about 1700 K, and K (potassium) is a volatile element that condenses at a temperature between 600 K and 1300 K. The only (major radioactive) element that is so highly volatile that its condensation temperature is below 600 K is Cl. Because the ionization by radionuclides becomes important only in the region of the protoplanetary disk with T ≲ 600 K, where the thermal ionization is inefficient (Umebayashi 1983), we can regard that most of these radionuclides are substances of the solid material in dust particles. In the course of investigating the effects of dust settling and size growth on the ionization by radionuclides, we can safely consider that 40K and 26Al are the primary sources of the long- and short-lived nuclides for ionization.
The average energy released in the decay series starting at parent nuclide X and used for ionization per unit time per unit hydrogen nucleus is given by

where  , w(X) = ln 2/t1/2(X), and x(X) are the energy actually used for ionization, the decay rate constant, and the abundance relative to hydrogen nucleus by number, respectively. The energy deposited into the medium is eventually used for ionization and electric excitation of the surrounding gas that is mainly composed of H2 molecules and He atoms. The ionization rate of an H2 molecule by the decay of X is then given by
where  is the average energy required for energetic particles to produce an ion–electron pair passing through molecular hydrogen gas and x(H2) = 0.5 and x(He) are the relative abundance of H2 molecules and that of He atoms by number (see UN09 for details). Because the ionization rate of an He atom can be obtained through the equation
  (see UN09), we deal only with ζH2R(X) in the following (hereafter we simply write it as ζ(X) without confusion).
The size growth of settling dust particles affects the ionization by radionuclides through the following three processes: (1) the change of the relative abundance of radionuclides x(X) due to the movement (mainly settling toward the disk midplane) of dust particles, (2) the energy loss of the emitted particles along the traveling path in the solid material of dust particles before they emerge from the surface of dust particles (hereafter we simply call it energy loss), and (3) the absorption (shielding) of the emitted energetic particles by other dust particles located nearby (hereafter shielding). In the following subsection, we investigate the processes of energy loss and shielding in detail.
3.2. Energy Loss in the Solid Material of Dust Particles
In the ordinary environment of the protoplanetary disks we can safely regard that all the radionuclides considered in UN09 are found in the dust particles, as mentioned above. The decay of the parent radionuclide X and subsequent processes emit α-particles, electrons, positrons, and/or photons, and the (kinetic) energies of these emitted particles are at most several MeV. The ranges λ of emitted α-particle, electron (positron), and photon with energy ∼1 MeV are about 0.001, 0.5, and 20 g cm−2, respectively, in the solid material of dust particles, and these ranges decrease steeply as their energies decrease (Berger 1993; Hubbell & Seltzer 1996). In case the mass thickness χdust of the dust particle becomes close to or over the range λ of emitted energetic particles, these particles must lose a certain amount of their (kinetic) energies before they emerge from the surface of dust particle and ionize the gas. Thus, we investigate the energy loss of emitted particles along the traveling path in the solid material and obtain the residual energy available to ionize the gas  for each emitted particle j.
Charged particles and photons emitted with energies less than several MeV lose their energies mainly through the ionization of surrounding matter and the Compton effects. Since the energy-loss rates of these processes are approximately taken to be constant around the energy region considered in this paper, the residual energy  can depend mainly on the mass thickness χdust along the traveling path of the emitted particle in the solid material of the dust particle. For the sake of simplicity, we calculate the average thickness 〈χdust〉 for the dust particle of mass m (radius a), which contains a parent nuclide X based on the following assumptions: (1) All the dust particles have the shape of a compact sphere, and their inner solid density ρs is constant. (2) The parent radionuclide X is uniformly distributed throughout the solid material of the dust particle (see also Section 5). (3) The direction of emitted energetic particle j is isotropic in solid angle around the decay place of X as a reference point. (4) The traveling path of the emitted particle j is straight, and the change in its direction due to the collisions with atomic electrons on the way can be neglected. The last assumption is not accurate enough, especially for Compton scattering of photons. However, we rest upon this assumption because emitted photons scatter at most a few times even in the largest dust particles considered in this paper.
We calculate the average traveling path length 〈s〉 of the emitted energetic particle in the solid material under these assumptions: we first average the path length over the emitted direction to obtain  at a fixed place of particle emission; then the length
  is averaged over the distribution of the emitted place, which corresponds to the decay position of nuclide X (for further details, see Appendix B). The resultant length for the dust particle of radius a is 〈s〉 = (3/4)a. Since the average mass thickness is simply related to this length as 〈χdust〉 = ρs〈s〉, we have 〈χdust〉 ≈ (81ρs2m/256π)1/3 for the dust particle of mass m.
The available energies (per particle)  and the branching ratios R(j) of various energetic particles j with their types y(j) emitted due to the decay of parent nuclides 26Al and 40K are summarized in Table 1. We estimate the average energy loss in the solid material using the thickness 〈χdust〉. In the case of electron and positron (y(j) = e− and e+) the residual kinetic energy
  to ionize the gas on the surface of the dust particle can be obtained by integrating the mean rate of energy loss (or stopping power) over 〈χdust〉. The stopping power is essentially given by the Bethe–Bloch equation, which for the atomic component (absorber) i at the low-energy region (β ≲ 1) approximately has the form
where NA, re, and me are Avogadro's number, classical electron radius, and electron mass, respectively, Zi, Ai, and Ii are atomic number, atomic mass, and mean excitation energy of component i, respectively, and Tmax is the maximum kinetic energy that can be imparted to a free electron in a single collision. Stopping powers and the resultant ranges of electrons obtained from Equation (27) agree well with those calculated with a more sophisticated computer program ESTAR (Berger 1993). Concerning the chemical compositions of the dust particle, we use the fractions by weight f(i) summarized in Table 2. Consequently, the total energy-loss rate in the solid material is given by (− dE/dχ)dust = ∑if(i)(− dE/dχ)i.
Table 1. The Average (Kinetic) Energies (Per Particle)  and the Branching Ratios R(j) of the Particles j with Their Types y(j) Emitted by the Decay of Parent Nuclides X
| Nuclide | Half-life | Abundance | Decay Mode | Type | Energy | Branching |
|---|---|---|---|---|---|---|
| X | t1/2(X) (yr) | x(X) | y(j) |  (keV) (keV) |
Ratio R(j) | |
| 26Al | 7.4 × 10⁵ | (1.8–2.5) × 10−10a | β+ (82%) | e+ | 473 | 0.82 |
| γ | 1808b | 0.82 | ||||
| 2γ | 512c | 0.82 | ||||
| EC (18%) | γ | 2938b | 0.0027 | |||
| γ | 1808b | 0.1773 | ||||
| γ | 1130b | 0.0247 | ||||
| 40K | 1.28 × 10⁹ | 2.2 × 10⁻¹⁰ | β− (89.3%) | e− | 534 | 0.893 |
| EC (10.7%) | γ | 1461d | 0.107 |
Notes. aThe relative abundance 26Al/27Al is taken to be (5–7) × 10−5. bThe energy of a photon emitted from the excitation state of 26Mg. cThe energy of two photons produced by positron annihilation. dThe energy of a photon emitted from the excitation state of 40Ar.
Download table as: ASCIITypeset image
Table 2. Fractions by Weight f(i) for Atomic Components i in Dust Particles
| Element | Chemical | Abundancea | Fraction | Solar |
|---|---|---|---|---|
| i | Substances | Ndust(i) | f(i) | Abundanceb |
| Si | SiO2 | 1.00 × 10⁶ | 0.167 | 1.000 × 10⁶ |
| Mg | MgO | 1.02 × 10⁶ | 0.147 | 1.020 × 10⁶ |
| Fe | FeO, FeS | 8.38 × 10⁵ | 0.277 | 8.380 × 10⁵ |
| S | FeS | 4.45 × 10⁵ | 0.0848 | 4.449 × 10⁵ |
| O | SiO2, MgO, FeOc | 3.41 × 10⁶d | 0.324 | 1.413 × 10⁷ |
Notes. aThe relative abundance by number based on the assumption that each element (except O) is completely included in solid material of dust particles. bThe relative abundance by number (Lodders 2003). cAll Fe atoms other than those included in FeS are in the form of FeO. dAn amount of O in solid material is estimated on the assumption that dust particles consist mainly of the chemical substances in this table.
Download table as: ASCIITypeset image
As for the photons (y(j) = γ) emitted from the excited states of the daughter nuclides, the residual energy  to ionize the gas on the surface of the dust particle is simply related to the emitted photon energy
  as
as
where λdust(E) is the effective energy-absorption length of the photon emitted with energy E. The length λdust(E) in the solid material can be described as
where f(i) and (μen/ρ)i are the fraction by weight in the solid material and the mass energy-absorption coefficients (in units of g−1 cm2) for atomic component i, respectively. In calculating  from Equations (28) and (29), we also use f(i) summarized in Table 2 and the National Institute of Standards and Technology (NIST) data of X-ray mass attenuation coefficients as the coefficients (μen/ρ)i (Hubbell & Seltzer 1996). The NIST data of attenuation coefficients take into account not only the secondary photon radiation produced at the initial photon–atomic interaction site but also the quanta of radiation from the annihilation of positrons originating in the initial pair production. These coefficients further involve the emission of radiation produced by the secondary charged particles traveling through the medium.
In the case of two photons emitted by the positron annihilation (y(j) = 2 γ) we must carefully estimate the residual energy (per positron)  of two respective photons (here we can denote j = 2 γ without confusion) available to ionize the gas on the surface of the dust particle. Because the rate coefficient of positron annihilation is much smaller than that of atomic electron scattering or ionization (see Equation (27)), it is reasonable to assume that the pair annihilation occurs when a positron comes to rest, i.e., its kinetic energy becomes zero. As long as the residual kinetic energy available to ionize the gas
  is greater than zero, such a positron can leave the dust particle and the energy of photons emitted due to a subsequent pair annihilation in the gas phase is exactly given by
  . In case the kinetic energy
  becomes zero on the way to the surface of the dust particle, a positron annihilation occurs on the inside of the dust particle and the emitted photons lose a certain amount of energy while they go through the solid material of this particle. We simply calculate the traveling path lengths of emitted photons under the following assumptions: (1) A pair annihilation occurs at the position where its distance rpa from the center of the dust particle is equal to the range 〈χdust(e+)〉/ρs (=〈s(e+)〉) of the positron. (2) The directions of emitted photons are isotropic in solid angle around the spot of positron annihilation. (3) Two photons transit each other in the exactly opposite senses. With the average path lengths
  of two emitted photons in the dust particle (for further details, see Appendix B), the residual energy per pair annihilation available to ionize the gas is given by
where  (
( ) and
) and  (
( ) represent the mass thicknesses for the long and short traveling path lengths of emitted photons in the solid material, respectively, and
  is obtained by Equation (29) with
  .
.
We calculate numerically the residual energies available to ionize the gas  for various emitted particles j as functions of the dust radius a (or the corresponding mass m). The total residual energy for the decay of X is given by
  , where R(j) is the branching ratio of emitted particle j due to the decay of radionuclide X.
The results with the inner solid density ρs = 2 g cm−3 for the decays of nuclides X = 26Al and 40K are shown in Figures 1 and 2, respectively. The energies  of various emitted particles j are also represented by dashed and dot-dashed lines in these figures.
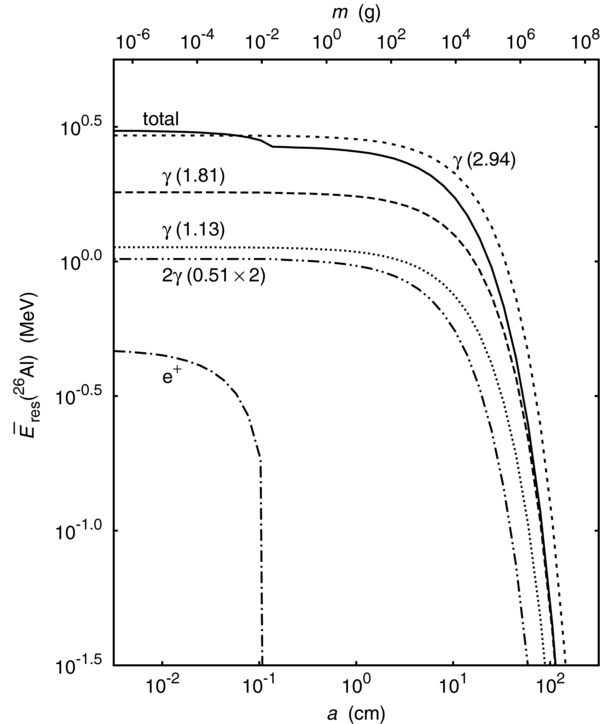
Figure 1. Residual energies available to ionize the gas for various energetic particles emitted by the decay of short-lived radionuclide 26Al as functions of the radius a (or the corresponding mass m) of the dust particle. The radius a and the mass m are shown by the abscissa in the lower part and by one in the upper part of the panel, respectively. The total residual energy  , or the sum of the residual energies multiplied by their branching ratio R(j), is shown by the solid line. The residual energies
  for photons (y(j) = γ), positron (e+), and two photons (2 γ) emitted simultaneously due to the positron annihilation are shown by dashed lines, dot-dashed line, and double-dot-dashed line, respectively. Each photon is marked by its emitted energy (in MeV) in parentheses. We have assumed that the dust particle has the shape of a compact sphere with the inner solid density ρs = 2 g cm−3.
Download figure:
Standard image High-resolution image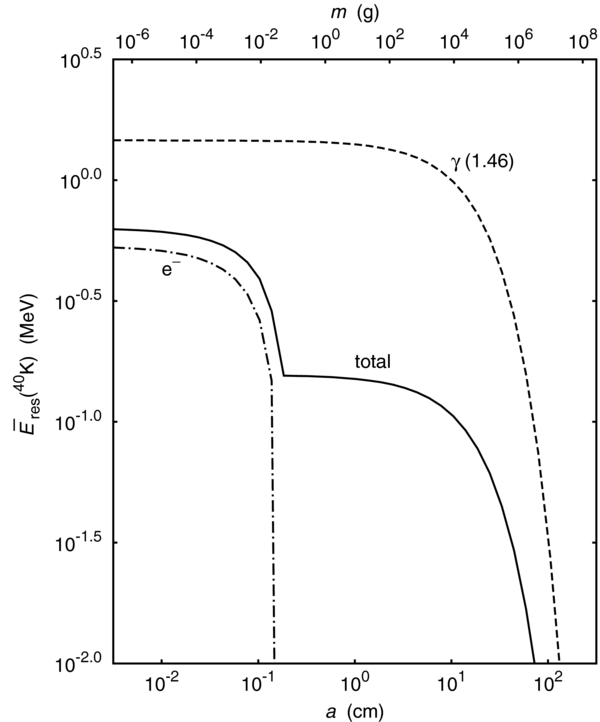
Figure 2. Residual energies available to ionize the gas for energetic particles emitted by the decay of long-lived radionuclide 40K. The total residual energy  and the residual energies
  for photon (y(j) = γ) and electron (e−) are shown by the solid line, dashed line, and dot-dashed line, respectively. The others are the same as in Figure 1.
Download figure:
Standard image High-resolution imageThe results for 26Al and 40K resemble well each other because the types of emitted energetic particles are positron and photons, and electron and photon, respectively. As long as the radius of dust particle a is smaller than about 1 × 10⁻² cm, the kinetic energy losses of electron and positron due to the ionization of solid material are completely inefficient. Above this radius, which corresponds to the mass thickness 〈χdust〉 ≳ a few × 10−2 g cm−2, the energy loss of electron (positron) becomes efficient and the emitted electron (positron) stops within the dust particle of a ≳ 10−1cm, or 〈χdust〉 ≳ (2–3) × 10−1 g cm−2. As for 40K, the total residual energy  decreases abruptly above this radius because most of the energy available to ionize the gas is carried by the emitted electron.
The absorption of photons emitted from the excited states of daughter nuclides and that of two photons emitted due to the positron annihilation become efficient only at a ≳ 10 cm, or 〈χdust〉 ≳ (2 – 3) × 10 g cm−2, because the effective energy-absorption length of a photon with E ≳ 1 MeV is greater than 20 g cm−2 for the chemical compositions of the dust particle. Thus, the total residual energies  for both nuclides remain constant values as long as a ≲ 10 cm. The residual energies become abruptly close to zero for dust particles of a ≳ several × 10 cm, or 〈χdust〉 ≳ 102 g cm−2, since the emitted energy of photons is at most 3 MeV. In conclusion, the size growth of the dust particle affects the total residual energy
  moderately as long as a ≲ 10 cm.
3.3. Shielding by Other Dust Particles
When the settling of dust particles proceeds extensively, the mass density of dust particles ρdust around the midplane becomes close to or exceeds that of gas ρgas (see Section 4). In such a situation, the energetic particles such as α-particles, electrons, positrons, and photons that have emerged from the surface of a certain dust particle collide with other dust particles located nearby and lose considerable amounts of the (kinetic) energies before they ionize the gas particles sited in the same place.
Because the column density of the disk where this effect becomes efficient is much larger than the ranges of the energetic particles, we can regard that these particles deposit their energies at the same place where they leave from the surfaces of dust particles. The part of the deposit energy used for ionizing the gas depends on the densities and the energy-loss rates of the gas and dust particles at that site.
Charged particles with energies less than a few MeV lose their kinetic energies primarily through the ionization and atomic excitation. We can see from Equation (27) that the mean energy-loss rate is essentially proportional to the ratio Zi/Ai of absorber i and that the variation of loss rate due to the atomic property of the absorber can be insignificant because the rate depends on the logarithm of its excitation energy Ii. As for photons with energies less than a few MeV the primary energy-loss process is incoherent scattering (Compton scattering off an electron). The atomic photoelectric effect, which is characterized by discontinuities due to thresholds for photoionization of various atomic levels, becomes predominant in the lower energy region of E ≲ 100 keV. Photon attenuation length for E ≳ 100 keV depends slightly on the atomic property of absorber i. Thus, we can safely regard that the mass attenuation coefficient of the emitted photon is proportional to the number of electrons Zi in the atom (absorber). The effective mass attenuation coefficient is approximately given by the sum of the coefficients that are proportional to the ratio Zi/Ai weighted with respect to the fraction by weight f(i) for atomic component i in the chemical compound.
In such a situation the portion of the (kinetic) energy used for ionizing the gas particles sited in a certain place is given by
where αgas and αdust are the energy-absorption probabilities by gas and dust particles in this place, which are approximately proportional to products of the partial mass densities and the average ratios Zi/Ai of these particles. Absorbers consist mainly of elements H and He for gas particles and of heavy elements summarized in Table 2 for dust particles. We can easily calculate the average ratios and use (Zi/Ai)gas = 0.86 and (Zi/Ai)dust = 0.49 in the following calculations.
4. RESULTS
We solve numerically the discrete equation for size growth (coalescence) of settling dust particles (Equation (20)) at a typical orbit (R = constant) of the disk and obtain the dust size distribution and the change of the gas ionization rates by the decay of radionuclides as functions of time t and the height z from the midplane. As for the physical conditions and/or the evolutionary stages of the protoplanetary disk, we consider primarily a quiescent disk model (evolutionary stage) in this paper. The effects of the (global) turbulence on the ionization rates by radionuclides will be investigated in Paper II.
Energetic particles emitted by the decay of both long-lived radionuclide 40K and short-lived one 26Al can penetrate the neutral gas (composed of H2 molecules and He atoms) of thickness χR (∼10 g cm−2; see also Section 3). Thus, we only consider the inner region where the surface density Σ(R) exceeds about 100 g cm−2 and the emitted particles deposit their energies into the medium located in the same place as the parent nuclides. Moreover, the ionization by radionuclides becomes significant only in the zone where the ionization rate by cosmic rays decreases to a certain extent (Umebayashi & Nakano 1981), and the X-ray ionization from the central star must be unimportant. The ionization by low-energy X-rays becomes efficient only at the surface layer whose column density is below ∼10 g cm−2 (Igea & Glassgold 1999). Because hard X-ray emission from YSOs (e.g., Preibisch et al. 2005; Getman et al. 2008) can penetrate and ionize the gas above this column density, the ionization by radionuclides can be efficient only in the inner region with surface density ≫10 g cm−2. In the MMSN, the region inside Jupiter's orbit (R = 5.2 AU) satisfies this condition.
Furthermore, we restrict ourselves to investigating the ionization rate by radionuclides in the zone from the midplane to the scale height H(R) within which most of the gas and dust particles for a given R exist. Outside this zone the emitted particles can escape freely from the disk to the surrounding interstellar space without ionizing the gas of the disk.
UN09 calculated the ionization rates by the long- and short-lived nuclides based on the following assumptions, which were not mentioned explicitly: (1) The dust particles that contain these nuclides are mixed so well with the gas that relative abundance of dust particles to gas remains unchanged everywhere in the disk. (2) The size of dust particles is small enough for emitted energetic particles to move freely from the solid material of dust particle to the surrounding space, and consequently the loss of the available energies to ionize the gas is negligible. We perform numerical calculations of the dust evolution under the initial conditions similar to these assumptions: dust particles are initially mixed well with the gas and their abundance relative to gas is homogeneous throughout the vertical zones below z = H(R). As for the initial dust radius we use the same initial value ainit = 10−4 cm, independent of the orbital radius R and the factor  . The same initial radius for various regions of the disks is different from those used by Nakagawa et al. (1986) and by Nomura & Nakagawa (2006) simply because we clarify the evolutionary changes of the ionization rates at different orbits under the same conditions about the initial model and abundance of dust particles. These conditions affect little the following results obtained numerically. Moreover, we simply assume the sticking probability of mutual dust collisions ps = 1, which affects primarily the evolutionary timescale of dust particles.
In the numerical calculations the spatial grid in the vertical direction is taken to be equally spaced into 20 intervals within 0 ⩽ z ⩽ H(R), which is the same as that used by Nomura & Nakagawa (2006). On the other hand, we do not take additional logarithmically spaced subintervals within the lowest interval 0 ⩽ z ⩽ H(R)/20 because we need not resolve the dust evolution near the midplane of the disk in further details. The dust mass is binned into n intervals logarithmically as mi + 1/2 =  mi − 1/2 with n = 160 and = 21/2, unlike Nomura & Nakagawa (2006), who adopted n = 320 and = 21/4. This change causes no essential difference in the dust evolution as described below.
We can safely regard that the emitted particles deposit most of their energies in such an interval that the decay of radionuclides has occurred. The matter thickness of a spatial interval in the vertical direction is about 4 g cm−2 at the orbit R = 5 AU of the MMSN. This thickness is a few times smaller than the range of energetic particles χR. Because the particles emitted isotropically from the decay place of the parent nuclides, half of the emitted particles run inward. The matter thickness of the spatial intervals in the radial and azimuthal directions is considered to be close to the surface density for a given R. Moreover, some of emitted particles in the innermost interval go through the midplane and deposit their energies in its counterpart on the opposite side. Thus, the matter thickness of an interval penetrated by the energetic particles is generally much larger than that in the vertical direction. A notable exception is the outermost interval where the emitted particles can escape upward from the disk. Although the disk matter does not end abruptly around the position z ≈ H(R), the ionization rate in this part of the disk with Σ(R) ≈ 100 g cm−2 is treated as an upper limit to the actual values.
The motion and distribution of dust particles are characterized by typical heights Zk (k = 1, ..., 4) from the midplane (Nakagawa et al. 1986; Nomura & Nakagawa 2006). The spatial grid in the numerical calculations can resolve clearly the zone z ≳ Z1 = 2ηR where dust particles move mainly in the vertical direction (Vz ≫ VR). Thus, we can simply assume the velocity difference in the R-direction δVR = 0 in calculating the relative collision velocity of dust particles δV from Equation (24). Because the position Z1 is close to the upper boundary of the innermost zone H(R)/20, the radial velocity VR is not absolutely small. However, this assumption is not worse for calculating the size distribution around the midplane of the disk in a quiescent state, since the velocity difference δVR is found to be so small that it affects little the relative velocity δV.
In the zone  , the gas density ρgas is always larger than the dust density ρdust. The radial velocity of dust particles in this zone reaches its maximum value VR ≈ ηvK (see Equation (14)) when the dust radius becomes above a critical value acr. Setting the friction time between gas and dust particles τf ≈ 1/Dgas equal to the characteristic time of the radial migration τmig ≈ 1/ΩK(R), the critical radius of dust particles is roughly given by
In the inner region of the disk acr is generally given by the latter formula, i.e., dust particles can migrate efficiently after they grow larger than the mean free path of gas particles (a ≳ lgas). Because dust particles with a ≳ acr migrate inward very rapidly with the timescale R/VR ≈ tK/(2πη), we artificially remove from the numerical calculations the dust particles whose radius reaches above acr.
Although the dust fluid whose velocity is an average over a mass of dust particles does not oscillate around the midplane, Equation (11) shows that each individual dust particle begins to oscillate if Dgas = Aρgas becomes smaller than 2ΩK(R) (Nakagawa et al. 1986). Setting the friction time τf ≈ 1/Dgas equal to the characteristic time of the oscillation τosc ≈ 1/2ΩK(R), the critical radius for oscillations aosc is roughly given by either acr/2 for aosc ≲ lgas or  for aosc ≳ lgas. In a quiescent disk, however, dust particles always settle toward the midplane in the mean motion (Nomura & Nakagawa 2006). The oscillation of a large particle that satisfies a > aosc is a fluctuation of motion that is dampened with a timescale of 2τf, while a smaller particle (a < aosc) settles without oscillation. Thus, we neglect the oscillation of large dust particles around the midplane of the disk in numerical calculations.
4.1. A Fiducial Model: The Minimum Mass Solar Nebula
First, we investigate the evolution of dust particles and its effects on the ionization rates by radionuclides in the MMSN at a quiescent stage:  , q = 3/2, and p = 1/2. Because the innermost orbital radius R of the solar nebula is about 0.35 AU (Hayashi 1981) where the temperature becomes close to 500 K but the thermal ionization remains inefficient (Umebayashi 1983), we investigate the dust evolution and its effects on the ionization rates in the region of 0.35 AU ≲ R ≲ 5 AU.
4.1.1. Dust Size Distribution
Figures 3, 4, and 5 show the numerical results for the size distribution of the mass density of dust particles normalized by the total mass density at its initial stage (t = 0), φ(a, z)/ρdust, for R = 1, 0.5, and 5 AU, respectively. In these figures, we represent the size distribution as a function of the dust radius a (or the corresponding dust mass m) instead of the numerical bin numbered by i (see Equation (20)) and the normalized height from the midplane z/H(R). Panels (a)–(d) of Figure 3 show the results at four characteristic stages of the dust evolution: (1) the early stage that the size growth of dust particles proceeds at their initial places, and the settling occurs little in most of the vertical zones (t = 3.2 × 10² yr); (2) the stage that both the settling and the size growth proceed extensively (t = 1 × 10³ yr); (3) the stage that most of the dust particles settle in the zone z ≲ Z1, where the radial migration of dust particles becomes efficient (t = 3.2 × 10³ yr); (4) the later stage that the dust layer can already be gravitationally unstable to fragment into planetesimals if the disk continues to be in a quiescent state (t = 1 × 10⁴ yr). In Figures 4 and 5, the size distributions at typical times corresponding to stages (2) and (3) are shown in panels (a) and (b), respectively.

Figure 3. Size distribution of mass density of dust particles φ(a, z), as a function of dust radius a (or the corresponding mass m), normalized by the total mass density of dust particles in the initial stage ρdust at the orbit R = 1 AU in a quiescent state of the minimum mass solar nebula (MMSN). The solid, dashed, and dot-dashed lines in each panel represent the size distribution at the typical height z from the midplane normalized by its scale height H(R) (=0.047 AU). Panels correspond to the characteristic evolutionary stages in the settling and size growth of dust particles: (a) t = 3 × 10² yr (the early stage that the size growth proceeds but the settling scarcely occurs); (b) 1 × 10³ yr (the stage that the settling and size growth proceed extensively); (c) 3 × 10³ yr (the stage that most of the dust particles settle inside the region z ≲ Z1); (d) 1 × 10⁴ yr (the later stage that the dust layer can be gravitationally unstable if the disk remains quiescent).
Download figure:
Standard image High-resolution image
Figure 4. Size distribution of mass density of dust particles φ(a, z)/ρdust at the orbit R = 0.5 AU in a quiescent state of the MMSN. Panels correspond to the following evolutionary stages of dust particles: (a) t = 3 × 10² yr (the stage that the settling and size growth proceed extensively); (b) 1 × 10³ yr (the stage that most of the dust particles settle inside the region z ≲ Z1). The others are the same as in Figure 3.
Download figure:
Standard image High-resolution image
Figure 5. Size distribution of mass density of dust particles φ(a, z)/ρdust at the orbit R = 5 AU in a quiescent state of the MMSN. Panels correspond to the following evolutionary stages of dust particles: (a) t = 3 × 10³ yr (the stage that the settling and size growth proceed extensively); (b) 1 × 10⁴ yr (the stage that most of the dust particles settle inside the region z ≲ Z1). The others are the same as in Figure 3.
Download figure:
Standard image High-resolution imageAt stage (1) the size growth of dust particles occurs faster in the zones of larger z/H(R) and the settling from their initial location remains inefficient, as can be seen from Figure 3(a). Because the terminal velocity of dust particles in the vertical direction Vz is proportional to the height z from the midplane (see Equation (15)), the relative collision velocity δV of dust particles in the upper part becomes larger than that in the lower part. Larger dust particles that have grown around the surface layer of the disk settle more rapidly toward the midplane and grow further in size. This tendency leads to bimodal size distribution in the zone close to the midplane at the later stages (2)–(4) (see, e.g., Weidenschilling 1997; Nomura & Nakagawa 2006). Above the innermost zone, on the other hand, single-peaked and almost flat distribution is achieved owing to this fast settling of larger dust particles toward the midplane. At stages (3) and (4), the local minimum between the peaks of bimodal distribution around the midplane becomes shallower and amounts of floating dust particles in the residual zones continue to decrease due to the settling of smaller particles as time goes by.
The numerical results for R = 1 and 5 AU agree well with those obtained by Nomura & Nakagawa (2006). Because we use the interpolation formula for the coefficient A of the gas drag force (see Equation (12)) in numerical calculations, no gaps in size distribution appear around a ≈ lgas where A begins to follow Stokes' law, rather than Epstein's law. We note that the initial radius of dust particles ainit = 10−4 cm affects only the early evolutionary stages where the size growth of dust particles in their initial positions is efficient. Thus, the times to reach stages (2)–(4) for R = 5 AU become a few thousand years later than those obtained by Nomura & Nakagawa (2006).
We find the critical dust radii acr = 21, 32, and 97 cm at the orbits of R = 0.5, 1, and 5 AU, respectively. Because dust particles with a ≳ acr migrate inward very rapidly with the timescales R/VR ≈ 44, 88, and 4.4 × 10² yr for R = 0.5, 1, and 5 AU (e.g., Adachi et al. 1976), we artificially remove the dust particles whose radii reach above acr from the numerical calculations. Some dust particles exceed the critical values, but total mass fractions Σdustrm(R)/Σdust(R) of the removed particles (a > acr) are negligible even at the later stages (see Table 3). Thus, the removal of larger dust particles affects little the numerical results of the size distribution and the ionization rates by radionuclides.
Table 3. The Maximum Ratios ζmax(X)/ζinit(X) of the Ionization Rates by the Decay of Radionuclides X around the Midplane at the Orbits R of the Protoplanetary Disks with the Surface Density Factor 
| R | (AU) | 0.5 | 1 | 5 | 10 | 30 |
|---|---|---|---|---|---|---|
 |
240 | 85 | 7.6 | 2.7 | 0.52 | |
 |
(g cm−2) | 20 | 7.1 | 2.7 | 0.95 | 0.18 |
 |
(cm) | 1.3 | 0.44 | 0.34 | 0.12 | 0.023 |
(a)  |
(MMSN) | |||||
| Σdustrm(R)/Σdust(R) | 0.031 | 2 × 10⁻⁸ | 2 × 10⁻¹⁷ | |||
 |
0.66 | 0.73 | 0.81 | |||
 |
0.23 | 0.26 | 0.32 | |||
| pgas | 0.64 | 0.83 | 0.93 | |||
| ζmax(26Al)/ζinit(26Al) | 100 | 51 | 14a | |||
| ζmax(40K)/ζinit(40K) | 36 | 19 | 5.4a | |||
| ζlim/ζinit | 150 | 70 | 19a | |||
(b)  |
||||||
| Σdustrm(R)/Σdust(R) | 0.34 | 0.012 | 0.037 | 4 × 10⁻¹⁸ | ||
 |
0.42 | 0.60 | 0.58 | 0.81 | ||
 |
0.16 | 0.21 | 0.22 | 0.32 | ||
| pgas | 0.47 | 0.63 | 0.82 | 0.92 | ||
| ζmax(26Al)/ζinit(26Al) | 140 | 95 | 11 | 13a | ||
| ζmax(40K)/ζinit(40K) | 53 | 34 | 4.1 | 5.3a | ||
| ζlim/ζinit | 220 | 160 | 18 | 18a | ||
(c)  |
||||||
| Σdustrm(R)/Σdust(R) | 0.63 | 0.28 | 0.32 | 0.028 | 8 × 10⁻²⁴ | |
 |
0.23 | 0.38 | 0.30 | 0.53 | 0.84 | |
 |
0.10 | 0.15 | 0.13 | 0.21 | 0.35 | |
| pgas | 0.32 | 0.41 | 0.66 | 0.79 | 0.95 | |
| ζmax(26Al)/ζinit(26Al) | 180 | 130 | 15 | 11 | 14a | |
| ζmax(40K)/ζinit(40K) | 79 | 51 | 6.5 | 4.4 | 5.8a | |
| ζlim/ζinit | 280 | 250 | 34 | 20 | 19a |
Note. aThe ratio in the innermost zone 0 ⩽ z ⩽ H(R)/20 obtained from the numerical calculation.
Download table as: ASCIITypeset image
It should also be noted that shear motion between the dust layer and the gas induces a local turbulence near the midplane as the settling of dust particles proceeds extensively (see, e.g., Cuzzi et al. 1993; Weidenschilling & Cuzzi 1993; Weidenschilling 1997). A quiescent state cannot maintain its ideal situation of non-turbulence. Computing the Richardson number, Nomura & Nakagawa (2006) found that the shear instability occurs in the zone z ≲ Z2 at each orbit. Dust particles do not concentrate in the midplane and migrate inward very rapidly once they grow large enough, a ≳ acr.
4.1.2. Ionization Rates
Using the size distribution of dust particles described above, we calculate the evolution of the ionization rates by the decay of either short-lived nuclide 26Al or long-lived one 40K. The ionization rates at some typical evolutionary stages normalized by their initial values ζ(X)/ζinit(X) at the orbits R = 1, 0.5, and 5 AU are shown in Figures 6, 7, and 8, respectively, as functions of the relative height z/H(R) from the midplane of the disk. Panels (a) and (b) of Figure 6 show the rates by the decay of nuclides X = 26Al and 40K. We only represent the results of 26Al at R = 0.5 (Figure 7) and 5 AU (Figure 8). As can be seen from these figures, the characteristics of the evolution of the rates at different orbits R resemble each other. Thus, we can easily estimate from these figures how the ratios ζ(40K)/ζinit(40K) at R = 0.5 and 5 AU change gradually.

Figure 6. Time evolution of the ionization rate by the decay of radionuclides ζ(X) normalized by its initial rate ζinit(X) as a function of the relative height z/H(R) from the midplane at the orbit R = 1 AU in a quiescent state of the MMSN. Panels (a) and (b) show the rate by the decay of short-lived nuclide X = 26Al and one by long-lived nuclide 40K, respectively. The solid, dashed, and dot-dashed lines in each panel represent the ratios of the ionization rates at the characteristic stages (see Figure 3) of dust evolution.
Download figure:
Standard image High-resolution imageAt the early stage (1) that the size growth of dust particles proceeds at their initial places, the ionization rate remains unchanged except for the uppermost zone where the settling is most efficient. The size growth of dust particles scarcely affects the ionization rate because most of the dust particles are still so small that the energetic particles emitted due to the decay of radionuclides can freely penetrate the solid material of dust particles and the loss of their (kinetic) energies is negligible (see Figures 1 and 2). As the settling proceeds, the rate in the innermost zone increases considerably, that in the intermediate zone continues to be a constant value close to its initial rate, and at the outer zone near the scale height H(R) the ratio decreases noticeably. At the later stage that most of the dust particles have settled in the innermost zone, the ratio ζ(X)/ζinit(X) in this zone reaches a large value and remains unchanged afterward. The ratio at the outer zone, however, keeps on decreasing in proportion to the amount of the floating dust particles as time goes by.
The energy available to ionize the gas Eav(X), which is given by the residual energy  averaged over the size distribution φ(a, z) at the height z, is essential to calculate the ratio ζ(X)/ζinit(X). Both the energy loss due to the size growth of dust particles and the amount of particles removed from the calculation decrease the value of Eav(X), although the latter affects little the results in the present situation (MMSN). As for the ionization rate by the decay of 26Al, the size growth of dust particles decreases the energy Eav(26Al) only by a factor of about 0.7 in the innermost zone (see also Table 3). This can be easily understood from Figure 1 that the radii of the most abundant dust particles in Figures 3, 4, and 5 are still smaller than the radius at which the energy loss of emitted energetic particles becomes efficient. Because most of the dust material is settled into the innermost zones of thickness Δz ≈ H(R)/20, the rates ζ(26Al) in these zones are about 14 times greater than their initial values.
The size growth of dust particles can be efficient to decrease the ionization rate by the decay of 40K. Thus, the rate ζ(40K) in the innermost zone for R = 1 AU at the later stage becomes only several (≈5) times larger than its initial value. We can see from Figure 2 that the energy available to ionize the gas  decreases to about 1/3 times the total emitted energy for dust particles with a ≳ 0.1 cm. The residual energy that is carried by photons is almost constant up to a ≈ 10 cm. Since this value is larger than the radius of the most abundant particles at the later stage, the ratio ζ(40K)/ζinit(40K) in the innermost zone remains unchanged. The ratios in the outer zones, on the other hand, change in a similar way to those for 26Al as the settling proceeds. Because most of the dust particles floating in these zones are smaller than 10−2 cm as can be seen from panels (c) and (d) of Figure 3, the energy loss in the solid material is inefficient. Thus, the ratios ζ(X)/ζinit(X) that are proportional to the amount of dust particles take the same value for both nuclides X = 26Al and 40K (Figures 6(a) and (b)). Similar results are obtained in the case of R = 0.5 and 5 AU, and the ratios by the decay of 40K in the innermost zones are about 4.5 and 5.4, respectively. The difference in the ratios is partly due to the inner solid density ρs of dust particles.
The concentration of dust particles in the innermost zones and the resultant absorption (shielding) of emitted energetic particles by other dust particles located nearby are ineffective in decreasing the ionization rates. Because the relative abundance ρdust/ρgas becomes at most 0.08 for R ≲ 2.7 AU and 0.35 for R ≳ 2.7 AU, the shielding decreases the large ratios shown in Figures 6, 7, and 8 only by 5%, 5%, and 20%, respectively (see Equation (31)).
As for the outer orbit R = 5 AU, the surface density within H(R)/20 is about 4 g cm−2, which is already smaller than the stopping range of the emitted particles χR. Simply the rates in Figure 8 decrease by a factor of about 2.5, i.e., the ratio of the range of energy deposition to the surface thickness. However, this factor must decrease and approach close to one because the energetic particles are emitted isotropically from the decay place of the parent nuclides, as mentioned earlier. This indicates that the ratios ζ(26Al)/ζinit(26Al) shown in Figure 8 are close to the precise values both in the innermost zone and in the outer zones. The ratio can be overestimated only in the outermost zone z ≈ H(R). Moreover, the results of the ionization rates by 40K are much the same.

Figure 7. Time evolution of the ionization rate by short-lived nuclides ζ(26Al)/ζinit(26Al) at the orbit R = 0.5 AU in a quiescent state of the MMSN. The others are the same as in Figure 6.
Download figure:
Standard image High-resolution image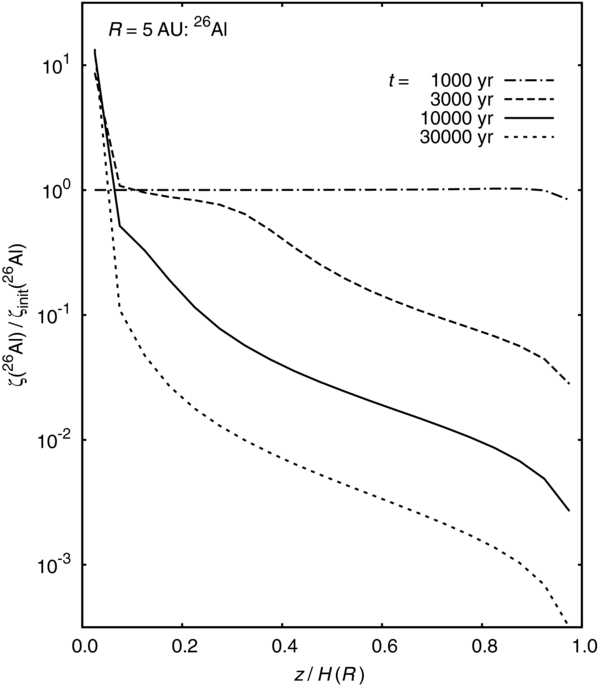
Figure 8. Time evolution of the ionization rate by short-lived nuclides ζ(26Al)/ζinit(26Al) at the orbit R = 5 AU in a quiescent state of the MMSN. The others are the same as in Figure 6.
Download figure:
Standard image High-resolution image4.2. Disks with Various Surface Densities
We investigate quiescent disk models with various surface densities rotating around a star of M⋆ = 1 M☉. First, we consider the model of different surface density factor  and the other parameters are the same as those of the MMSN. Panels (a) and (b) of Figure 9 show the numerical results of the ratios ζ(26Al)/ζinit(26Al) for
  at the orbits R = 1 and 30 AU, respectively. It should be noted that the disk of
  is gravitationally stable in the orbital region R ≲ 100 AU (see Equation (9)) and that the effect of dust evolution on the ionization rates by radionuclides becomes significant in the region of Σ(R) ≳ 100 g cm−2.
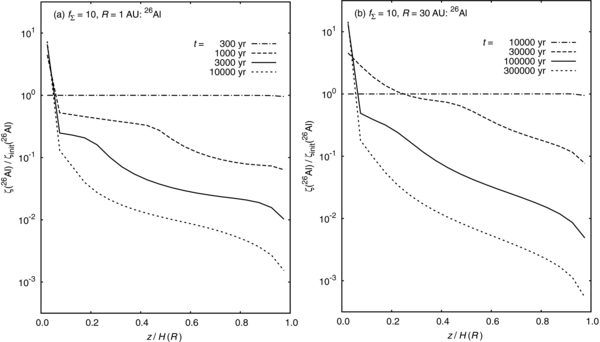
Figure 9. Time evolution of the ionization rate by short-lived nuclides ζ(26Al)/ζinit(26Al) in a quiescent state of the protoplanetary disk with the surface density factor  . The other parameters of the disk model are the same as those for the MMSN. Panels (a) and (b) show the rates at the orbits R = 1 and 30 AU, respectively. The others are the same as in Figure 6.
Download figure:
Standard image High-resolution image
Characteristics of the results are broadly similar to those in the MMSN. (1) A significant increase of the ionization rate occurs only in the innermost zone around the midplane. (2) In the intermediate zones and the outer zones, the ionization by radionuclides becomes completely inefficient as the settling of dust particles proceeds.
The ratio ζ(26Al)/ζinit(26Al) for R = 1 AU in the numerical calculation reaches up to 7.4, which is about half of the ratio in the innermost zone of the MMSN. Because there exists sufficient dust material in the disk of large  , many dust particles grow large and some exceed the critical radius acr. Note that acr is independent of
  as long as acr ≳ lgas (see Equation (32)). Consequently, about 30% of dust material is removed from the calculation. The energy loss of emitted particles in the solid material also increases as the fraction of large dust particles increases and the relative energy available to ionize the gas
  decreases to about 4.
Similar results are obtained in the inner orbital region R ≲ 13 AU of the disk with  . The condition acr ≳ lgas is satisfied in this region, and acr increases moderately as R increases. The ratios ζ(26Al)/ζinit(26Al) in the innermost zones become about 4.6, 5.3, and 8.9 for R = 0.5, 5, and 10 AU, respectively. These values depend mainly on the energies available to ionize the gas Eav(26Al), which are affected by total mass fraction of the removed dust particles Σdustrm(R)/Σdust(R) and/or by the energy loss in the solid material. For R = 0.5 and 5 AU considerable amounts (∼60% and 30%) of dust material are removed from the calculations, and as a result Eav(26Al) decreases significantly. At R ≈ 10 AU, on the other hand, a fraction of removed dust material becomes small (≈3%). Because dust particles can grow close to the critical radius acr ≈ 190 cm (>lgas), the energy loss in the solid material becomes the major process and Eav(26Al) decreases by about 50%. As for the case of long-lived nuclide 40K, situations are similar and the ratios in the innermost zones decrease to about 2.0, 2.9, 2.3, and 3.5 for R = 0.5, 1, 5, and 10 AU, respectively. The shielding by other particles decreases the ratios of both nuclides by about 2%, 3%, 12%, and 16% at the same orbits R. The reduction of the factor pgas in the inner region R ≲ 5 AU is owing to a large amount of removed dust material.
At the orbit R = 30 AU where the surface density Σ(R) is close to 100 g cm−2, we find numerically the large ratios ζ(X)/ζinit(X) ≈ 14 and 5.8 for X = 26Al and 40K around the midplane (see Figure 9(b)). Because the dust particles scarcely grow above the critical value acr = 66 cm (<lgas), a fraction of removed dust particles Σdustrm(R)/Σdust(R) is negligible (∼8 × 10⁻²⁴) and the available energy Eav(X) decreases moderately. This situation resembles that in the inner orbital region (R ≲ 1 AU) of the MMSN. Since the surface density within H(R)/20 is about 2.5 g cm−2, the real ratios ζ(X)/ζinit(X) can decrease at most by a factor of four. However, for the same reason as mentioned earlier, both ratios are close to their precise values.
In the outer orbital region R ≳ 13 AU where acr becomes smaller than lgas, the critical radius acr, which is proportional to  (or the gas density ρgas), decreases as R increases. Because the amount of dust material in this region is insufficient to make massive dust particles (a ≳ acr), characteristics of the results closely resemble those in the inner orbital region of the MMSN. As R increases, a fraction of removed dust material becomes insignificant. The energy available to ionize the gas Eav(X) increases as the radius of the most abundant dust particles decreases gradually. Thus, the ratios ζ(X)/ζinit(X) approach the values of about 14 and 6 for X = 26Al and 40K obtained in the outermost region R = 30 AU.
We also investigate the disk model of  numerically and find much the same characteristics of results. Quantitatively, the ratios for 26Al in the innermost zones are found to be about 8.2, 11, 9.6, and 13 for R = 0.5, 1, 5, and 10 AU, respectively, and those for 40K are 3.1, 4.1, 3.7, and 5.3 at the same orbits. Because the amount of dust material in the disk is proportional to
  , a small portion of dust particles can grow large enough to exceed the critical radius acr in this model. Thus, a fraction Σdustrm(R)/Σdust(R) becomes smaller and Eav(X) increases, compared with the disk for
  at the same orbit. These situations adequately change both ratios to the intermediate values.
The ratios ζ(X)/ζinit(X) in the intermediate zones and the outer zones at a given R are almost independent of the surface density of the disk model, i.e.,  and R. Because the ratios are directly proportional to the amounts of dust particles in these zones at the later stages, this tendency becomes obvious as time goes by.
Furthermore, we investigate the disk models with different power index q of the surface density and find that characteristics of results are similar among all the disk models. The surface density Σ(R) at a given R is essential for an increase in the ratio ζ(X)/ζinit(X) around the midplane. As long as Σ(R) is close to that in the MMSN, a fraction of removed dust material is small and the settling of dust particles increases the ionization rates by 26Al and 40K extensively. The largest ratios are about 14 and 5, almost independent of the radial distance R. In the region that Σ(R) is large enough to make massive dust particles with a ≳ acr, the increase in the ratio is moderate because the reduction of dust material due to the radial migration toward the central star becomes significant. The condition that acr ≳ lgas is satisfied or not affects little the results summarized above.
4.3. The Maximum Ionization Rates around the Disk Midplane
The large ionization rates by radionuclides in the innermost zones obtained numerically are restricted to the thickness of interval Δz ≈ H(R)/20 used in the calculations. In order to estimate the maximum ratios ζmax(X)/ζinit(X) in the thin gaseous layer around the midplane, we must consider additional settling of dust particles toward the midplane.
The minimum thickness of the gaseous layer into which the energetic particles emitted due to the decay of nuclide X can deposit their (kinetic) energies is given by χR. This thickness corresponds to the layer of the height ZR ≈ [2χR/Σ(R)] H(R) from the midplane. As long as  , the boundary ZR is not far away from the typical height Z2, and is located between Z1 and Z2 for a given R in most of the disk models considered in the previous subsections. It should be noted that both heights Z1 and Z2 are independent of
  . As the settling in the innermost zone proceeds further, most of the dust material is concentrated in the thin layer of thickness Δz (≳ ZR). The amount of dust material in this layer at the later stage is at most H(R)/Δz times larger than its initial value. Even if dust particles settle further into a very thin region close to the midplane (Δz ≪ ZR), energetic particles emitted from such a region deposit their energies into the gaseous layer of the matter thickness χR.
Nomura & Nakagawa (2006) calculated additional settling and size growth of dust particles at R = 1 and 5.2 AU in a quiescent disk (MMSN) numerically. Their results show that in the inner part where most of the dust particles are concentrated the size distribution of dust particles has essentially a similar form and the radius of the most abundant particles remains unchanged. This part becomes thinner as the settling toward the midplane proceeds further. Features of the size distribution in the innermost zone obtained from our calculations resemble their results. Only a minor difference is the radius of the most abundant dust particles. Because dust particles can grow up to the critical radius acr in our calculations, the radius of the most abundant particles is several times larger than that obtained by Nomura & Nakagawa (2006).
We use a fraction of energy available to ionize the gas  obtained numerically in the innermost zone for estimating the maximum ratios ζmax(X)/ζinit(X) in the thin gaseous layer. Both the energy loss of emitted energetic particles and the reduction of dust material due to the radial migration of massive dust particles (a ≳ acr) have effects on Eav(X). Since additional settling changes little the size distribution of the dust particles in the inner layer where most of the dust material is concentrated, the fraction of dust particles removed in the course of further settling is small. The radius of the most abundant particles is at most comparable to the length above which the energy loss in the solid material becomes abruptly effective, and the energy loss in smaller dust particles is roughly constant (see Figures 1 and 2). Thus, we can safely consider that further settling affects little the energy loss of emitted particles and that a fraction
  in the thin layer is approximately given by that found in the numerical calculations.
As dust particles settle further toward the midplane, the abundance ratio ρdust/ρgas increases gradually and the shielding by other particles located nearby becomes efficient. Because most of the dust particles remaining in the numerical calculations can be settled into the thin gaseous layer of thickness Δz, the maximum ratio of ρdust/ρgas is virtually given by [Σdust(R) − Σdustrm(R)]/2χR. The portion of the (kinetic) energy to ionize the gas pgas is obtained from Equation (31) with this ρdust/ρgas. Consequently, the maximum ratio of the ionization rate by the decay of X around the midplane is given by
where we take Δz = ZR in the last expression.
Using  and Σdustrm(R)/Σdust(R) obtained numerically, we calculate the maximum ratios ζmax(X)/ζinit(X) by the decay of nuclides X = 26Al and 40K. The results with Δz = ZR for the disk models of
  , 3, and 10 are summarized in Table 3. In the outermost orbital region Σ(R) ≲ 200 g cm−2 the surface density of interval Δz ≈ H(R)/20 becomes smaller than the stopping range of the emitted particles χR. Because the increase of the ionization rates around the midplane due to the additional settling of dust particles scarcely occurs in this region, we represent the results of the numerical calculations in the columns of the outermost orbit R for a given
  , which are close to the maximum ionization rates, as mentioned earlier.
In the case of (a)  (MMSN) the maximum ratios ζmax(26Al)/ζinit(26Al) reach up to about 100 and 50 at the orbits R = 0.5 and 1 AU, respectively. The surface thickness χR corresponds to the layers of heights ZR ≈ H(R)/240 and H(R)/85. Because fractions of removed dust particles Σdustrm(R)/Σdust(R) are minor (≲ 0.03), dust material in these layers increases extensively. Both the energy loss due to the size growth of dust particles and the shielding by other particles become efficient in this situation. Thus, the maximum ratios increase moderately, compared with large amounts of dust material in the thin layers. The resultant ionization rates ζmax(26Al) are close to or larger than the ionization rate by energetic particles (cosmic rays) in the ISM (ζCR ≈ (3–10) × 10−17 s−1; van der Tak & van Dishoeck 2000; van der Tak et al. 2006), where the damping of the flux is negligible.
As for the ionization by 40K, the characteristics are similar, but the maximum ratios ζmax(40K)/ζinit(40K) decrease by a factor of about 2.7 in comparison to 26Al. The resultant rates ζmax(40K) exceed the ionization rates by cosmic rays around the midplane of the orbital region R ≲ 2 AU, where the attenuation of the cosmic-ray flux becomes efficient.
Compared to the results in the MMSN, the maximum ratios ζmax(X)/ζinit(X) for the disk models of (b)  and (c) 10 increase only by a factor of about 1.4–1.9 and 1.8–2.7, respectively, at the orbit R ≲ 1 AU. Because many dust particles can grow massive in the disks of large
  , considerable amounts (30%–60%) of dust material are removed due to the rapid migration toward the central star. Thus, fractions of energy available to ionize the gas
  decrease significantly. The residual amounts of dust material in the thin layers, however, are sufficient to decrease the portion of energy to ionize gas, pgas ≲ 0.6.
In the intermediate orbital regions 1 AU ≲ R ≲ 2.7 AU, the characteristics of maximum ratios ζmax(X)/ζinit(X) are similar to those in R ≲ 1 AU for all the disk models. As R increases, both the available energy  and the factor pgas increase, and a fraction Σdustrm(R)/Σdust(R) becomes minor even for the disk of
  . Thus, the maximum ratios ζmax(X)/ζinit(X) decrease and approach gradually the values proportional to the relative amount of dust material in the thin layer Σ(R)/2χR.
The relative abundance and the inner solid density ρs of dust particles change suddenly at the orbit R ≈ 2.7 AU where the temperature is below ∼180 K and the water vapor begins to condense into ice. Hence, the maximum ratio ζmax(X)/ζinit(X) decreases abruptly by a factor of 2–3. In the outer orbital region R ≳ 2.7 AU, ζmax(X)/ζinit(X) decreases slightly and approaches constant values 11 and 4 for X = 26Al and 40K, respectively. Because the minimum heights of the thin layer ZR are  and
and  for R = 5 and 10 AU, the concentration of dust material in the thin layers and fractions Σdustrm(R)/Σdust(R) (≲ 0.04) become of little importance. As R increases further, the radius of the most abundant dust particles and the energy loss in the solid material decrease gradually. Thus, the ratios ζmax(X)/ζinit(X) increase to about 14 and 6 in the outermost region for a given
  .
.
As the additional settling toward the midplane proceeds, the relative abundance of dust material in the outer part z ≲ Δz (≈ ZR) decreases considerably. The ratio ζ(X)/ζinit(X) in this part begins to decrease and comes closer to the typical value outside the innermost zone obtained numerically (see Figures 6, 7, and 9(a)). This tendency is independent of the radial distance R and the disk models  and q. Similar to the intermediate zone and the outermost zone near the disk scale height, the ionization by radionuclides in this part becomes completely inefficient as the settling of dust particles proceeds.
5. DISCUSSION
In numerical calculations, we implicitly include the radial motion of dust particles by allowing the growth of particles above the critical radius acr. If dust particles cannot move in the R-direction completely, the maximum radius of dust particles is given by the total amount of dust material in the z-direction for a given R, as = psΣdust(R)/8ρs (Safronov 1969; see Table 3 for definite values). A similar kind of dust radius is obtained from the criteria for the coalescence of dust particles in a possible physical situation of the disk (Ohtsuki et al. 1990; Nakagawa & Kohno 1999): the collision and growth of particular dust particles whose number in the narrow area (≈103 cm2) for a certain vertical interval becomes less than one are prohibited in calculating Equation (20) numerically. However, there exists the fluctuating motion of dust particles beyond this limited area because the movement of particles in the R-direction is not so small even in the zone of z ≳ Z1. This allows further growth of such scarce particles, with the result that the dust radius reaches up to acr in our calculations. The required distance in the movement of particle growth is still negligibly small, compared with the radial migration of particles during the sedimentation (Nakagawa et al. 1986).
Most of the other short- and long-lived radionuclides such as 36Cl, 60Fe, and decay series of Th, Ac, and U (232Th, 235U, and 238U), which are mainly contained in the solid material of dust particles, also contribute the ionization of the gas. As for the short-lived nuclide 36Cl the available energy ∼270 keV is mainly emitted in the form of the kinetic energy of the electron by β− decay. In the decay of 60Fe two photons with energies around 1.3 MeV and electrons with kinetic energies ∼60–400 keV are emitted. The energies of these photons are somewhat smaller than the one emitted in the decay of 40K, whose residual energy  is shown in Figure 2. Because the stopping ranges of electrons with these energies are less than ∼0.2 g cm−2, they can scarcely penetrate the dust particles of a ≳ 0.1 cm. Thus, the residual energy
  changes in a similar way, and the settling of dust particles increases the ratio ζ(60Fe)/ζinit(60Fe) by almost the same factor as that of 26Al. Its contribution, however, is minor since the initial ionization rate ζinit(60Fe) is at least 10 times smaller than ζinit(26Al) (UN09).
The long-lived nuclides Th, Ac, and U series, on the other hand, mainly emit α-particles and electrons in the course of sequential decays toward the stable nuclides (208Pb, 207Pb, and 206Pb). The kinetic energies of α-particles are roughly several MeV, and their stopping ranges are ∼0.01 g cm−2 or less. The energies of electrons are at most a few MeV, and the electron with the average energy (≲ 1 MeV) has a range around 0.5 g cm−2. Because these ranges are smaller than the mass thickness of the most abundant dust particles in the thin layer around midplane, an increase in the ratios for these series is insignificant, compared with the ratio ζ(40K)/ζinit(40K) obtained in Section 4.
In the outer region of the disk (R ≳ 2.7 AU) most of the dust particles have the icy mantel and their inner solid density decreases to about 1 g cm−3 on average. In calculating the ratio ζ(X)/ζinit(X) in this region, we simply use ρs = 1 g cm−3 and do not consider the detailed structure of dust particles. Because the radionuclides mentioned above are overwhelmingly contained within the core of the dust particle, these nuclides are not distributed homogeneously in the solid material of the dust particle. However, we can safely regard that the parent nuclides are uniformly distributed throughout the solid material because the energy loss of the emitted particles becomes important after an extensive number of dust particles are aggregated together. Furthermore, the mean energy-loss rates are essentially proportional to the ratio Zi/Ai of absorber i and the atomic properties of the absorber affect slightly the loss rates (see Section 3). Both icy materials (mantles) and minerals (cores) of dust particles have almost the same value of Zi/Ai. Thus, we can use with sufficient accuracy the residual energies  for ρs = 1 g cm−3, which resemble the results shown in Figures 1 and 2.
It should also be noted that the decay of radionuclides in the dust particles affects little the sublimation of icy material in dust particles. For a spherical dust particle with radius a, specific heat C, and thermal conductivity κ, the diffusion time of heat and the maximum rise in temperature are approximately given by td = ρsCa2/κ and ΔT(X) = Q0(X)a2/6κ, respectively, where Q0(X) is the energy per unit volume and time emitted by the decay of nuclide X. In the case of icy dust aggregates for a ≈ acr around R = 5 AU of the MMSN most of the emitted energies are deposited in the solid material, and we obtain td ≈ 6 × 10⁵ s and ΔT(26Al) ≈ 2 × 10⁻⁵ K if the abundance ratio is taken to be the canonical value 26Al/27Al ≈ 5 × 10⁻⁵ (UN09). Thus, we can safely neglect the effect of the emitted energies on an increase in the dust temperature. The decay of radionuclides becomes an essential heat source when the radius exceeds ∼7 × 106 cm, which corresponds to planetesimal rather than dust aggregate.
Following most of the previous studies on the settling and size growth of dust particles in the protoplanetary disks, we neglect the internal structure of dust aggregates and assume compact aggregates with a constant density. At the early stage of dust growth, however, dust particles collide mutually with a significantly low velocity (≲ 1 mm s−1), and the resultant aggregates can simply stick without any restructuring and form clusters of ballistic cluster–cluster aggregation (BCCA). Dominik & Tielens (1997) investigated the property of such dust aggregations in the mutual collisions by performing two-dimensional numerical simulations of aggregate collisions. Wada et al. (2007, 2008) and Suyama et al. (2008) performed more extensively two- and three-dimensional numerical simulations of the collisions of BCCA clusters to clarify the property of the resultant aggregates.
The important results obtained in these investigations are that the dust aggregates can retain their porous structure after the sticking growth and that the fractal dimension of the aggregates is two or less for BCCA clusters. Even if the aggregates collide continuously, the aggregates compressed have the inner density of about 10−4 g cm−3. Because the mass thickness of such dust aggregates decreases at least by a factor of 500, the energetic particles emitted by the decay of radionuclides can escape freely from the aggregates and ionize the surrounding gas. Such situations must change the ionization rate significantly, and both nuclides 26Al and 40K have the similar ratio ζ/ζinit because the energy loss of the emitted particles in the solid material becomes negligible. In the case of extremely low ρs, the critical radius of the dust particle for radial migration always satisfies the condition acr ≳ lgas, and its value is given by the latter expression of Equation (32), acr ≈ [3cthρgaslgas/2ρsΩK(R)]1/2. Thus, the critical mass and radius of aggregates increase by a factor of ∼102 for ρs ≈ 10−4 g cm−3. Because as is inversely proportional to ρs, dust aggregates can grow larger than acr and a fraction of removed dust material Σdustrm(R)/Σdust(R) becomes significant. Consequently, the limit of the ratio of the ionization rates in the thin layer is given by
where we also take Δz = ZR in the last expression.
Since this situation is analogous to that investigated in Section 4.3, we use Σdustrm(R)/Σdust(R) obtained numerically and calculate the limits of the ratios ζlim/ζinit. The results with Δz = ZR for the disk models of  , 3, and 10 are also represented in Table 3.
The limits of the ratios become at most twice as large as ζmax(26Al)/ζinit(26Al). They do not take extreme values even in the inner orbital region R ≲ 1 AU for the disk model  because the shielding factor pgas becomes efficient to decrease the ionization rates. This indicates that the limits ζlim/ζinit in a particular condition of Σdustrm(R) = 0 are about 360, 280, and 43 for R = 0.5, 1, and 5 AU of the disk with
  , and 270 for R = 0.5 AU of the disk with
  , respectively. At the outer orbits R ≳ 2.7 AU an increase in the ratios remains large, but their absolute values are moderate (≲ a few × 10) for all
  .
.
The extreme decrease of the inner solid density ρs in dust aggregates also affects the settling and/or growing times of dust particles. Since the maximum radius of dust particles as for ρs ≲ 10−4 g cm−3 is estimated to be much larger than lgas, the drag force between gas and dust particles begins to follow Stokes' law, rather than Epstein's law, on the way to the midplane, or very probably to z ≈ Z1. In the same way as the analytical investigation of the settling and size growth of a representative dust particle (Nakagawa et al. 1986), we can estimate how these processes and the relevant timescales change due to extremely low ρs of dust aggregates.
The evolution of dust particles in such situations is divided into the following three stages: (1) Dust particles with ρs ≈ 1 g cm−3 stick together to form the dust aggregates such as BCCA clusters, which have the extremely low internal density ρs ≲ 10−4 g cm−3 and a different fractal dimension from three. (2) Dust aggregates further settle and grow in mutual collisions, and eventually their radii exceed the mean free path of gas particles lgas. (3) Dust aggregates continue to settle and grow under Stokes' law of drag force, and their radii gradually approach as with the extremely low ρs. In the case that the drag force is in accordance with Epstein's law (a ≲ lgas), the settling time of a representative dust particle is given by
where a(z) = ainit + as(1 − z/H(R)) is the radius of the dust aggregate at the height z from the midplane and Σgas(R) is basically the same as Σ(R) given by Equation (1). Note that in stage (1) the radius of dust particles a(z) cannot directly relate with z due to the extensive decrease of ρs and the resultant increase of as during the transition from particles to aggregates. If the dust aggregate can settle to the narrow zone of the large ionization rate around the midplane during stages (1)–(2), we can easily estimate from Equation (35) that the settling (growth) time of the dust aggregate becomes somewhat longer than that obtained in Section 4.1.1. This is mainly because the dependence of the coefficient A (see Equation (12)) on ρs and a(z) canceled each other and the resultant factor for the settling time depends on a(z) logarithmically, as can be seen from Equation (35). Thus, the settling time of the aggregate toward a(z) = lgas increases at most by several times.
If a dust aggregate grows further under the Stokes' law of drag force (a ≳ lgas), the settling time in stage (3) is given by
where zl is the height from the midplane for a(z) = lgas. Because the timescale that a(z) becomes as under the Stokes' law is close to tE(zl), the total settling time for the dust aggregate with ρs ≲ 10−4 g cm−3 cannot be different from the value with ρs ≈ 1 g cm−3 obtained in Section 4.1.1 by an order of magnitude. In conclusion, the porous structure of dust aggregates affects moderately both the ratio of the ionization rates and the settling timescale. In order to clarify the precise values of these quantities in the thin layers of various disk models, we need further (numerical) investigation of the settling and size growth of dust aggregates.
Zsom et al. (2010) modeled the growth of dust aggregates at 1 AU in the midplane using the results of laboratory experiments and investigated the maximum aggregate size and mass that can be reached by coalescence. The collision model used was based on a continuous transition of aggregates between compact and porous spheres. They applied the collision model of dust particles to the Monte Carlo method and found that dust particles do not follow the growth–fragmentation cycles: the size growth is stopped by the bouncing barrier rather than fragmentation; the maximum mass of the particle is limited to ∼1 g (chondrule-sized particle). This mass for a compact sphere model is larger than the dust mass so that the energy loss of the emitted electron/positron becomes efficient (see Figures 1 and 2). Because the energy loss of emitted photons can be negligible for dust aggregates of this size, the ionization rates by 26Al and 40K around the midplane increase by factors of about 50 and 19 (see Table 3), respectively, as long as the settling of dust particles toward the narrow zone close to the midplane can be possible.
Dust particles in the protoplanetary disk generally absorb electrons or ions on their surface (Umebayashi 1983). Thus, the electric charge state of dust aggregates affects the fractal growth of aggregates, and the electric repulsion between colliding aggregates can impose a serious limitation on dust evolution (Okuzumi 2009). Okuzumi et al. (2011a, 2011b) generally investigated collisional growth of charged aggregates and found that the aggregates under a certain condition undergo bimodal growth where a certain number of aggregates stop growing due to the electrostatic repulsion and the rest continue growing by colliding with each other. They found that regions where the radionuclides become efficient sources for ionizing the gas can be classified as either bimodal growth, mentioned above, or total-freezeout growth, where all aggregates stop growing with a nearly monodisperse distribution. Furthermore, the charge state of aggregates can delay or prevent the settling of aggregates. Thus, we need a detailed study to clarify its effects on the ionization rates by radionuclides.
In order to understand the physical and chemical evolution of the protoplanetary disks, we must clarify the ionization state in all the evolutionary stages of various disks. Because hard X-ray emission from the central star can penetrate and ionize the disk, we need to calculate the hard X-ray ionization rate as a universal function of the disk structure and X-ray luminosity and temperature, which is similar to the "soft" X-ray ionization rate obtained by Igea & Glassgold (1999). Furthermore, X-rays contribute the photoelectric emission from the dust surface, which can change the charge state of dust particles considerably. We also need a detailed study of this process. When the settling and size growth of dust particles proceed extensively, the charge state of gas and dust particles in the inner region of the disk is affected by the ionization of radionuclides. In addition, both settling and size growth of dust particles vary the total surface area of dust particles, which provide important places for sticking and reaction (especially recombination) of various chemical species in gas phase. Thus, we must investigate the chemical network of gaseous and surface reactions simultaneously, which is beyond the scope of the present series of papers.
The results obtained in Section 4 depend slightly on models of the protoplanetary disk. As long as the state of a disk is quiescent enough to proceed the settling of dust particles, an increase in the ionization rates around the midplane occurs in the orbital region where the surface density is much larger than the range of energetic particles emitted by the decay of radionuclides, Σ(R) ≳ 100 g cm−2. Essentials are the physical situations of a gaseous disk, i.e., whether or not the settling and the size growth of dust particles can proceed to a considerable extent in an actual disk. The turbulent motion of the gas affects both settling and size growth of dust particles, which are the competitive processes to the change of the ionization rates by radionuclides. Thus, we must investigate the settling and size growth of dust particles in disks of different turbulent strengths and clarify the physical conditions under which turbulent motion becomes important to the change of the ionization rates by radionuclides. We will deal with these issues in Paper II.
We thank the anonymous referee for careful reading of the manuscript and his comments, which were greatly helpful in improving our paper. We also thank Eric Feigelson for suggesting the importance of hard X-ray emission from YSOs to the ionization of disk. One of the authors (T.U.) is grateful to Y. Nakagawa for his hospitality in CPS.
APPENDIX A: MEAN FREE PATH IN A GAS MIXTURE
Here we simply assume that molecules are smooth rigid elastic spheres not surrounded by force fields. Molecules affect each other's motion only at collisions in this case.
Consider collisions occurring between pairs of molecules of masses and diameters m1, m2 and d1, d2 in a gas mixture at rest in a uniform steady state. The total number of collisions between two molecules per unit volume and time is given by
where n1 and n2 are the number densities of molecules 1 and 2, and σ12 = πd122 = π(d1 + d2)2/4 and μ12 = m1m2/(m1 + m2) are the geometric cross section for mutual collisions and reduced mass, respectively (for details see, e.g., Chapman & Cowling 1990). Changing the suffix 2 to 1 in Equation (A1), we get the number of collisions between pair of molecules 1,  simply because N11 counts each collision between a pair of molecules twice over. On the other hand, it should be noted that the average number of collisions of any one molecule with similar molecules per unit time is N11/n1 since each collision affects both molecules at once.
The collision interval for molecule 1, or mean time between successive collisions with all kinds of constituents, is

where the number of terms in the bracket is equal to the number of constituents in the mixture. The mean free path is the mean distance l1 traveled by a molecule 1 between successive collisions in a given time t. Dividing the total distance  traveled by molecules 1 in this time by the total number of their collisions n1t/τ1, we obtain

where  is the mean value of the thermal speed for molecules 1 and
  corresponds to the average cross section for mutual collision of molecules 1.
For the gas in the protoplanetary disk, we can consider only H2 molecules and He atoms (hereafter denoted by suffixes 1 and 2) as neutral constituents in the mixture. The mean free path of neutrals ln is found to be
Using the number density of neutrals nn = n1 + n2, the average cross section for mutual collisions of neutrals is given by  .
.
The data used for numerical calculation, the average cross sections for mutual collisions, and mean free paths at Earth's orbit (see Equation (13)) in the MMSN obtained for a gas mixture with solar abundance (X = 0.73, Y = 0.25) are summarized in Table 4. The average collisional cross section of He atoms  is seemingly large, because this value, defined as
  , corresponds closely to the geometric cross section for mutual collisions times the ratio of the number densities nn/n2 (≈7).
Table 4. Average Cross Sections for Mutual Collisions  and Mean Free Paths li at the Orbit R = 1 AU in the MMSN for Neutral Gas Constituents i in a Gas Mixture with Solar Abundance
| Constituent | Diameter | Cross Section | Mean Free Path | |
|---|---|---|---|---|
| (i) | di (cm) |  (cm2) (cm2) |
li (cm) | |
| H2 | (1) | 2.2 × 10⁻⁸a | 2.54 × 10⁻¹⁵ | 1.32 |
| He | (2) | 2.4 × 10⁻⁸ | 1.95 × 10⁻¹⁴ | 1.01 |
| Neutral | (n) | ... | 2.24 × 10⁻¹⁵ | 1.28 |
Note. aThe diameter is estimated to be d1 = 3r1, where r1 = 7.41 × 10⁻⁹ cm is the internuclear distance of the H2 molecule.
Download table as: ASCIITypeset image
APPENDIX B: AVERAGE TRAVELING PATH LENGTH OF THE ENERGETIC PARTICLE EMITTED IN DUST PARTICLES
Based on the assumptions described in Section 3.2, we calculate analytically an average traveling path length 〈s〉 of the particles emitted by the decay of nuclide X in dust particles.
We consider a spherical dust particle of radius a and take a coordinate system in which its origin O is in the center of the dust particle and position A, where an energetic particle is emitted, is on the z-axis. Letting position B on the surface of the dust particle be the end point of the path of the emitted particle, we obtain the length s of line segment AB as

where r and θ are the distance from the origin O to A and the angle between the line AB and the z-axis, respectively. Using the assumption that the direction of the emitted particle is isotropic around A, the length  averaged over the emitted solid angle Ω is given by
where φ is the azimuthal angle of line segment AB in the above coordinate system.
To obtain the average traveling path length 〈s〉 of the emitted particle, we must further average  over position A, which is assumed to be distributed uniformly throughout the volume V of the dust particle. We also calculate it analytically and obtain
Thus, we can approximately regard that the average path length 〈s〉 of the emitted particle in the dust particle is somewhat smaller than its radius a.
In the case of positron annihilation two photons are emitted in the exactly opposite senses and the traveling path lengths of these photons in dust particles are correlated with each other. Hence, we must average the length s more carefully.
Let the positions B and C on the surface of the dust particle be the end points of the paths of two photons emitted in the opposite senses. Then the lengths sAB and sAC of line segments AB and AC are given by
where θ is the angle between the line AB and the z-axis as above. If we restrict θ to a value less than a right angle (0 ⩽ θ ⩽ π/2), sAB normally represents the shorter traveling path length s− of the emitted photons and sAC represents the longer one s+. Averaging s± over the solid angle Ωθ with this restricted extent of θ, we obtain the mean lengths of short and long traveling paths of photons emitted simultaneously. The results are as follows:
Note the position A corresponds to the spot where the positron annihilation occurs and that its distance from the origin r in Equations (B5) and (B6) is roughly equal to the range 〈s(e+)〉 of this positron.